Transcription
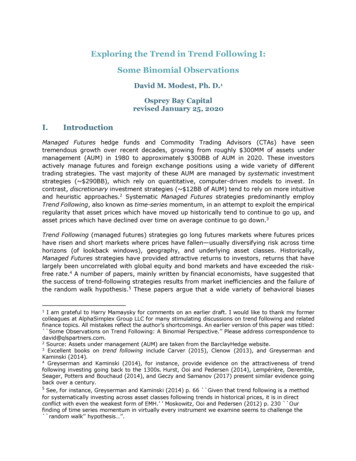
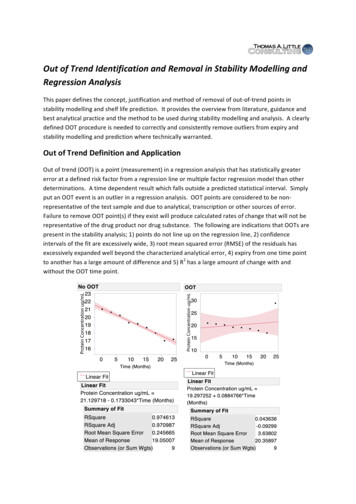
Out of Trend Identification and Removal in Stability Modelling andRegression AnalysisThis paper defines the concept, justification and method of removal of out-of-trend points instability modelling and shelf life prediction. It provides the overview from literature, guidance andbest analytical practice and the method to be used during stability modelling and analysis. A clearlydefined OOT procedure is needed to correctly and consistently remove outliers from expiry andstability modelling and prediction where technically warranted.Out of Trend Definition and ApplicationOut of trend (OOT) is a point (measurement) in a regression analysis that has statistically greatererror at a defined risk factor from a regression line or multiple factor regression model than otherdeterminations. A time dependent result which falls outside a predicted statistical interval. Simplyput an OOT event is an outlier in a regression analysis. OOT points are considered to be nonrepresentative of the test sample and due to analytical, transcription or other sources of error.Failure to remove OOT point(s) if they exist will produce calculated rates of change that will not berepresentative of the drug product nor drug substance. The following are indications that OOTs arepresent in the stability analysis; 1) points do not line up on the regression line, 2) confidenceintervals of the fit are excessively wide, 3) root mean squared error (RMSE) of the residuals hasexcessively expanded well beyond the characterized analytical error, 4) expiry from one time pointto another has a large amount of difference and 5) R2 has a large amount of change with andwithout the OOT time point.
Figure 1.0 OOT Illustration and Influence of OOT“OOT stability data can be described as a result or sequence of results that are withinspecification limits but are unexpected, given the typical analytical and sampling variationand a measured characteristic's normal change over time (e.g., an increase in degradationproduct on stability).”1Regression analysis is normally used to determine change over time and associated 95%confidence limits relative to rates of change and expiry. ICH Q1A(R2) Stability Testing OfNew Drug Substances and Product states:“The nature of any degradation relationship will determine whether the data shouldbe transformed for linear regression analysis. Usually the relationship can berepresented by a linear, quadratic, or cubic function on an arithmetic or logarithmicscale. Statistical methods should be employed to test the goodness of fit of the dataon all batches and combined batches (where appropriate) to the assumeddegradation line or curve.”OOT evaluation and elimination should be used for the following applications andprediction; 1) shelf-life estimation, 2) storage evaluation, 3) impurity formation andtrending, 4) in-process monitoring and prediction and 5) tracking and trending of lotperformance.Likely Root Causes for OOTThe following are typical possible sources and mechanisms for OOT events that may occur duringstability evaluation:§Sample selection and sample handling errors§Dilution and sample preparation errors§Sample materials and plate errors§Temperature, reaction time and pH effects errors§Vendor and lot variation on critical reagents§Flow rates and process time errors§Analyst errors§Instrument variation and calibration error
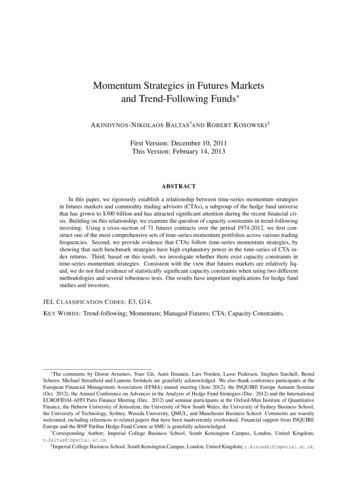
§Nonstandard test procedures and not following the method SOP§Drift in standards or reference materials§Stability of test samples or critical reagents§Calibration or compensation errors§Interaction and composite errors§Expiry of bulk materialsHistorical Approaches to OOTThe following are typical historical approaches to OOT identification and removal. They arenot considered to be statistically sound methods for OOT identification and removal. The difference between consecutive results is outside of half the difference betweenthe prior result and the specification The result is outside 5% of initial result The result is outside 3% of previous result The result is outside 5% of the mean of all previous resultsThere is no statistical basis for the above definitions of OOT and does not take into accountprocess nor method variation. These are not recommended approaches.Closed Loop Approach to OOT Identification and RemovalA best practice approach to OOT determination and removal is to see it as a part of a closedloop control system during stability monitoring and expiry prediction. The five steps to aclosed loop system for OOT are 1) addition of new time points and data, 2) OOTidentification, 3) OOT determination and point removal where warranted, 4) OOTverification and evaluation of OOT influence and 5) stability and performance prediction.
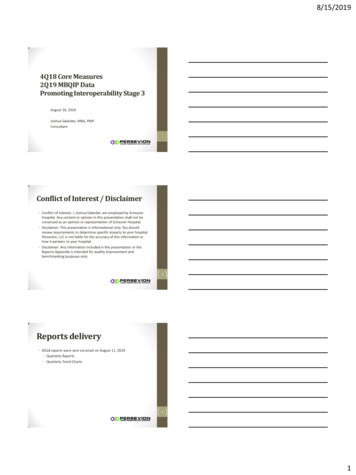
Figure 2.0 Closed Loop OOT Identification and ResolutionAdding New Time PointsAs each new time point is added to the stability analysis they should be checked for OOTpotential. If they are within the criteria for OOT identification then rates of change, expiryetc. are determined. OOT identification, determination and verification are used if newtime points appear to be suspect.OOT IdentificationThere are four methods to identify a point as OOT, 1) visually, 2) outlier boxplot of theresiduals, 3) multivariate Jackknife Distances and 4) control chart of the residuals. Jackknifedistances are the most sensitive in identification of OOT points in a regression analysis asthey include and remove each time point in the analysis to evaluate their influence in themodel. Once you believe you have identified an OOT the next step is to test it to determineif the OOT will be removed. Root cause as to why the point is OOT is a secondaryinvestigation once the point has been determined to be OOT. Once the point is determinedto be a possible OOT the point is tested statistically to determine if it is or is not OOT.
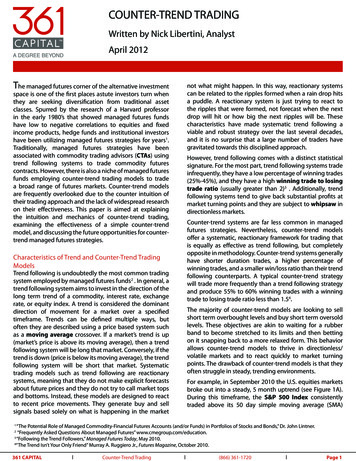
Figure 3.0 Visual AnalysisFigure 4.0 Outlier Box Plot of ResidualsFigure 5.0 Multivariate Jackknife DistancesFigure 6.0 Control Chart of ResidualsOOT DeterminationThe following is the recommended procedure for OOT outlier determination. Exclude andhide the suspected OOT point in the data analysis. Fit a linear regression line with thepotential OOT time point excluded. Save the predicted response (concentration) from thelinear fit. Calculate the difference (Delta) at each time point. Calculate a z score for eachtime point.z score (Measurement-Predicted)/stdev(residuals with point removed)
Once the z score for the OOT has been calculated it can be compared to a risk threshold. Ak-sigma of 2.576 or 99% risk is used to set the limit for OOT detection. Abs(z) 2.576 (99%)is OOT so in this example z is -27.238 so it is OOT. A z score with a limit is the best methodof OOT detection. The key difference with this procedure and other z score procedureswritten in the literature is the z score is evaluated with the point removed. This correctlyscales the residual error so that the influence of the OOT point is not included in the residualerror and the OOT time point can be correctly evaluated based on the other measurementserror.Figure 7.0 OOT DeterminationFigure 8.0 Stability Analysis with OOT Removed
OOT VerificationTo verify the influence of the OOT the following measurements are recommended; 1)change in R2, 2) change in RMSE and 3) change in expiry calculation. Comparing with orwithout the OOT time point will verify the influence of the time point and confirm the needfor removal. If the change in the three identified measures are trivial then the OOT has notbeen verified and its removal is not warranted. Differences in R2, RMSE or Expiry of 3% orless are generally not practically important to drug substance or drug product expiry orstability evaluation. Verification is performed by including then removing the OOT point inthe stability evaluation and then measuring the change in the key performance metrics ofthe fit and the prediction. Also RMSE error can be compared to the repeatability of theanalytical method to determine if the residual error is primarily analytical measurementerror.A control chart of the residuals with the OOT time point excluded will be a secondaryconfirmation of OOT identification and removal as an outlier.Figure 9.0 Control Chart of ResidualsStability PredictionOnce the OOT point has been removed and verified, stability prediction can then beperformed per ICH Q1E. OOT points should always be included in the plot to indicate themeasurement but tagged as OOT to indicate the point was included in graph but notincluded in the analysis. Including it in the plots will provide full disclosure as to allobservations at all time points. Once a point has been determined to be OOT it does notrenter the analysis as additional data is added to the stability prediction.Single Factor, Single Batch and Multiple Factor/Multiple Batch OOTThe technique for outlier works equally well for single batch single factor versus multiplebatch and multiple factor stability modelling and expiry prediction. The example provided
was for a single batch, single factor analysis. For the multiple factor and or multiple batchcondition the same approach would be used. The model would be fit with the OOTremoved and then the model would be saved, z scores would be calculated for all timepoints and then OOT would be determined based on a 2.576 (99%) threshold.ConclusionsOOT Determination is a powerful addition to any stability program and needs a clearlydefined SOP to consistently apply the logic to day-to-day stability evaluation. Including anOOT protocol to stability testing and data analysis will produce more statistically reliablestability determination and expiry prediction. OOT determination based on the protocoldescribed in this paper opens the door for the automation of OOT determination andremoval from any stability analysis and may be the best approach to systematically evaluateall time points in stability analysis.ReferencesICH Q1A(R2) Stability Testing Of New Drug Substances, Feb 2003ICH Q1E Evaluation for Stability Data Feb, 2003Pharmaceutical Technology (2003) Trajkovic-Joleska, Torbovska. Method for Identificationof Out-of-Trend Stability Results.Pharmaceutical Technology (2003). A Review of the Potential Regulatory Issue and VariousApproaches. PhRMA CMC Statistics and Stability Expert Teams.Pharmaceutical Technology (2005). Identification of Out-of-Trend Stability Results, Part IIPhRMA CMC Statistics, Stability Expert Teams.Thomas A. Little, PhD12401 North Wildflower LaneHighland, UT 84003 USAdrlittle@dr-tom.com925-285-1847
ICH Q1A(R2) Stability Testing Of New Drug Substances, Feb 2003 ICH Q1E Evaluation for Stability Data Feb, 2003 Pharmaceutical Technology (2003) Trajkovic-Joleska, Torbovska. Method for Identification of Out-of-Trend Stability Results. Pharmaceutical Technology (2003). A Review