Transcription
Exploring the Trend in Trend Following: Q Group PresentationDavid M. Modest, Ph. D.October 19, 2020STRICTLY CONFIDENTIAL. NOT FOR DISTRIBUTION.
DisclaimerThis presentation is for the Q Group Fall 2020 October 19, 2020 and is for information purposes only. Theinformation in this presentation is believed to be accurate as of the date set forth on the cover. OspreyBay Capital is under no obligation to update this information. This presentation does not confer any rightson the recipients or impose any obligations on Osprey Bay Capital. This presentation is provided fordiscussion purposes only, is only a summary of certain information, is not complete, does not containcertain material information and is subject to change without notice. No assurances can be given thatinvestment objectives will be achieved, and investment results may vary substantially on a quarterly orannual basis. As with any hedge, private equity, or venture fund, past performance cannot assure anylevel of future results. Actual returns for each investor may be different due to timing of investments. Thispresentation is neither an offer nor a solicitation to buy an interest in any fund managed by Osprey BayCapital, which can only be made pursuant to a confidential private placement memorandum and only in ajurisdiction where permitted. The information contained herein is confidential and is intended solely forconference participants. Delivery of this presentation to anyone other than the recipient or his designatedrepresentative is unauthorized, and any other use, reproduction, distribution or copying of this documentor the information contained herein, in whole or in part, without the prior written consent of Osprey BayCapital is strictly prohibited.PAGE 2STRICTLY CONFIDENTIAL. NOT FOR DISTRIBUTION. PREPARED FOR THE EXCLUSIVE USE OF THE INTENDED RECIPIENT.
BackgroundSTRICTLY CONFIDENTIAL. NOT FOR DISTRIBUTION.
Research MotivationBertrand Russell: When you are studying any matter or considering anyphilosophy ask yourself only what are the facts and what is the truth that thefacts bear out. Never let yourself be diverted either by what you wish tobelieve or by what you think would have beneficent social effects if it werebelieved, but look only and surely at what are the facts.’’Research grew out of twenty months as Chief Investment Officer ofAlphaSimplex Group (ASG) LLC from December 2016 to August 2018 ASG (a Natixis subsidiary) focuses on liquid alternative strategies (i.e.strategies with daily liquidity). The two primary strategies are:- Managed Futures: multi-model, multi-horizon pure trend followingstrategy implemented using futures and forward contracts- Global Alternatives: seeks to replicate the exposures of hedge funds toa diverse set of risk premia Currently working on four papers that grew out of my experience therePAGE 4STRICTLY CONFIDENTIAL. NOT FOR DISTRIBUTION. PREPARED FOR THE EXCLUSIVE USE OF THE INTENDED RECIPIENT.
Diminishing Returns for the Managed Futures IndustryAverage returns have decreased as assets-under-management(AUM) in Managed Futures strategies have risen from roughly 300MM in 1980 to 300BB today.Average ReturnsStart DateSG TrendBTOP 50Jan 2000Jan .6%2.7%2010s2.0%1.0%0.5%Direction of performance and fund flows consistent with Berk and Green(JPE 2004) . although adjustment period appears lengthyNote: Average annual returns on the SG Trend and BTop50 indices computed from return data on BarclaysHedgewebsite. The risk-free rate data is taken from Ken French’s website.PAGE 5STRICTLY CONFIDENTIAL. NOT FOR DISTRIBUTION. PREPARED FOR THE EXCLUSIVE USE OF THE INTENDED RECIPIENT.
Difficult Investing Experience for Retail InvestorsExperience for investors has been worse than the time-weighted average returnsCUMULATIVE PROFITS AND FEES SINCE es(MF)MF HighVolatilityJuly 2010Feb 2010August 2013Est Profit- 158.8- 1,050.2- 166.1- 1,216.3Est Mgmt Fees 220.4 673.9 43.9 717.8Est Total Fees 270.4 830.9 50.4 881.3Inception DateAQR TotalNote: Cumulative profits from inception through June 2020.Since the beginning of 2016, AQR’s retail investors have lost 2.4BB in their Managed Futures products (regular and high-volatility) . and ASG’s retail investors have lost 300MM in their retail productsNote: Estimated profits are derived from return and AUM data provided in the CRSP mutual fund database. Estimatedfees are derived from CRSP AUM data and fee disclosures reported on the SEC Edgar database. Profits and fees arecumulative estimates since inception based on end-of-month values through June 2020.PAGE 6STRICTLY CONFIDENTIAL. NOT FOR DISTRIBUTION. PREPARED FOR THE EXCLUSIVE USE OF THE INTENDED RECIPIENT.
Back to BasicsSTRICTLY CONFIDENTIAL. NOT FOR DISTRIBUTION.
Back to Basics IWhat do we truly know and what are we assuming?Explicit AssumptionsImplicit Assumptions (examples) Buy what has gone up andsell/short what has gone done Expected utility is maximized byfollowing a momentum strategy Even if you think there is a 95%chance that an asset which hasgone down will rebound, you stillwant to be short Trend follower preferred an Italian10-year bond trading at 80 basispoints in Sept 2019 to the samebond trading at 183 basis points inAugust 2019 Use multiple lookbackwindows to assess trenddirection Optimal weighting of the windows isrelatively unchanged over time Barbell approach with most of theweight 3 and 8 months Capital decisions are based onrisk rather than notionalallocations Benefits of increased diversificationoutweigh leverage risks associatedwith leveraged bond and otherleveraged positionsPAGE 8STRICTLY CONFIDENTIAL. NOT FOR DISTRIBUTION. PREPARED FOR THE EXCLUSIVE USE OF THE INTENDED RECIPIENT.
Back to Basics IIWhat do we truly know and what are we assuming continuedExplicit AssumptionsImplicit Assumptions (examples) Allocate risk equally between4 major asset classes(equities, bonds, currenciesand commodities) based ontrend signals Historical volatility andcorrelations provide usefulforward-looking estimatesNegative gamma trading strategyis not too costly given the inverserelation between price & volatilityEqual risk weighting (a.k.a. risk parity)improves diversification (relative tonotional weighting) and reduces tailrisk (c.f. Bridgewater All WeatherStrategy) Historically over the last 40 years,managed futures have beenstructurally long equities and longbonds S&P500 index 111 on 1/1/80and 3408 on 10/5/20PAGE 9STRICTLY CONFIDENTIAL. NOT FOR DISTRIBUTION. PREPARED FOR THE EXCLUSIVE USE OF THE INTENDED RECIPIENT.
Back to Basics IIIWhat do we truly know and what are we assuming continuedExplicit AssumptionsImplicit Assumptions (examples) Ten-year U.S. yields droppedfrom 16% in the early ‘80sto 8.5% at the beginning ofthe ‘90s to 4% at thebeginning of the newmillennium to 1% todayEqual risk weight of long equitiesand long bonds has provided anatural hedge to equity crash risk Historically, you have beenpaid to receive this crashprotection (given theupward sloping yield curve) 15 trillion of global debthas negativePAGE 10STRICTLY CONFIDENTIAL. NOT FOR DISTRIBUTION. PREPARED FOR THE EXCLUSIVE USE OF THE INTENDED RECIPIENT.
Back to Basics IVWhat do we truly know and what are we assuming continued continuedExplicit AssumptionsImplicit Assumptions (examples) Allocate risk equally withinasset classes to individualassets Equal risk weighting has desirablemean-variance properties whenthe asset classes have roughlyidentical ex-ante Sharpe ratios(ceteris paribus)The diversification potential ofinvesting in many different individualassets is not severely impinged by theintegration of global marketsThere is sufficient liquidity at theindividual asset levelPAGE 11STRICTLY CONFIDENTIAL. NOT FOR DISTRIBUTION. PREPARED FOR THE EXCLUSIVE USE OF THE INTENDED RECIPIENT.
Some Binomial ObservationsSTRICTLY CONFIDENTIAL. NOT FOR DISTRIBUTION.
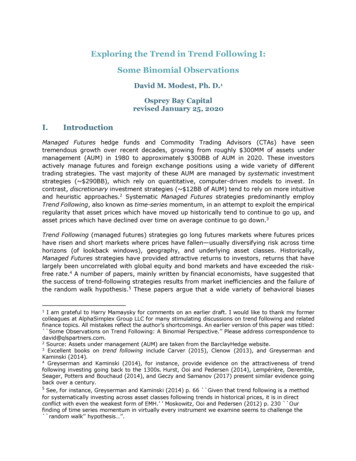
Simple Binomial FrameworkHypothetical Profits to a Long-Only Investor 40 30 20 20Assume constantnotional investment of 100 over time 10 10 0 0 0- 10- 10- 20- 20- 30- 40Date 0Date 1Date 2Date 3Date 4STRICTLY CONFIDENTIAL. NOT FOR DISTRIBUTION. PREPARED FOR THE EXCLUSIVE USE OF THE INTENDED RECIPIENT.Binomial tree showscumulative profits as ofgiven date
Probability Distribution of Long-Only ProfitsAssume heads and tails are equally 00%0.00%-40-2002040PAGE 14STRICTLY CONFIDENTIAL. NOT FOR DISTRIBUTION. PREPARED FOR THE EXCLUSIVE USE OF THE INTENDED RECIPIENT.
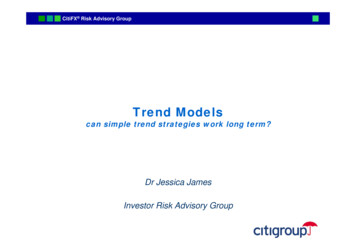
Trend Following Profits with a Fair CoinProfits associated with sixteen possible outcomes for long-only and (fast) trend following strategies.GREEN indicates positiveoutcome (profit) for thestrategy and RED indicatesnegative outcome (loss).Table 1: Hypothetical Outcomes and uudduudduddduuduududududduddDate 4Darte 3PathDate 2Trend OutcomesDate 1Consider a (fast) trendfollowing strategy where thetrend follower starts long themarket. If heads is tossed, thetrend follower stays long, but iftails is tossed the trend followergoes short. This is a fast trendfollowing strategy in that nextperiod’s position only dependson the outcome of this period’scoin toss.uduuudduduudddudCumulative ProfitsFastLong 0-40402000020-200-20-40020-20-20020PAGE 15STRICTLY CONFIDENTIAL. NOT FOR DISTRIBUTION. PREPARED FOR THE EXCLUSIVE USE OF THE INTENDED RECIPIENT.
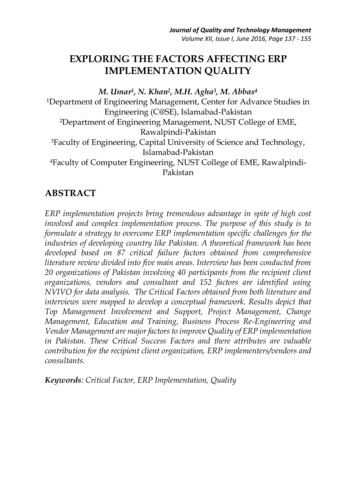
Trend Following Generates Crisis AlphaBy construction, if large losses over time are the result of repeatednegative events, trend following will provide crisis alpha.Figure 3: Average Trend Profit and Crisis AlphaConditional on Long-Only Profit 70 60 50 40 30 20 10 0- 10- 20 40 20Trend Profit 0- 20- 40Crisis AlphaPAGE 16STRICTLY CONFIDENTIAL. NOT FOR DISTRIBUTION. PREPARED FOR THE EXCLUSIVE USE OF THE INTENDED RECIPIENT.
Observation #1For both strategies, maximum profit 40, maximum loss - 40, expectedprofit 0 and the variance of profits 400In this simplified binomial setting with no trend inasset prices, the trend-following strategy: Has the same expected profits and variance ofprofits as a long-only investment strategy. Thent dynamic nature of the trend-followingua ysisQstrategyshapes the return distribution andalAnsubstantially changes WHEN the profits andlosses occurPAGE 17STRICTLY CONFIDENTIAL. NOT FOR DISTRIBUTION. PREPARED FOR THE EXCLUSIVE USE OF THE INTENDED RECIPIENT.
Observation #2Trend Following produces crisis alpha even in an efficient market (whenlarge losses are due to repeated negative outcomes).Although there is nothing “smart” about this simple trend-followingstrategy, it is able to generate “crisis alpha’’ and prevent losses inthose states of the world when the long-only investor is mostseriously affected—despite the absence of predictable trends inntasset prices.ua sisQ alyAnPAGE 18STRICTLY CONFIDENTIAL. NOT FOR DISTRIBUTION. PREPARED FOR THE EXCLUSIVE USE OF THE INTENDED RECIPIENT.
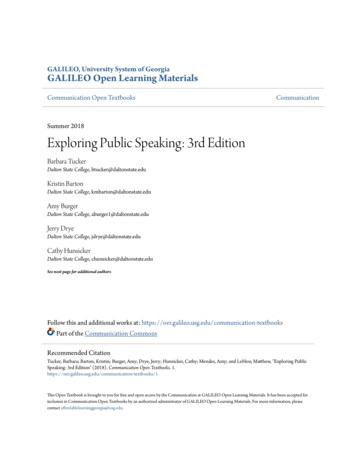
Long Call Option ProfitsAlso well known that other dynamic strategies can change thetiming of when you make and lose moneyGrossOptionPayoutNetOptionPayout 40 30 25.625 20 10 5.625 0 0- 4.375- 20 0- 4.375- 40Date 4 0- 4.375Figure 4: Cumulative Hypothetical Profits toLong-Only and Long Call InvestorsConsider acall optionwith anexercise priceof 10 30 20ntua ysisQ al 0nA 10 10 0- 10- 10- 20- 30Date 0Date 1Date 2Date 3PAGE 19STRICTLY CONFIDENTIAL. NOT FOR DISTRIBUTION. PREPARED FOR THE EXCLUSIVE USE OF THE INTENDED RECIPIENT.
Long Call Option ProfitsOwning a call option also generates crisis alphaFigure 5: Average Long-Call Profit and Crisis AlphaConditional on Long-Only Profit 70 60 50 40 30 20ntua ysisQ alAn 10 0- 10- 20 40 20 0Long Call Net Payoff- 20- 40Crisis AlphaPAGE 20STRICTLY CONFIDENTIAL. NOT FOR DISTRIBUTION. PREPARED FOR THE EXCLUSIVE USE OF THE INTENDED RECIPIENT.
Observation #3Owning a call option produces crisis alpha although noabnormal profit in an efficient market.Buying (and selling) options is an example of another dynamicinvestment strategy that can shape the conditional distribution ofprofits—i.e., when profits occur—even though the first two momentsof the unconditional distribution are unaffected.ntua ysisQ alAnPAGE 21STRICTLY CONFIDENTIAL. NOT FOR DISTRIBUTION. PREPARED FOR THE EXCLUSIVE USE OF THE INTENDED RECIPIENT.
Trend Following Profits with an Unfair CoinProfits associated long-only, fast- and slow trend following strategies whenprobability of an up market exceeds the probability of a down market.Table 3: Hypothetical Outcomes and PayoffsGREEN indicatespositive outcome(profit) for thestrategy and REDindicates negativeoutcome ity of Heads 50%Probability of Heads 65%Date 4Darte 3Date 2Slow Trend OutcomesInitial Position: NeutralDate 1Date 4Darte 3PathDate 2Fast Trend OutcomesInitial Position: NeutralDate 1Fast trend-followingstrategy depends onlyon last period’soutcome. Slow trendstrategy depends onlast 2 period’soutcomes.uduuudduduudddudCumulative Profits Periods 2-4Long OnlyProfitsFastTrendProfitsSlowTrendProfits 30 10 10 10 30- 10- 10- 10 10 10 10- 30- 10- 10- 10- 30 30 10- 10- 10 10 10- 30- 10- 10- 30 10 10- 10- 10 10 30 20 0 0 0 10- 20 0- 10- 10 0- 20 10 0 0 0 20 0.00 9.00Expected Profit 0.00 2.70 0.00 2.00PAGE 22STRICTLY CONFIDENTIAL. NOT FOR DISTRIBUTION. PREPARED FOR THE EXCLUSIVE USE OF THE INTENDED RECIPIENT.
Observation #4Trend Following can generate positive expected returns anddeliver crisis alpha even in an efficient market.In general, trend-following strategies will earn positive profits—evenin efficient markets—as long as asset prices have a consistentlypositive (or n
Trend Following produces crisis alpha even in an efficient market (when large losses are due to repeated negative outcomes). t s Although there is nothing “smart” about this simple trend-following strategy, it is able to generate “crisis alpha’’ and prevent losses in those states of the world when the long-only investor is most seriously affected—despite the absence of predictable .