Transcription
AbstractThe purpose of this paper is to provide a usable framework for detecting, measuring andexploiting trends in financial markets. Using technical analysis (TA) indicators we challenge EfficientMarket Hypothesis (EMH) that says that markets are random and that is not possible to regularlyoutperform a passive investment strategy.If a fair coin is flipped a thousand times, it is bound to land on one side at least a few times in arow. Similarly, stocks may go in one direction for a few days in a row. Occasionally, such runs repeata few times in a month. When looking at a chart of such stock, one would say there was a trend.This is in line with Efficient Market Hypothesis. Indeed, if every up day was followed by a down day,markets would be perfectly predictable. In other words, existence of trends is an expectedconsequence of EMH.Trends in financial markets have been researched by many trend followers as well asacademics. Traders simply find trends and trade according to the old saying “cut losses short and letwinners ride”. Academics, on the other hand, say trends can be found even in random walk data, likea coin that landed on heads a few times in a row. Therefore, they say, any profits arising from trendtrading must be explained by luck. Both parties seem to agree that trends exist, but there is noconsensus on how to measure market trends and whether success of trend followers is due to luckor skill.The first part of this paper presents research of market trends and shows reasons why trendfollowing should be a profitable approach to trade markets. We point out Hurst exponent's flaws thatrender it useless to detect long term memory in market prices. As an alternative, we propose to usetrading systems and TA indicators. We introduce a new TA indicator called “Min-Max” that can beused to read prevailing market direction. We follow trends using this indicator alongside with SimpleMoving Average and compare results against trend following on various types of random walk data.If markets are mean reverting by nature, trends would be shorter and weaker than those in randomwalk data. In this case trend following using TA indicators would be unprofitable. On the other hand,if markets are trending by nature, trends found in historical prices would be stronger and longer. As a
consequence trend following would show profitability. Our tests confirm that historical prices trendmore than random walk data. By detecting this difference, this paper will show that trend followingwith TA indicators regularly outperforms passive investment strategies and generates out-sizedreturns.For this research we used historical market data that include stocks, commodities, currenciesand indices dating back to 1971 where possible. Such a wide range and a long period of time allowsus to measure reactions to events such as the crashes of '87 and '97, invention of the Internet, theInternet stocks bubble, attacks of 9/11, Russia's default, the Argentine economic crisis, the formingof the European currency and many more that influenced markets around the world. For randomdata we used a computer simulated fair coin toss where the price has an equal probability of goingup and down. We also test random data with artificially introduced random trend elements. Suchdata has weak, but unpredictable, trends that can be exploited by a good trading system. For the lasttype of random data, we used scrambled historical prices. Scrambling removes price's long termmemory and therefore makes data more similar to a fair coin toss data.The second part of this paper is an example of a quantitative trend following strategy, thatcombines SMA with the Min-Max indicator. The strategy is fully mechanical and is very simple toimplement and follow in live trading. This strategy beat the S&P 500 index by a wide margin on years1991 to 2010. We also backtested this strategy on random data, showing that hypothetical profitearned on historical market prices is significantly larger than profit earned on random data.In the last part of this paper, we use two hypothesis testing methods to show how the results ofour trading strategy could not be achieved simply by luck. The first method is a P-value measure onthe difference between profitable and unprofitable days. In the second method, we use random buyand sell orders to generate 75000 random historical results, each with the number of trades equal toour historical testing. Both methods show how unlikely it is to achieve positive results by luck, andthus confirm this strategy's ability to exploit a market inefficiency.
Theoretical basis and a practical example of trend followingŁukasz WojtówZamość University of Management and Administration*) Łukasz Wojtów can be contacted at lukasz.wojtow@gmail.com
Table of Contents1. Introduction.52. Random Data.63. Trend measures.73.1 The Hurst exponent.73.2 Simple Moving Average as a measure of trends.83.3 The Min-Max Indicator.103.4 Conclusions.124. Reasons for trends in financial markets .125. Example trading system.135.1 Risk adjustment.145.2 Results.165.3 Price shocks.216. Statistical significance of achieved results.217. Conclusions.248. Appendix I – Historical market prices.259. Appendix II – Trading cost.2710. References.28
1. IntroductionThere are two schools of thought when it comes to financial markets: one is Efficient MarketHypothesis (EMH) that claims markets and their participants are rational, never make mistakes andprice changes are randomly distributed. According to EMH believers, success in trading is only due toluck. Because markets are random, the probability of beating the stock market in any given period is50 %. Therefore, out of 1000 investors, there will be 500 that beat the market in one year. Out of those500, there will be 250 that beat the market in two years in a row and so on. Out of one million investorsthere will be one who beats the market 20 years straight. But is probability of beating stock marketreally 50 % and what does this number actually mean? Surely not all strategies are equal. For example,selling highly leveraged naked options is a certain way to go bankrupt. If chances depend on approachand leverage, perhaps there is a way to make them higher than 50 %? For example, if markets havetendency to trend, then trading in the direction of main trend should put the odds in traders' favour.On the other side of the argument there are traders who claim markets are not rational, to a smallextent predictable and inefficiencies can be exploited to generate out-sized returns. Traders who knowthis, trade only when probabilities are on their side. But who is on the other side of the trade? If allmarket participants are rational and never make mistakes, how come one is buying and the other one isselling at exactly the same price and time? Does successful trading boil down to finding those mistakesand taking the other side of the trade? Is trading against a trend a mistake?This paper provides empirical research and statistics of long term market trends in order toanswer these questions. In our research we use mostly traded stocks, indices, currency pairs andcommodities. Chapter 2 introduces various types of random walk data that will be used to comparetrends characteristics with real market data. Chapter 3 shows different measures of trends, showing thatreal prices trend more than random walk data. Chapter 4 tries to provide reasons for trends in financialmarkets while Chapter 5 is an example of a trend following method. Chapter 6 discusses the statisticalsignificance of the achieved results.5
2. Random DataTechnical Analysis (TA) is based on the assumption that past prices can influence thefuture, that is, decision making is based solely on past prices. Of course, such an approach will never beprofitable with random data. Although it is still possible to find similar TA signals (chart patterns,moving averages crossovers and so on), making trading decisions is futile, as future prices are notinfluenced by the past. It is interesting to see how various trading systems and measures of trendsperform with different types of random data compared to real market data. By finding quantitativedifferences, we can identify inefficiencies that can be utilized to generate alpha.For the purpose of this paper, we introduced three types of random data:1. Data simulating a fair coin toss. For each head a security's price rises 1.010101010101 %, foreach tail, a security's price falls 1 %. The difference between the rise and fall values isnecessary to compensate for so called “drag”, i.e. adding 1 % and subtracting 1 % yields priceequal to 99.99 % of the original price. If this were repeated a sufficient number of times,the price would eventually fall to zero. Twenty different securities were generated, each with10400 prices (“days”), simulating 40 years of history.2. Biased coin toss. For each head, a security's price rises 1.010101010101 %; for each tail,security's price falls 1 %. Only one coin is tossed at a time, but there are two coins insimulation: one has a 51 % chance to land on heads and the other a 51 % chance to land ontails. Each coin is tossed a random number of times (between 0 and 1000) and thenreplaced by the other coin. We don't know which coin is being used at any given moment.This type of data will have weak trends, but it is not possible to predict the price muchfurther in advance because of its random nature. Again, 20 securities were generated, 10400days each.3. Scrambled real data. We used markets' historical daily changes to create new time series,but days and securities were chosen in random order. For example, we started quotes at6
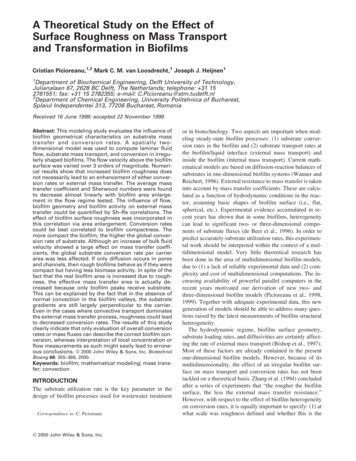
1000. To simulate next day we added DJIA's percentage change on 10th September 1982. Forthe next day we used Bank of America's change on 23rd August 2009, for another day weused gold's change on 5th February 2002, and so on. As each day is is used, it is removedfrom the pool of available changes. The total number of available days was 187514, out ofwhich 20 different securities were generated. This type of data will have daily changesexactly the same as real market data, but any long term price memory (i.e. past to futureinfluence) is removed.3. Trend measuresBy measuring the length, strength and likeliness of trends in financial data, we can answer thequestion of whether trend following is a valid trading methodology leading to out-sized returns, or justguesswork with any profits being a fluke. Unfortunately, there is no consensus on how to measuretrends and each method has its own weaknesses. In the next chapter we present a few methods ofdetecting trends and show their results on various type of data.3.1 The Hurst exponentThe Hurst exponent is often used as a measure of long term memory (autocorrelation), i.e.whether past data influences future data. It has been used to find trends in financial data in [1],[2] and[3]. We believe it has some weaknesses that disqualify it as a tool to measure market trends. Forexample, let's imagine a security where at the beginning we have a strong up trend, and then a longconsolidation period with prices remaining relatively flat. Chart 1 is an example of such data (a simplemoving average of 200 periods is shown in red):7
Chart 1. Hypothetical market prices with SMAWhen calculating the Hurst exponent, the flat period will bring an end result closer to 0.5 (meaning notrends). However, for a trader using a moving average as a trading signal, the flat period will not meanlosses as no new signal is generated. Whilst the Hurst exponent looks at all data, trend followingsystems can wait out flat periods with either no positions or a position previously established and willnot be negatively affected. Also, it is possible that marke
consequence trend following would show profitability. Our tests confirm that historical prices trend more than random walk data. By detecting this difference, this paper will show that trend following with TA indicators regularly outperforms passive investment strategies and generates out-sized returns. For this research we used historical market data that include stocks, commodities .