Transcription
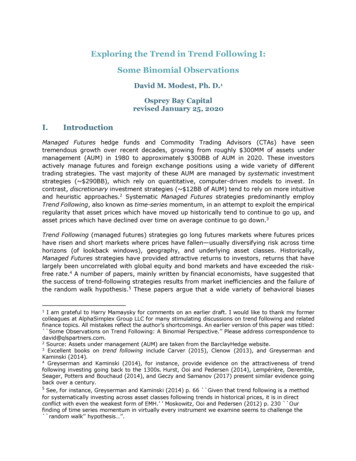
COUNTER-TREND TRADINGWritten by Nick Libertini, AnalystApril 2012The managed futures corner of the alternative investmentspace is one of the first places astute investors turn whenthey are seeking diversification from traditional assetclasses. Spurred by the research of a Harvard professorin the early 1980’s that showed managed futures fundshave low to negative correlations to equities and fixedincome products, hedge funds and institutional investorshave been utilizing managed futures strategies for years1.Traditionally, managed futures strategies have beenassociated with commodity trading advisors (CTAs) usingtrend following systems to trade commodity futurescontracts. However, there is also a niche of managed futuresfunds employing counter-trend trading models to tradea broad range of futures markets. Counter-trend modelsare frequently overlooked due to the counter intuition oftheir trading approach and the lack of widespread researchon their effectiveness. This paper is aimed at explainingthe intuition and mechanics of counter-trend trading,examining the effectiveness of a simple counter-trendmodel, and discussing the future opportunities for countertrend managed futures strategies.Characteristics of Trend and Counter-Trend TradingModelsTrend following is undoubtedly the most common tradingsystem employed by managed futures funds2 . In general, atrend following system aims to invest in the direction of thelong term trend of a commodity, interest rate, exchangerate, or equity index. A trend is considered the dominantdirection of movement for a market over a specifiedtimeframe. Trends can be defined multiple ways, butoften they are described using a price based system suchas a moving average crossover. If a market’s trend is up(market’s price is above its moving average), then a trendfollowing system will be long that market. Conversely, if thetrend is down (price is below its moving average), the trendfollowing system will be short that market. Systematictrading models such as trend following are reactionarysystems, meaning that they do not make explicit forecastsabout future prices and they do not try to call market topsand bottoms. Instead, these models are designed to reactto recent price movements. They generate buy and sellsignals based solely on what is happening in the marketnot what might happen. In this way, reactionary systemscan be related to the ripples formed when a rain drop hitsa puddle. A reactionary system is just trying to react tothe ripples that were formed, not forecast when the nextdrop will hit or how big the next ripples will be. Thesecharacteristics have made systematic trend following aviable and robust strategy over the last several decades,and it is no surprise that a large number of traders havegravitated towards this disciplined approach.However, trend following comes with a distinct statisticalsignature. For the most part, trend following systems tradeinfrequently, they have a low percentage of winning trades(25%-45%), and they have a high winning trade to losingtrade ratio (usually greater than 2)3 . Additionally, trendfollowing systems tend to give back substantial profits atmarket turning points and they are subject to whipsaw indirectionless markets.Counter-trend systems are far less common in managedfutures strategies. Nevertheless, counter-trend modelsoffer a systematic, reactionary framework for trading thatis equally as effective as trend following, but completelyopposite in methodology. Counter-trend systems generallyhave shorter duration trades, a higher percentage ofwinning trades, and a smaller win/loss ratio than their trendfollowing counterparts. A typical counter-trend strategywill trade more frequently than a trend following strategyand produce 55% to 60% winning trades with a winningtrade to losing trade ratio less than 1.54.The majority of counter-trend models are looking to sellshort term overbought levels and buy short term oversoldlevels. These objectives are akin to waiting for a rubberband to become stretched to its limits and then bettingon it snapping back to a more relaxed form. This behaviorallows counter-trend models to thrive in directionless/volatile markets and to react quickly to market turningpoints. The drawback of counter-trend models is that theyoften struggle in steady, trending environments.For example, in September 2010 the U.S. equities marketsbroke out into a steady, 5 month uptrend (see Figure 1A).During this timeframe, the S&P 500 Index consistentlytraded above its 50 day simple moving average (SMA)“The Potential Role of Managed Commodity-Financial Futures Accounts (and/or Funds) in Portfolios of Stocks and Bonds,” Dr. John Lintner.“Frequently Asked Questions About Managed Futures” www.cmegroup.com/education.3“Following the Trend Followers,” Managed Futures Today, May 2010.4“The Trend Isn’t Your Only Friend” Murray A. Ruggiero Jr., Futures Magazine, October 2010.12361 CAPITALCounter-Trend Trading(866) 361-1720Page 1
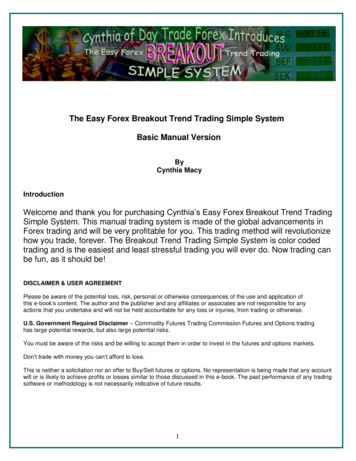
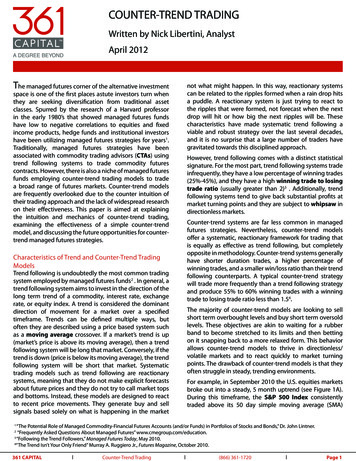
Counter-Trend Tradingwww.361Capital.comFigure 1A: Steady Uptrend for the S&P 500 from 9/1/2010 –2/18/201114001350S&P 500 consistentlytraded above 50 day SMAIndex Level13001250Figure 2A: Steady Uptrend for the S&P 500 from 9/1/2010 –2/18/2011140013501300Index Levelwhile rising 24.32%. This environment was void of any sharpreversals or choppy, sideways price movement, making itan ideal trading opportunity for a trend following system.1250Uptrend transi ons to achoppy, noise rich environment120011501100105010001200115011001050S&P 500 Index100050 Day SMAFigure 2B: Normalized Price Action for the S&P 500 from9/1/2010 – 7/29/20111.50Figure 1B: Normalized Price Action for the S&P 500 from9/1/2010 – 2/16/2011Figures 2A and 2B show how the S&P 500’s trend plateauedstarting in March 2011. For the next 5 months, the S&P 500only gained an additional 1.88% while crossing its 50 daySMA 19 times. This transition from a slow moving uptrendto a choppy market opened the door for counter-trendmodels to capitalize on the Index’s oscillations.Number of Devia ons from SMAHowever, the lack of whipsaw movement in the S&P 500over this time frame was detrimental for short term countertrend systems. Figure 1B depicts the detrended prices ofthe S&P 500 normalized for volatility over this period. Thesetransformations help to visualize the Index’s fluctuationsaround its moving average by removing the distortions ofvolatility and the direction of the underlying trend. Fromthis graph, it is apparent that the Index spent the bulk ofits time trading at 0.50 to 1.00 standard deviations awayfrom its SMA, never once crossing the 0 line. In this steadytrending environment, most counter-trend models wouldeither be inactive or futilely trying to short the market.Number of Devia ons from SMAS&P 500 Index50 Day SMA1.501.000.500.00-0.50-1.00No zero crossing during 5 month uptrendNormalized Price to 50 Day SMA SpreadFor a short term counter-trend system to be successful, itis necessary for prices to oscillate back and forth acrossthe index’s long term trend or some other significantprice anchor. That type of market action indicates thatprice movements contain an adequate amount of noiseand volatility to create profitable counter-trend tradingopportunities. These environments arise when the longterm trend flattens out or changes direction.361 CAPITALCounter-Trend TradingZero crossings increasefrom 0 to 191.000.500.00-0.50-1.00Normalized Price to 50 Day SMA SpreadFinally, the short-term nature of counter-trend models andtheir contrarian objective gives them low correlation toother managed futures strategies, as well as low correlationto markets they are traded on. Low correlation is achievedby taking many short duration trades, both long andshort, in the underlying market. When aggregated, thedirectionality of these positions nets out, yielding a returnseries that has low correlation to the underlying asset. Onthe other hand, longer term trend following models havepotential to become highly correlated with the marketsthey are traded on due to the longer length of their trades.A typical trend following model may hold a position for afew months up to several years. If the trend is up, then themodel will be perfectly correlated with the market over thistimeframe. Conversely, if the trend is down, the model willbe perfectly inversely correlated with the market over thistimeframe. This is one of the reasons that most managedfutures funds trade a basket of commodity futures, because(866) 361-1720Page 2
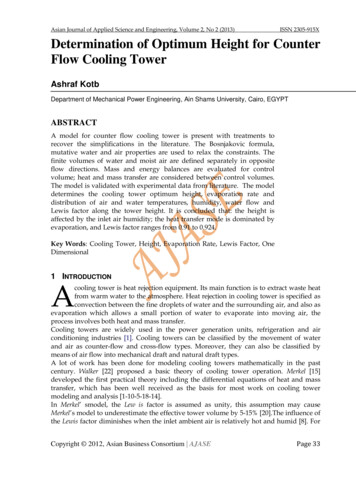
Counter-Trend Tradingwww.361Capital.comcommodities are usually uncorrelated to equity and fixedincome markets.Does Counter-Trend Trading Work?Over the past decade, Larry Connors and his researchteam at The Connors Group have published several studieshighlighting the effectiveness of short-term, counter-trendstrategies. The example below is an extrapolation of someof Mr. Connor’s research.From January 1, 1990 to December 31, 2011 the S&P 500returned 468.10%. Certainly, the market experienced someravishing declines over that period, but if you managedto stay invested you received an annual rate of return of8.21%5. Bearing in mind the market’s upward bias over thisperiod, was it better to buy short term strength and sellshort term weakness, or did buying weakness and sellingstrength (trading counter-trend) outperform over the lasttwo decades? Intuition would suggest that buying shortterm strength and selling short term weakness (tradingmomentum) was more profitable; the trend is your friendright?To gauge the efficacy of buying short term strength andselling short term weakness, the S&P 500 was evaluatedfrom the beginning of 1990 to the end of 2011 using a simplemomentum model and a simple counter-trend model.10 day highs and 10 days lows were used to encapsulateshort term strength and weakness. If the S&P 500 made anew 10 day high, the momentum model went LONG onthe close and held the position until the next trading day’sclose, trying to profit from the upward momentum of themarket. Conversely, if the S&P 500 made a new 10 day low,the momentum model went SHORT on the close and heldthe position until the next trading day’s close, trying tocapitalize on the downward momentum of the market. Thecounter-trend model was exactly inverse the momentummodel, going short on new 10 day highs and going long onnew 10 day lows. The two models were also evaluated with3 day, 5 day, and 10 day holding periods. Table 1 summarizesthe results.5Table 1: Short Term Momentum Model v. Short Term CounterTrend Model on the S&P 500 from 1/1/1990 to 12/31/2011S&P 500 Index# Trading DaysPrice Apprecia onTotal Return5547255.86%468.10%MomentumHolding Period# Trades% WinningTotal ReturnAvg. Trade ReturnStd. Devia ont-Statp-Value1 TendHolding Period# Trades% WinningTotal ReturnAvg. Trade ReturnStd. Devia ont-Statp-Value1 Day3 Day5 Day10 Day201566851641054.04% 64.97% 63.18% 68.05%442.84% 408.23% 366.69% 13.052.632.1299.97% 99.88% 99.57% 98.28%3 Day66833.98%-88.48%-0.30%2.29%-3.3699.96%5 Day51635.66%-88.95%-0.38%2.97%-2.9399.82%10 Day41031.22%-86.77%-0.43%3.66%-2.4199.18%The results in Table 1 clearly show that trading countertrend to the S&P 500’s short-term market extremesoutperformed the simple momentum model. Furthermore,this simple counter-trend strategy performed in line withthe total return of the S&P 500 Index (442.84% v. 468.10%)even though it was only invested 36% of the time (2015one day trades v. 5547 trading days). Additionally, all fourof the counter-trend’s holding periods produced positiveaverage trade returns that were statistically significant at a98% confidence level.To further explore the robustness of this simple countertrend approach, new market highs and lows were measuredusing a range of periods (see Figure 3). Over all of theseperiods, the counter-trend model produced a positiveaverage trade return, and this return was consistentlyabove 0.07% for periods between 9 and 15 days. This levelof consistency across different time periods and differentholding periods, as well as the statistical significance of thepositive trade returns is substantial proof that short termcounter-trend trading has worked on the S&P 500 Index.45% of the S&P 500 total return from 1/1/1990 to 12/31/2011 was attributable to dividends.361 CAPITALCounter-Trend Trading(866) 361-1720Page 3
Counter-Trend %0.03%0.02%0.01%0.00%567891011121314Total ReturnAvgerage Trade ReturnFigure 3: Performance of Counter-Trend Model with 1 DayHolding Period over Different Rolling High/Low Periods15Rolling High/Low Period (Trading Days)Average Trade ReturnTotal ReturnSo trading counter-trend over the short run has worked onthe S&P 500, but what about other markets? Table 2 belowsummarizes the annual returns of applying the simple, oneday holding period counter-trend strategy to the NASDAQ100, Russell 2000, Nikkei 225, and the Euro Stoxx 50indices over the same timeframe6.Table 2: Annual Performance Summary of 10 Day CounterTrend Model with 1 Day Holding Period from 1/1/1990 200920102011Sta s cs# Trades% WinningTotal ReturnAvg. Trade ReturnStd. Devia ont-Statp-ValueCorrela on to IndexS&P 8.24%-23.52%-41.16%-29.24%4.83%-15.24%S&P ounter-TrendS&P 67%57.06%37.56%-5.66%15.97%S&P 8.12%57.38%0.04%1.86%0.9582.97%16.54
counter-trend trading has worked on the S&P 500 Index. Over the past decade, Larry Connors and his research team at The Connors Group have published several studies highlighting the effectiveness of short-term, counter-trend