Transcription
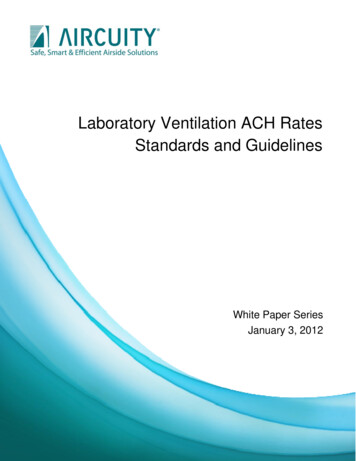
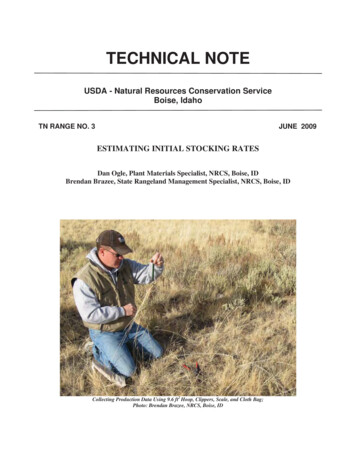
TECHNICAL NOTEUSDA - Natural Resources Conservation ServiceBoise, IdahoTN RANGE NO. 3JUNE 2009ESTIMATING INITIAL STOCKING RATESDan Ogle, Plant Materials Specialist, NRCS, Boise, IDBrendan Brazee, State Rangeland Management Specialist, NRCS, Boise, IDCollecting Production Data Using 9.6 ft2 Hoop, Clippers, Scale, and Cloth Bag;Photo: Brendan Brazee, NRCS, Boise, ID
2
ESTIMATING INITIAL STOCKING RATESDan Ogle, Plant Materials Specialist, NRCS, Boise, IDBrendan Brazee, State Rangeland Management Specialist, NRCS, Boise, IDStocking rate, defined as, the number of animals allotted to an area for a given length of time is oneof the most important grazing management tools a rancher or land manager can manipulate,regardless of the grazing system, vegetation type or kind and class of livestock. Stocking rate hasthe largest impact on animal performance and the health of the forage resource of all of themanagement tools available, because it directly influences:xxxxxxAnimal productivityForage productionForage qualitySpecies composition over the long termPlant physiologyProfitability of the operationEstablishing a proper stocking rate is critical to maintaining animal performance and optimizingforage performance while also sustaining the health of the land resource over the long term. Factorsthat affect stocking rate include the animal species, class of livestock (dry cow, lactating cow, bull,steer, etc.), acres available for grazing, rainfall, topography, water distribution, forage species,forage productivity including regrowth characteristics, and facilitating practices such as grazingsystem, irrigation and fertility program. Effective managers will balance animal performance andforage production over the long term. With this in mind, setting the appropriate initial stocking rateconsists of determining (1) how much forage is required by the type and class of animals raised(forage demand); (2) how much forage is produced during the year and how much is available forlivestock consumption (available forage); and (3) how long will animals be using the area (durationof grazing).FORAGE DEMANDThe basis for measuring forage demand is the animal unit (AU), which is defined as the amount offorage required to maintain a 1000-pound cow with calf. Studies have established that an AUrequires on average 3.0 percent of the body weight in air dry forage daily (30 pounds per day for a1000-pound cow). An animal unit month (AUM) is the average amount of dry weight foragerequired by a lactating 1000-pound cow and her calf for one month (30.4 days), or 912.5 pounds.Not all kinds of livestock or wildlife have the same forage demand as a 1000-pound lactating cow.In addition, forage demand varies within a species depending on its class, i.e., its growth rate (e.g.heifers and steers vs. mature cow), lactation and maintenance (e.g., dry cow vs. cow with calf). Forthis reason, animal unit equivalents (AUE) have been developed to assist with the approximatedetermination of forage demand based on the kind, class and size of animal (see Table 1).3
TABLE 1Animal Unit Equivalents (AUEs)Domestic Animal Kind-ClassCow – dryCow with calfBull – matureCalf – weanedSteer/Heifer - 2 YearsSheep – mature ewe or ramSheep – yearlingGoatHorse – matureAUE1.001.001.250.600.800.200.150.171.25- 2.00Wildlife Animal Kind-ClassAntelopeBisonDeer – whitetailDeer – muleElkGoat – mountainMooseSheep – bighorn (ewe)Sheep – bighorn (ram)AUE0.101.000.130.170.480.140.830.140.18For cow herds with animals having a different average weight than the 1000 pound average usedabove, AUE can be adjusted (i.e., every 100 pounds of animal weight equates to about 0.10Animals Units thus a 1200-pound cow with a calf would be 1.2 AUE or a 1600 pound bull wouldbe 1.6 AUE).Example: A land manager needs to determine how much pasture he will need to acquire prior toimplementing a brush management project which will require him to defer grazing from June 1stthrough October 30th this year. The herd consists of 300 pair of 1100 lbs Angus cross cattle with 15Angus bulls during July and August.Calculation: #Head x AUE x Time in months AUM’s300 Cow/calf pairs x 1.1 AUE x 5 months 1650 AUM’s15 Bulls x 1.25 AUE x 2 months 38 AUM’sThe manager will need to find a forage supply that will provide approximately 1700 AUM’s for thedeferment period.FORAGE PRODUCTIONThe next step in estimating initial stocking rate is to determine the amount of forage beingproduced. The local climate (temperature and precipitation), soil (texture – depth – fertility) andcurrent vegetation management largely affect total forage production for an area. Total productionof forage can be estimated by using simple clipping procedures and converting the green weightestimates to present reconstructed weights. You will need a frame of a known area (Table 2),clippers, paper bags and a scale that measures in grams. Additional information will be needed forreconstruction including degree of use, knowledge of growth curves, and familiarity with typical or“normal” growing season climate variables.Detailed information on how to collect plant production data can be found in the National Rangeand Pasture Handbook, Chapter 4 ( ns/nrph.html )and the Monitoring Manual for Grassland, Shrubland, and Savanna Ecosystems, Volume IIChapter 9 (http://usda-ars.nmsu.edu/JER/Monit Assess/monitoring main.php )4
TABLE 2Range Hoop and Square SubplotDimensions and Conversion Factors9.60 ft2Radius 1.75 feetHoop Circumference 10.996 feetSquare Plot Dimensions 3.098 X 3.098 ftConversion Factor Grams X 10 lbs/ac Grams X 11.21 kg/ha24.80 ftRadius 1.24 feetHoop Circumference 7.77 feetSquare Plot Dimensions 2.19 X 2.19 ftConversion Factor Grams X 20 lbs/ac Grams X 22.42 kg/ha22.40 ftRadius 0.87 feetHoop Circumference 5.498 feetSquare Plot Dimensions 1.55 X 1.55 ftConversion Factor Grams X 40 lbs/ac Grams X 44.85 kg/ha1.0 m2Radius 0.564 meterHoop Circumference 3.545 metersSquare Plot Dimensions 1.0 X 1.0 meterConversion Factor Grams X 10 kg/ha Grams X 8.93 lbs/ac20.50 mRadius 0.399 meterHoop Circumference 2.51 metersSquare Plot Dimensions 0.5 X 1.0 meterConversion Factor Grams X 20 kg/ha Grams X 17.86 lbs/ac20.25 mRadius 0.282 meterHoop Circumference 1.77 metersSquare Plot Dimensions 0.5 X 0.5 meterConversion Factor Grams X 40 kg/ha Grams X 35.71 lbs/acThe size of subplot to use depends on the nature of the area being sampled. Forage productionvaries between and within pastures and rangeland areas, so efforts to estimate total productionshould attempt to represent this variation as much as possible. Sites such as pastures that areuniformly vegetated with few species and consistent cover can be adequately sampled with smallersubplots (e.g., 2.4- 4.8 ft2). Rangeland ecological sites that have many species and/or are sparselyvegetated require larger subplots (example 9.6 ft2) to capture and reflect variation in site. It isrecommended to sample at least 10 subplots. Collecting data for additional subplots can alsoincrease the accuracy of the estimates.Collecting Yield Data at Coffee Point Test Site –North of Aberdeen, Idaho;Photo: Loren St. John, NRCS, Aberdeen, ID5
DATA COLLECTION FOR ESTIMATING FORAGE PRODUCTIONStep 1: Determine Sample AreaThe area to be sampled should be representative of the grazing unit. The subplots should be locatedwith in the same Ecological Site on rangeland or in areas of similar growth and productionpotential within pasture systems.Step 2: Determine Correction Factor for Clipped/Estimated green weightsSelect at least two of the ten subplots to collect clipped data. These subplots should contain amajority of the species found in the sampling area. The clipped weight for each species is thendivided by the estimated weight for the clipped subplots. The resulting factor is used to adjustgreen weight estimates based upon actual weights.For example, the data collector clipped Idaho fescue in subplots 3 and 7 estimating 15 grams greenweight. The clipped weight for the two plots was 17 grams. The correction factor can be multipliedby the average green weight of the ten subplots to determine the corrected green weight.17gram/13 grams 1.13, 1.13 x 124 lbs/ac 140.5 lbs/ac corrected green weight.See ID-CPA-006 in Appendix C.Step 3: Determine Percent Dry WeightThe corrected green weight can be converted to dry weights using estimated dry matter ranges fromTable 3 Green Weight to Dry Weight Conversion. Appendix A - Dry Weight Percent of SelectedGrasses, Grasslikes, Forbs, Shrubs, and Trees for Idaho provides a more accurate conversion formost common range species.TABLE 3Green Weight to Dry Weight ConversionsNative Range (Green Wt x Percent Air Dry ghSeed-RipeDrying% DryMatter25-35%35-45%45-55%55-60%60-70%70-95%% yingDeciduousShrubsNew FoliageMature FoliageEvergreenShrubsNew FoliageMature FoliageSeeded Pasture (Green Wt x Percent Air Dry ghSeed RipeDrying% d RipeDrying6% DryMatter15-25%25-35%35-45%45-55%55-65%65-95%% DryMatter25-40%40-55%% DryMatter35-55%55-70%
Step 4: Determine Percent Growth UngrazedThis is the average percent ungrazed by species for the sample area. For example if a speciesaverages 40% utilization then record 60% for percent growth ungrazed.Step 5: Determine Percent Growth Curve CompleteThis is the cumulative proportion of growth completed for the current year. The growth adjustmentcorrects for how much the plant has grown for the year compared against the potential for the yearor 100%. Climatic variations are not considered in this step.Step 6: Determine Percent Normal ProductionThis is the effect of growing conditions on individual species. Precipitation timing and amount,temperature, and their relations may have an impact on species production. A value of 100% wouldbe considered normal production.Step 7: Determine Reconstruction FactorThe reconstruction factor coverts the corrected green weight of sampled vegetation intoreconstructed present weight based upon steps 3- 6. This number represents the total expectedproduction for the sample area at the end of the current growing season. The following formula isused, for further example see ID-CPA-006 in Appendix C.% Dry weight(% Current Growth Ungrazed)(% Growth Curve Complete)(% Normal Production) Reconstruction Factor x Corrected Green Weight Reconstructed Present WeightADJUSTMENTS TO FORAGE PRODUCTION FOR ESTIMATING STOCKING RATEWhen estimating stocking rates it is a good idea to evaluate availability of forage for livestockbased upon topography, distance to water, and type or class of livestock in the operation.Adjustment to the total production for these variables can have a significant effect on stocking rateand can identify opportunities for installation of facilitating practices such as stockwater pipelinesand troughs. The total production of a grazing unit can be adjusted based on distance from waterand percent slope. Table 4 shows the general guidelines for determining the amount of adjustment.Local knowledge should be used when available to assess if adjustments are reasonable. Anexample of how percent slope and distance to water can effect estimated stocking rate seeID-CPA-008 in Appendix C.Table 4Distance to Water and Percent Slope Adjustment Factors for Rangeland.For further guidance see Chapter 5 NRPHDistance to Water in feet26405280792010560Percent Slope0-1515-3031-60 60Percent Adjustment100%90%70%50%7Percent Adjustment100%70%40%0%
Utilization and Harvest EfficiencyPlants have a tolerance to grazing, but if herbage removal exceeds a critical point, most plants willlose vigor, produce less and if excessive removal continues, the plants will eventually die. Properutilization is the approximate point of forage harvest that will not lead to range or pasturedeterioration or decreased animal performance. The key to proper utilization is to leave sufficientleaf area to allow the plant to restore depleted energy reserves in response to grazing and thusmaintain desirable productivity and composition.A common starting point or rule for planning an appropriate level of utilization is “take half andleave half” or 50 percent utilization of annual forage production. This utilization includes forageactually consumed by the animal, but also damage to plants caused by trampling, loafing and othernon-livestock factors such as loss to insects or utilization by wildlife. Some estimate as much as25% of total annual production is lost to livestock damage and other competitive uses under lowstocking density continuous grazing program. This can be referred to as harvest efficiency which isdefined as the percentage of total annual standing forage that is consumed by the grazing animal.Harvest efficiency should not be confused with grazing efficiency which refers to the percentage ofallowable standing forage consumed and results in higher percentages. Harvest efficiencies above35% have a negative impact on animal performance. Table 5 provides guidance on determiningharvest efficiency based upon type of grazing system and management level used for the operation.An example of how Harvest Efficiency and the rule of thumb “Take Half, Leave Half “ are related.(1000 lbs/ac x 50% Use) – (1000 lbs/ac x 25% loss due to trampling, fouling, insects, etc.) 500 lbs/ac – 250lbs/ac 250 lbs/ac of available forage.To simplify the equation use 1000 lbs/ac x 25% Harvest Efficiency 250 lbs/ac available forage.Table 5 – Harvest EfficiencyGrazing Management LevelContinuous, Season LongHarvest Efficiency25%Deferred Rotation, 2 Pastures25-30%Rest Rotation, Multiple Pastures25-30%Short Duration , High Intensity30-35%Animal Performance ConsiderationsAt low stocking rates, individual animal performance is maximized because animals are free toselect high quality forage. Consequently, with low grazing pressure, palatable plant species inunder-stocked pastures are at risk of over-utilization, because animals have unrestricted choice andwill repeatedly consume the preferred species first (thus the same preferred plants will be grazedover and over again). Furthermore, total animal production per unit area will be low because offewer animals in the pasture.As stocking rate increases to a moderate level, individual performance declines. This is because theaverage forage quality consumed per animal is reduced as a direct result of the increase in animalsper unit area. However, total animal production per unit area increases as more animals are carried8
per acre. Under normal conditions, a moderate stocking rate will not adversely impact the forageresource.At high stocking rates, total animal production per area declines as a result of poor individualanimal performance. Individual animal performance is poor because each animal in the herd mustcompete for limited and rapidly diminishing supply of quality forage. As the forage resourcesdiminish, the available nutrients for each animal declines and animals nutrient demand may not bemet. Without consideration of other management options such as rapid rotation into ungrazed fieldsor pastures that have been grazed and have regrown, a reduction in the most palatable species willoccur, weedy or undesirable species will increase and a decline in carrying capacity will eventuallyoccur.ADJUSTMENTS WITH MANAGEMENTIt is the three components of stocking rate – animal numbers, grazing area and grazing period, thatmanagers have the most influence over when making grazing management decisions. A managercan adjust the number of animals, alter pasture size or manipulate the amount of time an area isgrazed or the amount of time an area is rested.The decision to manipulate one or more of the components should be guided by animal and pasturemanagement objectives and economic considerations. Decisions to change animal numbers aremost feasible when the area is either under-stocked or over-stocked (i.e., drought could require ornecessitate a temporary reduction in herd size to minimize the impact on the reduced forage base).As herd size is changed, the grazing period must be adjusted accordingly to maintain the desiredstocking rate.Adjusting pasture size is not always economically feasible. However, there may be situations whenaltering pasture configuration or subdividing a single large pasture into smaller units, will improvegrazing distribution and animal performance. Several factors should be considered when adjustingpasture size. Decreasing pasture size will require smaller herd numbers or a shorter grazing period.Shorter grazing periods require more intensive management because the margin for error on thetime animals are in pasture is increased. Second, increasing pasture size without increasing animalnumbers will result in reduced grazing distribution even if the grazing period is increased. Unevengrazing distribution in large pastures leads to patchy grazing with a mixture of under- and overutilized areas. Eventually over-utilized areas lose desirable plants, productivity and support feweranimals.The easiest, most flexible and economically feasible component of stocking rate to manipulate isthe grazing period. By managing the amount of time a pasture is grazed, a manager can easily andquickly compensate for situations of over-stocking that arise from time to time. For example, shortterm drought will cause pasture production to be reduced. Decreasing the grazing period for eachgrazing unit can temporarily prevent over-grazing without reducing animal numbers.9
PLANNING GRAZING PERIODOnce the estimated carrying capacity has been determined for the ranch, the amount of time agroup of animals spends in each pasture should be determined to complete the process of settingthe initial stocking rate. The amount of time spent by livestock in each pasture depends largely onthe grazing area itself, the type of operation and the management goals of the operation.Stocking rates are commonly expressed as the number of animal units (AU) per unit time per unitarea (usually an acre). Operations that use large pastures or grazing units typically base stockingrates on months to be most useful. For example each pasture’s stocking rate may be expressed asanimal unit months per acre (AUMs/Acre) or acres per animal unit month (Acres/AUM). Whereas,operations that use smaller pastures may find the numbers of days (D) a pasture can support aparticular number of animals (AUDs/Acre) to be more useful.The carrying capacity of a unit of land is commonly expressed in animal unit months (AUMs). AnAUM is the measure of the forage supply within the management unit, based on the amountrequired to support an animal unit (AU) for one month. The value of determining the carryingcapacity for the ranch, pasture or management unit is that it connects forage supply with forageconsumption and is thus the absolute foundation to proper grazing management.10
REFERENCESHerrick, J.E et all. 2005 Monitoring Manual for Grassland, Shrubland, and Savanna EcosystemsVolumes I and II. USDA-ARS Jornada Experimental Range Las Cruces, NMJensen, Kevin, Howard Horton, Ron Reed and Ralph Whitesides. 2001. Intermountain PlantingGuide. USDA, ARS and Utah State University. Pages 58- 59.Ogle, D., L. St. John, M. Stannard, and L. Holzworth. 2008. Grass, Grass-Like, Forb, Legume andWoody Species for the Intermountain West. Natural Resources Conservation Service. Boise, Idaho.Idaho Plant Materials Technical Note No. 24. 43p.Ogle, D., L. St. John, J. Cornwell, M. Stannard, L. Holzworth. 2008. Pasture and Range nt. Natural Resources Conservat
The basis for measuring forage demand is the animal unit (AU), which is defined as the amount of forage required to maintain a 1000-pound cow with calf. Studies have established that an AU requires on average 3.0 percent of the body weight in air d