Transcription
Public Disclosure closure AuthorizedBank Public January EditionPublic Disclosure AuthorizedSOUTH AFRICA ECONOMIC UPDATEPublic Disclosure Authorized
2019 The International Bank for Reconstruction and Development/THE WORLD BANK1818 H Street NWWashington, DC 20433USAAll rights reservedPhotos: Shutterstock, Pexels, Unsplash, University of Pretoria and World Bank
CONTENTSAcknowledgmentsForewordiiiivAbbreviations vExecutive SummaryviCHAPTER 1CHAPTER 2Recent Economic Developments1Global Economic DevelopmentsTertiary Education Enrollments Must Rise2The Promise of Encouraging PSET EnrollmentsReal Sector Developments in South Africa5Labor Market Developments in South Africathrough Financial Support to Students16Tertiary Education21Inflation and Monetary Policy in South AfricaThe Outlook for South AfricaConclusion58References59Annex. PSET Statistics34The Fiscal and Quality Challenges of Expanding17Fiscal Developments in South AfricaThe External Sector in South Africa3038The Short-term Outlook for the PSET System2339Improving Comprehensively the PSET System over2743the Long Term61FIGURESFigure 1.1: Global activity indicators23Figure 1.2: Portfolio flows and commodity prices5Figure 1.3: Confidence indicators and growth estimatesFigure 1.4: Infrastructure quality 2008-2009 vs. 2017-2018Figure 1.5: Contributions to GDP (supply side)1012Figure 1.6: Industry production and Purchasing Managers’ Index (PMI)Figure 1.7: Contributions to GDP (demand side)131415Figure 1.8: Oil prices and estimated impact on household consumptionFigure 1.9: Contributions to gross fixed capital formationFigure 1.10: Exports and imports of goods and servicesFigure 1.11: Unemployment by education level151617Figure 1.12: Fiscal consolidation objectives, 2016-1820Contents South Africa Economic Update 12 i
21Figure 1.13: Actual and forward inflation expectations26Figure 1.14: South African exports and importsFigure 1.15: South African Reserve Bank cyclical indicatorsFigure 1.16: GDP growth projections2727Figure 2.1: University access and wage inequality, 2006-1531Figure 2.2: University enrollment rate in South Africa and selected countries, 2015Figure 2.3: Enrollments in public TVET colleges and universities, 2015Figure 2.4: Poverty and tertiary education, 2006-15Figure 2.5: University access by decile32333435Figure 2.6: Private rates of return from subsidized education3756Figure 2.7: NSFAS loan recoveries (1997-2014)TABLES29Table 1.1:Baseline annual growth forecastsTable 2.1:Private rates of return from PSET 36Table 2.2: Public rates of return from PSET 38Table 2.3: The estimated fiscal cost of the new financial aid scheme 41Table 2.4: The estimated impact of various PSET policy interventions on equity and growth 42Table 2.5: Planned evolution of the PSET system by main segment (2015-2030) 43Table 2.6: Private enrollment as a share of total PSET enrollments 46Table 2.7: Types of private tertiary education institutions 46Table 2.8: Enrollment rates by income quintile in four Latin American countries 55BOXESBox 1.1:What is the state of human capital in South Africa? 6Box 1.2:Presidential jobs summit and investment conference 8Box 1.3:Reform of the mining sector 9Box 1.4:Treating customers fairly in relation to transactional accounts and fixed deposits 13Box 1.5:When the cycle becomes the trend: the impact of the commodity super cycle on South Africa 18Box 1.6:Credible monetary policy cushions the impact of exchange rate volatility on inflation 22Box 1.7:South Africa’s vulnerability and resilience in emerging market storms 24Box 2.1:Licensing and accrediting PSET institutions 48Box 2.2:Lessons from co-operative programs 49Box 2.3:Acquiring skills to become a chef 50Box 2.4:Lessons from fundraising efforts in Europe 54Box 2.5:Income-contingent loans in Australia and New Zealand 57ii South Africa Economic Update 12 Contents
ACKNOWLEDGEMENTSThe 12th South Africa Economic Update was produced by a World Bank team comprisingMarek Hanusch, Victor Sulla, Precious Zikhali, Vincent Dadam, Nomsa Mkhize, KobinaDaniel, Rudibert Steinbach, Alain Ntumba Kabundi, Ayanda Mokgolo, Yoko Nagashima,Jamil Salmi, Servaas van der Berg, Reynold Duncan, Phemelo Kekana, Paolo Belli, Gert vanLinde and Zandile Ratshitanga, led by Sébastien Dessus. It was internally peer reviewed byRoberta Bassett and Jacques Morisset. It benefited from comments and inputs from JohnKrueger (Department of Planning, Monitoring and Evaluation), Sacha Backes, AlejandroCaballero, Rajeev Gopal and Ken Osei (International Finance Corporation), AlejandroSimone (International Monetary Fund) and overall guidance from Mathew Verghis (PracticeManager, Macroeconomics, Trade and Investment) and Paul Noumba Um (Country Directorfor South Africa).The report was edited by Sharon Chetty and designed by Cybil Maradza.Acknowledgements South Africa Economic Update 12 iii
FOREWORDI am pleased to launch this 12th South Africa Economic Update, which offers a review of the country’s recenteconomic and social developments and its outlook in the context of global economic prospects.In the second half of 2018, the World Bank released two important global reports on the changing nature of work,and on a new measure of countries’ human capital – the Human Capital Index (HCI). Both reports underlinedthe criticality and urgency for societies to equip their population, and their youth in particular, with a new setof high-order cognitive and non-cognitive skills that are needed to prosper in a world that is constantly beingreshaped by technological progress.These global recommendations surely apply to South Africa, which ranks 126th on the HCI out of the 157 countriesfor which data exist – highlighting the human capital crisis that the World Bank President Kim urged globalcitizens to tackle at the Johannesburg Festival in December. They strongly echo the main conclusion of the WorldBank Systematic Country Diagnostic of South Africa also conducted in 2018: the insufficiency of skills is the keyconstraint to reducing poverty and inequality, and eventually overcoming a legacy of exclusion.Authorities are cognizant of the challenge, and have, among other things, decided to accelerate the expansionof the Post School Education and Training (PSET) sector – university and Technical and Vocational Education andTraining (TVET) – through devoting more budgetary resource to it (an additional 1.1% of GDP). Nevertheless, SouthAfrica’s tight fiscal situation means the right balance has to be found between supply (expanding PSET admissioncapacity) and demand (encouraging students to enroll with financial support) interventions, to protect fiscaland debt sustainability without compromising education quality. In this regard, this Update discusses optionssuccessfully tested internationally to sustainably increase PSET enrollments through (i) diversifying the PSETsector from a mostly government funded-university centric model; (ii) encouraging private sector participation;(iii) strengthening quality assurance mechanisms; (iv) improving resource mobilization; and (v) ensuring greaterequity in supporting students. It argues that South Africa could reduce inequality faster by rebalancing budgetaryresources towards interventions that improve the quality of education, notably in TVET and community colleges,and expand PSET admission capacity. This would be made fiscally possible by limiting financial aid to pooreststudents while extending income-contingent loans to more affluent students.This Update builds on our solid partnerships with the National Treasury, the Department of Planning, Monitoringand Evaluation, the Department of Higher Education and Training, and various public and private PSET institutions.As the World Bank, we stand ready to work with all stakeholders and support South Africa to fulfill its developmentagenda and contribute to ending extreme poverty and promoting shared prosperity. It is our hope that the countrywill continue to use the World Bank’s knowledge, global experience, and convening power as a platform for peerto-peer learning to identify evidenced-based, pragmatic solutions that contribute to the National DevelopmentPlan’s goals of eradicating poverty and reducing inequality.Paul Noumba UmWorld Bank Country Director for South Africaiv South Africa Economic Update 12 Foreword
ABBREVIATIONSBBBEEBroad-based black economic empowermentPMIDHETDepartment of Higher Education & TrainingPSETEMDEsEmerging markets & developing economiesRPurchasing Managers’ IndexPost-school education and trainingSouth African randERPTExchange rate pass-throughSACUSouthern African Customs UnionEWCExpropriation without compensationSARBSouth African Reserve BankGDPGross domestic productSETASector education and training authorityHuman Capital IndexSMESmall and medium-sized enterpriseMassive Open Online CourseSOEState-owned enterpriseHCIMOOCMTBPSMedium Term Budget Policy StatementNEETNot in employment, education or trainingNIDSNational Income Dynamics StudyNSFASOECDNational Student Financial Aid SchemeOrganization for Economic Co-operationand DevelopmentStatsSATVETUNISAUS WDRStatistics South AfricaTechnical and vocational education & trainingUniversity of South AfricaUnited States dollarWorld Development ReportAbbreviations South Africa Economic Update 12 v
EXECUTIVESUMMARYvi South Africa Economic Update 12 Executive Summary
South Africa’s much anticipated economic reboundin 2018 did not occur. While substantial efforts bythe authorities to strengthen governance of publicresources and stabilize the fiscal situation helped theeconomy to not contract further, economic growthremained tepid with a technical recession (twosuccessive quarters of negative economic growth) inthe first half of 2018. GDP growth is expected at below1% in 2018, down from an already low 1.3% in 2017.A number of exogenous factors contributed to this poorgrowth performance. Domestically, climate variationssuch as a prolonged drought in the Western Capewhere harvests were delayed exerted a huge toll onagricultural production. Externally, mounting tradetensions between the United States and China, andtightening global financial conditions contributed toslowing the pace of foreign financial inflows to SouthAfrica while lessening the demand for its exports.Rising world oil prices also exerted strong pressureon the balance of payments and domestic prices,depressing private consumption.These negative developments, however, do notconceal the fact that South Africa’s growth challengeis deep-seated and largely structural. To grow fasterand sustainably, the economy will need to be moreinclusive, requiring the participation of a greatershare of the population mainly through job creation.Furthermore, persistent inequality of income andof opportunity will continue to raise pressures forredistribution of limited resources that are drawn froma small tax base. Radical policy demands are morelikely in a stagnant economy, fuel policy uncertaintyand deter private investment. At the Presidential JobsSummit and the South African Investment Conferenceheld in October 2018 agreements were made onactions that are expected to enable job creation andto attract higher levels of investment, including interalia, education and skills interventions, and initiativesto reduce policy uncertainty on land reform, miningand black economic empowerment.The financing of structural reforms and projects topromote greater economic and social inclusion isnonetheless rendered difficult by South Africa’s tightfiscal and debt situation, itself mainly the consequenceof slow growth and strong spending pressures. Asin most previous budget speeches, the commitmentto public debt stabilization was reaffirmed in theOctober 2018 Medium Term Budget Policy Statement(MTBPS), but the target date for debt stabilizationwas shifted yet again, this time to 2023/24, and at ahigher level, to 59.6% of GDP against 56.1% in the 2018Budget Review. Though in a significant departure fromprevious statements, there was clear recognition of thegreater role the private sector, development financeinstitutions, and multilateral development bankscould play in complementing scarce public financesfor infrastructure. Regulatory reforms, loweringthe risk of financial instruments to facilitate privatesector investment, and a clearer delineation betweencommercially viable and socially desirable interventionswere identified as instrumental to breaking a viciouscycle of low inclusiveness coupled with limited publicresources to speedily address the challenge.The policy agenda of expanding the Post SchoolEducation and Training (PSET) sector clearly illustratesthe trade-off between maintaining fiscal restraint andaddressing key structural constraints that may be costlyto the fiscus. In South Africa, acquiring skills throughPSET is the best guarantee of escaping poverty. Indeed,income inequality continues to be mostly driven bylabor market developments that demand the skills thatSouth Africa’s poor currently lack. Notwithstanding thelonger-term need to fundamentally improve the basiceducation system, rapidly enrolling more students inuniversity and Technical and Vocational Education andTraining (TVET) institutions has become a major politicalExecutive Summary South Africa Economic Update 12 vii
imperative in the face of the growing frustration amongyouth unable to access economic opportunities. Yet,the decision announced in December 2017 entitling allstudents from poor and working-class families to freehigher education may actually aggravate frustrationand discontent among youth and may not necessarilysupply more skills to the economy.Quantitative analysis in this Update based onadministrative and household survey data suggeststhat the financial cost of studies can be a majorbarrier to enrolling poor students in PSET institutions.This barrier was only partially lowered through theextension of loans from the National Student FinancialAid Scheme (NSFAS) to the poorest students, as thefinancial assistance covered only part of the costs ofstudying, leaving the risk of not reaping the benefitof studying, whether they drop out, fail to graduateor remain unemployed after graduation, entirely tothe students. But it also suggests that the quality ofeducation, in TVET notably, is very poor and is notmeeting labor markets’ demand – making privatereturns from TVET very low, likely discouragingenrollments. The low take-up rate of 40% of NSFASloans, and the high rate of default on these loansreflect such shortcomings.Converting loans to grants and covering the entirefinancial cost of studying beyond tuition fees (e.g.accommodation, transport and books) will encouragemany academically eligible poor students to enroll inPSET while receiving financial aid. And extending thisopportunity to students from working-class familieswould multiply demand for education several times.Indeed, the threshold for financial eligibility under thenew policy – parental income of less than R 350,000per year – entitles more than 9 out of 10 prospectivestudents to receive support.However, implementing this policy would have asubstantial impact on the budget. Projections undertakenin this Update suggest that public resources allocated toPSET would need to increase from 1.4% to 2.5% of GDP in4 years, to finance increased student aid, while keepingtotal enrollments, and expenditure per student (thusthe low quality of education at TVET) unchanged. A 10%increase in PSET enrollments (i. e. an additional 45,000first time students) under the new aid scheme would costan additional 0.15 percentage points of GDP.While the scheme would lead to a slightly higher proportionof students from poor and working-class families beingenrolled, its very high cost would likely make the target ofdoubling enrollments in PSET by 2030 elusive. This wouldinevitably create frustration among youth who would bebarred from entering PSET institutions even though theywould be academically eligible and qualify for financialsupport. Employers would not be able to find the skillsthey need to stay competitive; and the government andSmall and Medium-sized Enterprises (SMEs) would be ata particular disadvantage as they are less able to attractskilled workers compared to larger private companies.International experience offers some options for SouthAfrica to solve the trade-off between supporting morestudents and encouraging higher enrollment. Thisincludes diversifying PSET from the publicly-fundedcontact university-centric model towards:A PSET sector more centered around technical, vocational and lifelong training.Expected matric results of school students is such that demand for PSET education in the next decade willbe directed mostly towards TVET. This will make students more employable, given their academic capacityat entry in PSET and be more affordable for government as the unit costs are lower than that of a university.However, this will require much higher investment per student, more effective links with private employers,better quality assurance and the strengthening of the incentives framework to improve the quality of educationbefore rapid increases in enrollments can be envisaged. Furthermore, community colleges, which offer moreflexibility to accommodate the demand for education along the full life cycle and pathways to universityfor its brightest students, should receive the same level of attention for improvement as TVET. This will beinstrumental to avoid fueling the perception that TVET and community colleges are for the poor only, anduniversities for the rich.A revamped distance-learning model.Distance learning makes eminent sense in South Africa, where the lack of spatial integration remains a keydevelopmental issue. Yet, the University of South Africa (UNISA), the most prominent institution offering suchprograms and training most school teachers, suffers from massive inefficiencies and losses on investment asdropout rates exceed 85% for 3 to 4-year degrees. International experience suggests that moving from thetraditional model of integrated courses towards individualized coursework strongly supported by mentorshipis more cost effective, as completion rates and the employability of graduates are likely to improve significantly.viii South Africa Economic Update 12 Executive Summary
More private sector participation.The Sub-Saharan Africa region ranks last in terms of private PSET enrollments as well as enrollments overall,and South Africa is not an outlier in the region. Under the premise that it would provide a means of expandingenrollments at a lower cost to the state while protecting the quality of education, greater private sectorparticipation could be encouraged through the adoption of simpler accreditation rules similar to that for publicinstitutions. The possibility of private institutions receiving performance-based subsidies, employing publicuniversity professors, and for its students to receive financial aid, could also be explored. As a first step, theestablishment of non-profit institutions could be encouraged. As they have contributed most to the expansionof PSET enrollments in other continents, the non-profits could offer an alternative to for-profit institutions andaddress the concern that poorly regulated for-profit institutions may be inclined to compromise on educationquality even though their fees may be high, proving costly for both students and the government.Stronger controls and incentives to encourage better quality.Reducing the dropout rate and raising the employability of graduates will help to improve the fiscal rate ofreturn of subsidizing PSET. To improve quality, South Africa could consider three complementary measures:(i) strengthening quality assurance mechanisms by emphasizing learning outcomes and employability;(ii) forging closer links to the productive sectors of the economy and the labor market, notably throughcooperative programs; and (iii) promoting performance-based funding through stable, output-basedfunding formulas, performance contracts and competitive funds.Greater reliance on labor market observatories to guide students and PSET institutions in theirselection of curricula.In order to ensure that students enroll in programs that prepare them for meaningful employment and that PSETinstitutions adapt their programs to the changing needs of the labor market, one of the more effective toolsthat the government could use is a labor market observatory. A well-functioning observatory could monitorthe skills needed for the labor market, channeling students towards them instead of encouraging students tofollow prescribed programs.More fiscal incentives to mobilizing resources.Government should not penalize the most entrepreneurial PSET institutions by reducing their budgets when theybecome more adept at mobilizing resources beyond tuition fees and subsidies through fundraising and savingsby sharing resources. Penalties are self-defeating as they remove the incentives to generate additional income.A larger use of risk sharing mechanisms.South Africa could consider extending income-contingent loans to students from affluent households whileconfining grants to highly vulnerable and underprivileged students. This would free public financial resources toexpand PSET admission capacity and improve the quality of education while protecting poor and working-classstudents who are at risk of defaulting.Better regulation of tuition fees.The higher demand for PSET arising out of the new student financial aid system may result in tuition fees rising.Potential trade-offs between the necessary economic autonomy and viability of PSET institutions, and theeffectiveness of the NSFAS in promoting equity could be mitigated by making tuition fee increases that are aboveinflation conditional on the meeting of PSET performance indicators, such as teaching quality.Executive Summary South Africa Economic Update 12 ix
CHAPTER 1Recent Economic DevelopmentsChapter 1 aims to convey the following key messages: Global economic growth is losing steam, and risks of macroeconomicdisruption in emerging economies are mounting.South Africa’s anticipated economic rebound in 2018 did not occur, confirmingthe deep-seated nature of its growth challenges, and its vulnerability toclimate change and commodity price variations.The government maintained its committment to fiscal and debt sustainabilityand price stability, emphasizing structural reforms and greater private sectorparticipation to address South Africa's development challenges.
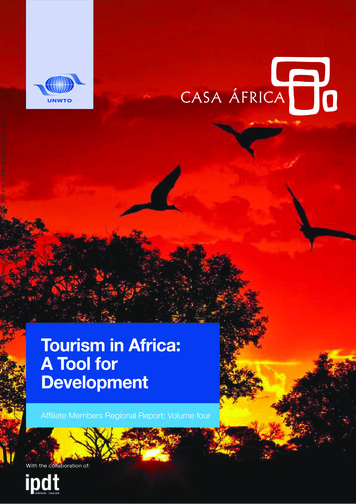
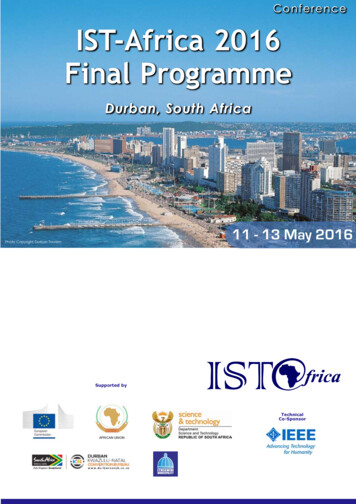
Global Economic DevelopmentsGlobal economic activity is losing momentum.At 3.0%, global GDP growth in 2018 was slower thanexpected (Figure 1.1.A). While economic activity inthe United States was supported by fiscal stimulus,growth in the Euro Area and Japan decelerated, partlyreflecting weaker manufacturing activity as globalgoods trade slowed. Moreover, growth in severalemerging and developing economies (EMDEs) wasweighed down by substantial financial marketstress, as investors became risk averse, turning theirfocus toward country-specific vulnerabilities amidtightening global financial conditions.Weakening manufacturing activity is weighing onglobal goods trade. Growth in global goods tradeslowed in 2018 (Figure 1.1.B). The decelerationwas underpinned by slowing export orders andweakening global manufacturing activity, as capitalgoods production moderated in many economies,specifically in developing Asia and Europe - twotightly interconnected manufacturing hubs.Accordingly, the global manufacturing PurchasingManagers' Index (PMI) declined to 51.5 index pointsin December 2018, from 54.5 a year earlier, as newexport orders fell below 50 - the level that separatesexpansion from contraction. In addition, tradeactivity was further weighed down by new tariffsthat were introduced by the United States and Chinaduring 2018, which affected around 2.5 percent ofglobal goods trade.Figure 1.1: Global activity indicatorsA. Global growthB. Global trade in goods growth andmanufacturing export nced economiesEMDEsGlobal trade 162015201420131New export orders (RHS)Sources: A. World Bank staff calculations. B. CPB Netherlands Bureau for Economic Policy Analysis, Haver Analytics, World Bankstaff calculations.Global financial conditions tightened. Inflationforecasts of many advanced-economy central bankshave been converging on target levels. As a result, bondpurchases have been tapered in the Euro Area and Japanwhile in the United States interest rates were increasedby a further 100 basis points in 2018. Accordingly, thedollar strengthened and U.S. 10-year yields rose to a7-year high of 3.2%, before moderating in recent weeks.Reduced appetite for EMDE assets fueled capitaloutflows in many countries. In the context of heightenedglobal policy uncertainty, trade tensions, and deterioratinggrowth prospects, investors’ search for high-yielding safeassets - such as U.S. Treasuries - gained momentum andtheir appetite toward many EMDEs waned. In particular,EMDEs with large external vulnerabilities and domesticfragilities experienced substantial capital outflows andChapter 1 South Africa Economic Update 12 2
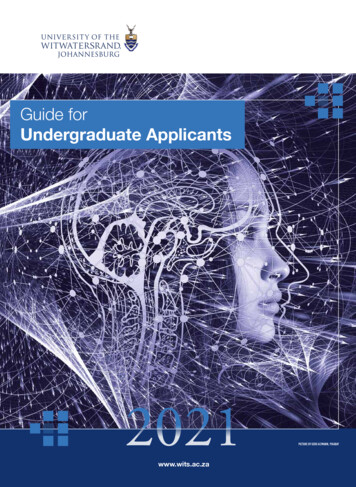
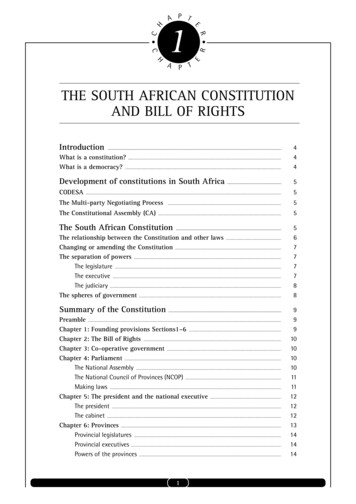
sharp currency depreciations. Since US strength startedin April 2018, EMDE currencies have depreciated byaround 10% - the most significant sustained depreciationsince early 2016. Moreover, cumulative portfolio outflowsfrom EMDEs have surpassed the outflows observed atthat time (Figure 1.2.A).Figure 1.2: Portfolio flows and commodity pricesA. EMDE portfolio flows during recentstress episodesUS billions, cumulative daily flowsB. Brent crude oil and metal pricesIndex, 100 January 2018101200110-10100-2090-30Brent 5Apr-18Tapertantrum2013Jan-1880-40MetalsSources: Institute of International Finance and World Bank staff calculations. Notes. A: Cumulative flows to major EMDEs, excludingChina, for the 236 days following the start of the stress episode. The start dates for the stress episodes are: taper tantrum: May 23,2013; China concerns: June 12, 2015; U.S. presidential election in 2016: November 9, 2016; latest episode: April 15, 2018. B: Metals pricesrepresent the average price in US of aluminum, copper, iron ore and zinc.While supply concerns kept oil prices elevatedfor most of 2018, fears of weaker demand haveweighed on metals prices. Oil prices increased by32% in 2018, averaging US 69 per barrel. Supplyconcerns owing to the continued decline of oilproduction in Venezuela and the reintroduction ofsanctions on Iran by the United States contributedto prices peaking at US 86 per barrel in October.However, in early November oil prices fell rapidlytoward US 60 per barrel as the United Statesgranted eight countries temporary waivers to thesanctions on Iran. In addition, oil prices were helpedlower by rising production in the United Statesand increased output by the Organization of thePetroleum Exporting Countries. In contrast to thesupply-driven volatility of oil prices, several metalsprices weakened in 2018 (Figure 1.2.B), especiallyduring the second half of the year as the impositionof broad-based tariffs by the United States onChinese imports fueled market concerns about theimpact of a slowdown in global trade on commoditydemand. As a metals exporter and net-oil importer,South Africa’s terms of trade was adversely affectedby these opposing commodity price dynamics.3 South Africa Economic Update 12 Chapter 1Growth in advanced economies has diverged.United States growth accelerated from 2.2% in 2017to an estimated 2.9% in 2018, as fiscal stimulus wasaccompanied by strong domestic demand, especiallyinvestment. Moreover, the labor market remains robust,with non-farm payrolls averaging nearly 220,000workers per month in 2018 and the unemploymentrate reaching an almost 50-year low of 3.7% duringthe year, before rising slightly to 3.9% in December.At the same time, average hourly earnings rose 3.2%- the strongest annual gain in nearly a decade. Inthe Euro Area, however, growth is estimated to haveslowed to 1.9% in 2018, from 2.4% in 2017, largelyowing to moderating net exports. ManufacturingPMIs corroborate the loss of momentum in Euro Areagrowth, falling from a peak of 60.6 in December 2017to 51.4 by December 2018. Moderating net exportsalso contributed to slower growth in Japan, whichdecelerated to an estimated 0.8% in 2018, from 1.9%in 2017.Private consumption in China remains resilient, butexport growth is decelerating. Growth in China hasslowed to an estimated 6.5% in 2018, from 6.9% in
2017. While robust consumption growth and improvingprivate investment have supported economic activity,slowing global manufacturing activity has contributedto moderating industrial production and exportgrowth. Moreover, growth in imports has also beendecelerating. However, it still outpaced exports, andcontributed to a current account deficit in early 2018- China’s first in two decades. Recent manufacturingPMIs have been lackluster, remaining near 50 indexpoints since mid-2018, while the subcategory for newexport orders has declined to 48.3 in December andunderscores weakening global demand.The recovery in other major emerging marketsand developing economies is facing headwinds. InArgentina, the economy contracted by an estimated2.8% in 2018, amid a crisis of confidence that inducedsubstantial financial market stress, halved thepeso’s purchasing power in US , and necessitatedan increase in the policy interest rate of around 40percentage points. The Turkish lira depreciatedalmost 30% in 2018, as heightened policy uncertaintyexacerbated investors’ concerns about rising inflation,a deteriorating current account deficit, and elevatedforeign-currency denominated private sector debt. Themanufacturing PMI fel
Figure 1.13: Actual and forward inflation expectations 21 Figure 1.14: South African exports and imports 26 Figure 1.15: South African Reserve Bank cyclical indicators 27 Figure 1.16: GDP growth projections 27 Figure 2.1: University access and wage inequality, 2006-15 31 Figure 2.2: University enrollment rate in South Africa and selected countries, 2015 32