Transcription
ACCOUNTS PAYABLE
Accounts PayablePerformance Measurement & Benchmarking ReportPROGRAM MAPAccounting ServicesTax & FinancialSystem SupportFinancial Reporting &ControlPayment ProcessingSAP FinancialSystems ngSAP FinancialUser WSupportProvincial andFederal ReportSubmissionCorporateBankingFinancial ntrolPCardProcessingTax Advisoryand PolicyShaded boxes reflect the activities covered in this reportThe goal of accounts payable services is to ensure the efficient and effectivemanagement of payments to suppliers who do business with the City of Toronto.Specific objectives include: Ensuring invoices are accurate and properly authorized for paymentProcessing of invoices on a timely basisTaking advantage of available early payment discounts where appropriateMaintaining relationships with suppliersProviding customer service to internal divisions and vendorsCorporate oversight of payable activity across the organizationAccounts payable compliance2
Accounts PayablePerformance Measurement & Benchmarking ReportSUMMARY OF PERFORMANCE MEASUREMENT RESULTSQuestionIncreaseExternal Comparison toOther Municipalities(MBNC)By Quartile for 20173Increase in the number ofinvoices paid within 30days(Customer Service)Lower percentage ofinvoice paid within 30 dayscompared to others.(Customer Service)Internal Comparisonof Toronto’s2017 vs. 2016 ResultsIndicator/MeasureHow long does it taketo pay an accountspayable invoice?Percentage of InvoicesPaid Within 30 Days (Customer Service)Have discountsoffered for earlypayment of invoicesbeen obtained?Percentage of EarlyPayment DiscountsAchieved – (Efficiency)StablePercentage of earlypayment discountsachieved was stable.(Efficiency)N/ANumber of Invoices Paidper Accounts PayableFTE – (Efficiency)How much does itcost to process anaccounts payableinvoice?Accounts PayableOperating Cost perInvoice Processed –(Efficiency)Number of invoicesprocessed per staffmember increased(Efficiency)StableCost per invoice processedwas relatively stable(Efficiency)1.11.2pg. 41.3pg.53IncreaseHow many invoicesare processed byeach accountspayable staffmember?Chart& PageRef.Lower rate for number ofinvoices processed perstaff member compared toothers(Efficiency)4Highest cost per invoiceprocessed compared toothers(Efficiency)1.41.5pg.61.61.7pg.7SUMMARY OF OVERALL RESULTSExternal Comparison toOther Municipalities(MBNC) By Quartile for2017External Comparisonto Other Municipalities(MBNC) By Quartile for2017Performance Measures (Results)Service Level Indicators (Resources)Performance Measures (Results)2- Favourable2- Stable0 -UnfavourableN/AInternal Comparisonof Toronto’s 2017 vs. 2016ResultsInternal Comparisonof Toronto’s 2017 vs. 2016ResultsService Level Indicators (Resources)N/A100% favourable or stable0 - 1st quartile0 - 2nd quartile2 - 3rd quartile1 - 4th quartile0% in 1st and 2nd quartileFor an explanation of how to interpret this summary and the supporting charts, please see the Guide toToronto's Performance Results. These quartile results are based on a maximum sample size of 16municipalities.3
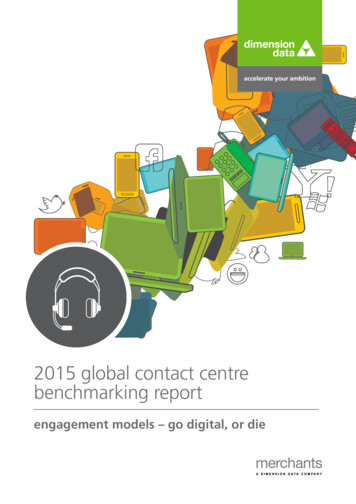
Accounts PayablePerformance Measurement & Benchmarking ReportCUSTOMER SERVICEOne objective of the accounts payable (A/P) function is the timely processing of vendorinvoices. This must be balanced by ensuring that invoices are accurate and the specified goodsor services are received and authorized for payment.1.1 – HOW LONG DOES IT TAKE TO PAY AN ACCOUNTS PAYABLE INVOICE INTORONTO?100%Chart 1.1 summarizesthe proportion of A/Pinvoices paid within30 days of the invoicedate, between 31 and60 days, and over 60days.% of invoices 20162017Results in 2017increased by 3.7% 30 & 60days 20.6% 20.2% 18.7% 16.3% 15.0% 19.8% 17.9% 17.1% 22.4% 16.9% from the previous 30 days67.2% 65.0% 71.1% 73.2% 75.4% 67.7% 69.1% 72.9% 64.7% 68.4% year, with 68.4% ofinvoices paid withinChart 1.1 (City of Toronto) Percentage of A/P Invoices Paid Within Specified Time Period30 days. The percentage of invoices paid within 60 days was 85.3%. The payment cycle time forCity vendors is expected to increase (improve) in the upcoming years as a result of theimplementation of SAP Ariba, and a continuous focus on performance measures. 60 days12.2% 14.9% 10.2% 10.4% 9.6% 12.5% 13.0% 10.1% 12.9% 14.7%1.2 – HOW LONG DOES IT TAKE TO PAY AN ACCOUNTS PAYABLE INVOICE INTORONTO COMPARED TO OTHER MUNICIPALITIES?100%Chart 1.2 comparesToronto's 2017results to otherCanadianmunicipalities interms of the timerequired to payinvoices (cycletime).90%% of invoices %17%17%24%23%25%31%38% 30 days dian70%70%70%70%70%70%70%70%70%70%70%70%70%70%70% 60 days 30 & 60days70%Niag Ham T-Bay DurTorHalWind WinnHfxYorkChart 1.2 (MBNC 2017) Percentage of A/P Invoices Paid Within Specified Time Period4
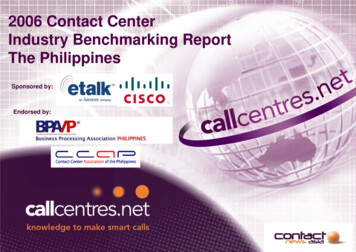
Accounts PayablePerformance Measurement & Benchmarking ReportToronto ranks ninth of sixteen (third quartile) in terms of having the highest percentage ofinvoices paid within 30 days.Initiatives implemented in recent years to reduce the payment cycle time include; publication ofclear billing requirements for vendors to reduce the incidence of incorrect or incompleteinvoicing; an option for vendors to receive payment from the City by direct deposit; allowingvendors to submit their invoices electronically; and a vendor early payment discount program.One of the factors that influence Toronto's comparative results relate to its organizational form.Toronto has a centralized accounts payable process, while other Municipalities aredecentralized. In a centralized model, most of the accounting processes are done by oneDivision, while the decentralized model these processes are done by several operatingDivisions.EFFICIENCYSome vendors offer early payment discounts to motivate their customers to pay their invoicessooner. By paying invoices sooner, the City can capture those discounts and save money.1.3 – HAVE DISCOUNTS OFFERED FOR EARLY PAYMENT OF INVOICES BEENOBTAINED IN TORONTO?100% 2,50080% 2,00060% 1,50040% 1,00020% 5000%2008200920102011201220132014201520162017% obtained91.0% 82.6% 80.4% 81.5% 80.3% 82.0% 80.7% 89.9% 88.8% 88.8% value obtained art 1.3 displaysthe percentage(columns) and dollarvalue (line) ofavailable earlypayment discountsobtained in Toronto. 01,440Chart 1.3 (City of Toronto) Percentage and Dollar Value of Available Early payment discounts obtainedIn 2017, the result was stable compared to the previous year with 88.8% of available discountscaptured. The total value obtained from the early payment discounts was 1.4 million, anincrease of 6,000 from 2016.Accounting Services continue to work with vendors to capitalize on early payment discountopportunities resulting in an increased capture rate for discounts.5
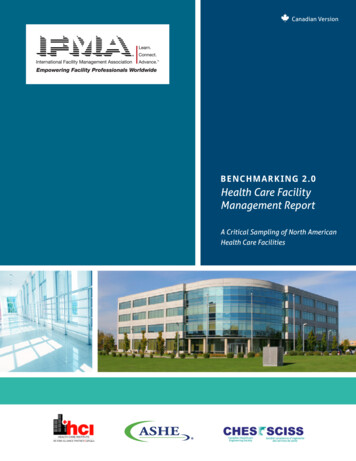
Accounts PayablePerformance Measurement & Benchmarking Report1.4 – HOW MANY INVOICES ARE PROCESSED BY EACH TORONTO ACCOUNTSPAYABLE STAFF MEMBER?15,000# invoicesper A/P staff12,0009,0006,0003,0000Total #of 7,630 516,736 559,586 526,643 548,073 463,913 508,557 517,566 415,198 451,518# invoices10,587 10,545 11,420 11,325 12,456 11,045 12,108 12,939 11,533 12,542per A/P staffChart 1.4 (City of Toronto) Number of Invoices Processed per Accounts Payable Staff MemberChart 1.4 providesToronto's totalnumber and rate ofAccounts Payableinvoices paid perAccounts Payablestaff member, and2017 resultsincreased by 8.7%in relation to 2016.This increase wasthe result ofimplementation ofan electronicprocess for utilityinvoices.1.5 – HOW MANY INVOICES ARE PROCESSED BY EACH ACCOUNTS PAYABLE STAFFMEMBER COMPARED TO OTHER MUNICIPALITIES?25,000Chart 1.5 comparesToronto's 2017 resultto othermunicipalities for thenumber of A/Pinvoices processedper staff SudWinnTorLonNiagT-BayDurReg# invoices 22,193 19,622 18,515 17,722 17,721 15,139 13,682 13,151 12,542 12,208 12,034 12,019 10,429 9,653MedianHfxWind9,5027,88812,847 12,847 12,847 12,847 12,847 12,847 12,847 12,847 12,847 12,847 12,847 12,847 12,847 12,847 12,847 12,847Chart 1.5 (MBNC 2017) Number of Invoices Processed per A/P Staff MemberToronto ranks ninth of sixteen (third quartile) in terms of having the highest number of AccountsPayable invoices processed per staff member.6
Accounts PayablePerformance Measurement & Benchmarking Report1.6 – HOW MUCH DOES IT COST TO PROCESS AN ACCOUNTS PAYABLE INVOICE INTORONTO? 12Chart 1.6 shows thatToronto's operatingcosts per invoicepaid was relativelystable with a slightincreased by 1.1%compared to 2016. 10 8 6 4 2 0Op.Cost/Invoice Processed2008200920102011201220132014201520162017 9.94 10.63 10.24 10.18 8.84 11.01 11.06 10.32 11.20 11.32Chart 1.6 (City of Toronto) Accounts Payable Operating Cost per Invoice Processed1.7 – HOW MUCH DOES IT COST TORONTO TO PROCESS AN ACCOUNTS PAYABLEINVOICE COMPARED TO OTHER MUNICIPALITIES? 12Chart 1.7shows, Torontoranks sixteenthof sixteenth(fourth quartile)in terms ofhaving thelowest cost perinvoice paidmember. 10 8 6 4 2 0WatHamMtlSudNiag T-Bay YorkCalWinnHalHfxDurLonReg WindTorOp. Cost / Invoice Processed 2.96 4.50 4.62 5.43 5.58 5.66 5.98 6.56 6.68 6.87 7.37 7.52 7.63 7.65 8.66 11.32Median 6.62 6.62 6.62 6.62 6.62 6.62 6.62 6.62 6.62 6.62 6.62 6.62 6.62 6.62 6.62 6.62Toronto has thehighest cost toprocess anaccountspayable invoice.Chart 1.7 (MBNC 2017) Accounts Payable Operating Cost per Invoice ProcessedIn 2017, there was a direct and significant net cost savings of 1,440,283 by the capturing ofearly payment discounts captured through payable efforts which would reduce the cost of theinvoice paid to 8.12 net cost per invoice. Toronto's operating costs (reflected in Charts 1.6 and1.7) do not include the significant cost savings of the early payment discounts captured throughpayable efforts, as shown in Chart 1.37
Accounts PayablePerformance Measurement & Benchmarking Report2017 ACHIEVEMENTS AND 2018 PLANNED INITIATIVESThe following initiatives are intended to further improve the efficiency and effectiveness ofAccounts Payable Services:2017 Initiatives Completed/Achievements Provided financial reporting, control and advisory services that add value and ensurecompliance with accounting standards, relevant legislation and Council policies.Supported the sustainment, improvement and protection of the integrity of the City's financialand payroll system (SAP), including testing, training, user support, and system upgrades.Implemented Corporate Accounts Payable Key Performance Indicators (KPI's) metrics andother relevant reports for client divisions on the accounting intranet web site.Accounts Payable continuous automation process has resulted in receiving over 82% ofaccounts payable documents electronically from City Vendors and Internal customers.Encouraged vendors to capitalize on early payment discount opportunities.Implemented the automation of the receipt and processing of Capital Transmittal, PaymentRequisitions and Schedule "A" vendor invoices.2018 Initiatives Planned Continue to automate the Accounts Payable process to improve efficiency and customerrelationships with City vendors and City Divisions.Continue implementation of the Supply Chain Management Transformation Project, alsoknown as SAP Ariba, to capitalize on business process efficiencies. This project is intendedto reduce processing time from current business practices.Factors Influencing Results of MunicipalitiesThe results of each municipality found in the charts included in this report are influenced tovarying degrees by factors such as: Organizational form - Centralized vs. De-centralized invoice approval process, as well asthe number of different office locations. Processes & Systems - Differences in system generated vs. manually generated invoices(e.g. phone lines, utilities), differences in records management (e.g. document imaging vs.not imaging), and the nature of the payment approval process (e.g. electronic vs. manual). Credit card purchases - some invoices are system generated (credit cards), which reducesthe number of invoices to process. Payment policy and practices – the timeline for paying invoices may vary according todifferent local policies.8
Accounts Payable invoices paid per Accounts Payable staff member, and 2017 results increased by 8.7% in relation to