Transcription
# 6/20174.Tableauvs. QlikView:Comparing the TwoVisualization Giants48.What We Can Takefrom Skydivingfor SoftwareDevelopmentTHREE PRACTICAL USES FOROBSERVABLES0 19.IN ANGULARBlockchain Distributed Ledger Technologies I The Art of Crafting Architectural Diagrams
Luxoft’s brightminds share theiroriginalperspectiveson technologyExplore the content and find out moreat www.luxoft.com/minds/
TECHNICAL4Tableau vs. QlikView: Comparing the Two Visualization GiantsHector Morales8The Art of Crafting Architectural DiagramsIonut Balosin16Transforming the World Through the Eyes of Computers,in Automotive and BeyondSergey Gromenyuk19Three Practical Uses for Observables in AngularLukas Ruebbelke32Are Deep Neural Networks and Backpropagationthe Path to Strong Artificial Intelligence?Enrique Cortez36Healthcare and Life Sciences –Together yet Separate in Their Technological JourneysSam Mantle39Blockchain Distributed Ledger TechnologiesAleksandr Kopnin48What We Can Take from Skydiving for Software DevelopmentMikhail DruzhininCORPORATE VIDEOS52 Luxoft Videos19.LoGeek Magazine, 0 Editor: Dilya SaramkovaFor any comments, suggestions or requests for becominga part of the next issue please write to LGmagazine@luxoft.comAll rights reserved Luxoft Global Operations GmbH, 2017. The materials arenot an offer. The opinions expressed in the articles are not representations offact; the opinion expressed in each article is the opinion of its author and doesnot necessarily reflect the official opinion of Luxoft Global Operations GmbH.Therefore, Luxoft Global Operations GmbH does not accept liability for any errorsor omissions in the content of articles or of the expressed authors’ opinions, whicharise as a result the publication. For reports of copyright violations please write toLGmagazine@luxoft.com.# 6/2017
TABLEAUCOMPARINGTHE TWOVISUALIZATIONGIANTSTHECTOR MORALESoday’s businesses do not rely upon an analytical tool just because it’s the latest in the market. They wantadvanced, convenient and smart tools that help analyze complex data instantly. Gone are the dayswhen one-dimensional and static graphs and charts were used to demonstrate statistics. Businessesneed more visually appealing, interactive and agile tools that fit into real-time requirements.Tableau's deep expertise and rich features are evident inits advanced, interactive capability for visual exploration,its analytics dashboards and support for mobile-basedexploration and authoring. Analytics are supported throughout visual exploration features, and dashboards andsupport with mobile authoring all reside in the cloud, providing enterprises with flexibility in reporting and analysis.Qlik’s architecture has been designed to support self-contained ETL and data storage, making this series offeatures a strength of the system when compared with4QLIKVIEWTableau. Both Qlik and Tableau are evenly matched onself-service data preparation, an area which both companies have publicly stated they are investing a significantamount of their R&D budgets to this year.Qlik and Tableau are also well-matched on all aspects ofanalytics and BI, with Tableau having the edge for its platform work integration, ease of use, and visual appeal. Forenterprises that rely on a wide variety of data integrationpoints, Qlik has the advantage, given the depth and breadth of its options in this area.
#6/201701EASE OF USETableau: Its interface is simple, not overcrowded with toomany features on one page and has a drag and drop interface. It doesn't provide a feature that allows the user to searchfor content across all their data. Users can easily create theirown views using various objects, and it’s easy because ofa well-designed GUI interface.QlikView: It's easy to use and explore hidden trends. To search, just type any word in any order into the search box forinstant and associative results and it will show connectionsand relationships across data. It is difficult for the user todesign their own views due to menu-driven properties.03COSTTableau: Tableau offers a free desktop version called “Public",which makes data available for download. Private versionscome with a fixed fee of 999 or 1,999, depending on dataaccess. For Tableau Server, anecdotal evidence says 1000per server user with a minimum of ten users, plus maintenance.QlikView: The personal edition is free, with limited documentsharing. Each named user license is 1,350 and it’s 15,000to add a concurrent user. The server license is 35,000 perserver. It costs an additional 21,000 per server for PDFdistribution service and 22,500 for SAP NetWeaver connector. May require RAM upgrades if there are large numbers ofconcurrent users.05DEPLOYMENTPROCESSES & SYSTEMREQUIREMENTSTableau: Does not have its own data warehouse. Cannot create layers while connecting with data sets. Easier to deploybecause it requires more structured data.QlikView: Has its own data warehouse and the addition ofa scripting feature adds value. We can use multilevel layersin QlikView deployment. QlikView is easily deployable andconfigurable, and produces stunning reports within minutes ofinstallation. This product does not use cubes; hence, it loadsall the tables and charts in memory to enable interactivequeries and the creation of reports, a technology not found inother products. It can be developed on both 32 and 64 bit. Itsassociative technology makes data modeling easier.02EASE OF LEARNINGTableau: It also has an actively engaged community andresources. Tableau is a simple drag and drop application,making it very easy to learn.QlikView: It has an actively engaged community with resources to help you learn the software in the best possible manner.04CONNECTIVITY WITHOTHER TOOLS,LANGUAGE, DATABASETableau: Can integrate with a broader range of data sourcesincluding spreadsheets, CSV, SQL databases, Salesforce, Cloudera Hadoop, Firebird, Google Analytics, Google BigQuery,Hortonworks Hadoop, HP Vertica, MS SQL Server, MySQL,OData, Oracle, Pivotal Greenplum, PostgreSQL, Salesforce,Teradata, and Windows Azure Marketplace. It can connectwith R, which fuels the tool's analytical capabilities of the tool.It can also connect with big data sources.QlikView: Can integrate with a very broad range of data sources, such as Amazon Vectorwise, EC2, and Redshift, ClouderaHadoop and Impala, CSV, DatStax, Epicor Scala, EMC GreenPlum, Hortonworks Hadoop, HP Vertica, IBM DB2, IBM Netezza,Infor Lawson, Informatica Powercenter, MicroStrategy, MS SQLServer, My SQL, ODBC, Par Accel, Sage 500, Salesforce, SAP,SAP Hana, Teradata, and many more. It can connect with Rusing API integration, and can connect with big data.06VISUALIZATIONOBJECTSTableau: Offers good visualization for objects, with betterformatting options. Good geo-spatial visualizations. Numerous options for vizualizing data. Visualizations are alwaystop-quality.QlikView: Offers good options for visualizing information,and is loaded with objects. We can play with the propertiesof these objects easily to customize them. We can customizeobjects easily by playing around with their properties, and it'salso easy to create custom charts like waterfall, boxplot, orgeospatial charts by customizing properties. While insertingobjects, QlikView offers layout and formatting options fittingwith the document theme. Here, we need to work on formatting options to make it more visually appealing.5
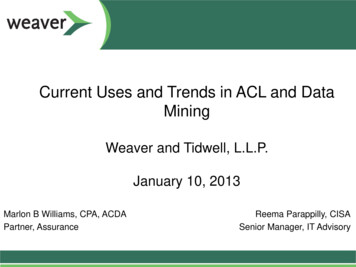
Advantages of TableauAdvantages of QlikViewEVERYONE CAN USE ITUSER-CENTRIC INTERACTIVITYTableau allows the common user to generate interactive business intelligence reports, even with little technical proficiency. Tableau is perfectly suitable for topmanagement employees who need a smart businessintelligence tool that is easy to operate.QlikView is highly user-centric, as it allows the user tofind meaningful insights instantly with the help of a richset of visualization features.FIND ASSOCIATIONSQlikview lets you find associations between datasetsand conduct searches across all available data, andthen filter results according to your needs.FASTTableau is able to create interactive visualizations andreports in a few minutes, making it a very fast tool.FLEXIBILITY IN ACCESSMAPSTableau is efficient in creating multi-dimensional mapswith the help of its built-in geocoding feature.You can access your data in QlikView while sitting on theopposite side of the world at any time, regardless of thedevice being used.INTERACTIVE DATA VISUALIZATIONFAST ANALYSISTableau prepares interactive reports and gives recommendations according to user specifications. Tableau is rich in data visualization capabilites, thanks towhich it automatically measures and segments data.QlikView is able to deliver results the moment you search. Its highly optimized nature and scalability helpsit access large data sets on the fly.QUICK TIME TO VALUETIME AND EFFORT SAVINGAllows you to measure time-to-value for whatever timeduration you choose and find accurate results in no time.One can easily connect to the database using Tableau,which reduces time and effort that can be better usedin analytics.USERFRIENDLYCOST-EFFECTIVENot only does it save time and effort, but money aswell - this tool allows companies to avoid investingmore money in acquiring additional IT resources.INFORMATION SHARINGTableau creates reports and allows sharingonline and offline, making the process faster.MAINTAINS SECURITYTableau controls information accessthrough various security measures.RESPECTS SECURITYPROTOCOLSOFFLINE - ONLINEPUBLISHING OFDATA ANALYSISSTORYTELLINGFEATURETABLEAURICH INTERACTIVEVISUALIZATIONSTHROUGH THE"SHOW ME" FEATUREDASHBOARDWITH INTERACTIVEREPORTINGMULTIPLE DATASOURCES IN ONEVIEW6LESS DEPENDENTON IT RESOURCESDIRECTCONNECTIVITY TODATA SOURCESFITS WITH ANYDATA ARCHITECTURE
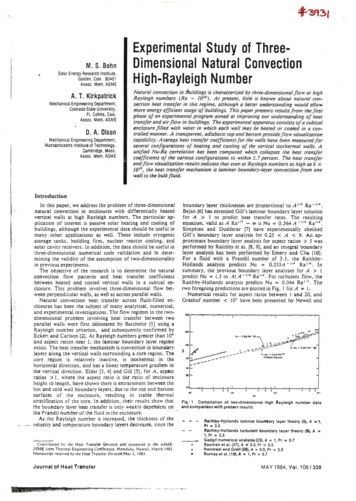
#6/2017IN CONCLUSION: EITHER CAN BEBEST FOR YOU, DEPENDING ONWHAT YOU ARE LOOKING FOR.TABLEAUQLIKVIEWI ANALYZE MILIONSOF POINTS OF DATAI ANALYZE BILIONSOF POINTS OF DATAI ALREADY HAVE ETL TOOLSI NEED ETL TOOLSI DON'T EMPLOY IT SPECIALISTSI EMPLOY IT SPECIALIST(S)I OFTEN MODIFYANALYSISI CONSTANTLY MODIFYMODIFY ANALYSISHECTOR MORALES KOTTHector Morales Kott is an Analytics Professional with a passion for driving actionableinsights through data visualizations in multiple industries such as retail, technology,travel, manufacturing, and the public sector. Hector is working as a Senior BusinessIntelligence Consultant for Luxoft, where he is developing high-quality BI Tableausolutions/dashboards for a client’s supply team. Previously Hector worked as LeadAnalyst BI & Reporting Latin America for The Hershey Company, where he startedas a Sales Representative and acquired a unique feel about the real informationnecessities in the field. He graduated with a Bachelor of Science degree in ComputerEngineering from Anahuac University. Contact him at www.hectormoraleskott.com.7
THE ARTOF CRAFTINGARCHITECTURALDIAGRAMSIONUT BALOSINT8he need to create architectural diagrams might arise at some point with any software project we areinvolved in. Whether we are following a formal architectural model (e.g., Kruchten 4 1, Rozanski &Woods, etc.) or not, there is still a need to document some parts of the application by creating diagrams.In software architecture, such diagrams are created incompliance with views which are related to aspecific viewpoint that could be part of a model, but in the current article I prefer to stick to an informaluse of the term “architectural diagram”; I don’t intend to cover all other aspects.
#6/2017Based on my experience as a software architect andtechnical trainer, there are multiple discrepancies withhow architectural diagrams are created. This variesfrom project to project, inside project teams, and evenfrom developer to developer. I see many instances ofinconsistency, fragmentation, and granularity of rendered information and the look of diagrams. Comparedto an architectural model which must be formal anddon't necessarily follow a specific standard. Nevertheless, diagrams must be self descriptive, consistent, relatively accurate and connected to the code. That’s whyit is important that every architect or software engineerrely on several guidelines when creating architectural diagrams, since they are the common ground forcommunicating the application’s architecture over time(e.g., structure, elements, relationships, properties, andprinciples), and across different stakeholders with various technical backgrounds and concerns.KEY TAKEAWAYSDesigning architectural diagrams might notbe an easy task; they can be tricky and errorprone, even the simplest ones. Creating consistent and meaningful diagrams, however,brings clarity and consensus across differentstakeholders.In most cases, the real issues are not strictlyrelated to using a less efficient ArchitecturalDescription Language (e.g., UML), but the misunderstanding of the diagram’s importance,relying on improper or inconsistent guidelinesor even the lack of architectural education.In the process of creating diagrams, try to blendthose that are automatically generated with manually created ones in order to minimize thework, illustrate different set of concerns and cover multiple abstraction levels of the system.As the system evolves, maintaining up-to-date diagrams requires extra effort. We need toknow how to proceed efficiently in such caseswhile still maintaining consistency and robustness across architectural diagrams.Modern architectures bring extra complexities, which are reflected in the diagrams.Additional concerns might emerge and couldeasily lead to cluttered, incomplete or fragmented diagrams; hence, finding the rightbalance is keyCURRENT PITFALLS WHENDESIGNING ARCHITECTURALDIAGRAMSBefore going deeper into ppotential issues, I would liketo quote an English idiom, "A picture is worth a thousandwords." According to the Wiki explanation, “It refers tothe notion that a complex idea can be conveyed withjust a single still image or that an image of a subjectconveys its meaning or essence more effectively thana description does.” The same concept applies to an architectural diagram: if it raises more questions than answers, the diagram has not been constructed well. Anarchitectural diagram should never require a thousandexplanations!CLIENT SYSTEMCENTRAL SYSTEMRBPMCOMPONENTSPRINGOUT QUEUEIN QUEUEINTEGRATIONLOGICHIBERNATEDATABASETHREADSMySQL CLASS TICKETHANDLERHANDLE ()MONITORINGSERVICETFH PROCESSFIREWALLEXTERNALSERVICEVIRTUAL MACHINEGraph 1: A n example of an improper architectural diagram.It suffers of most of the issues described below.Let’s now go through a list of pitfalls that could hinderthe process of creating good architectural diagrams.9
01WHAT DOES A BOXOR SHAPE DENOTE?02WHAT DO A SHAPE'SDIFFERENT EDGESREPRESENT?Using a box or shape that is improperly documentedmight result in multiple interpretations. It might be associated with a piece of data, a bunch of code, or a process. A simple box in a diagram might raise multiplequestions. It is important to avoid them by explicitly listing details about the box or shape's meaning in thediagram legend.Each edge of a shape (e.g., dashed, dotted, etc.) canbe misunderstood in a poor diagram. Does a specific border refer to a specific component type (e.g.,a dashed line refers to a container, a microservice, a layer, etc.), or it is just the designer’s preference to have a rich look and feel? Avoid such confusionby providing accurate details in the legend diagramwhen choosing multiple or non-standard edges.03WHAT DOES A LINEOR ARROW DENOTE?A line or an arrow can be interpreted either as dataflow (data flows from system A to system B), or as a relationship across elements (component A depends oncomponent B). In most cases the relationships or dataflows represented by arrows do not converge in thesame directions and it is important to explicitly document this in the diagram legend.04WHAT COMMUNICATION/ASSOCIATION TYPE DOESA LINE OR ARROWREPRESENT?Even if the line refers to data flow or a relationshipacross components, the communication type (the caseof data flow) or the association type (relationship) denoted by that line or arrow must be detailed. For example, if the line represents data flow, the communication might be synchronous or asynchronous, but if theline refers to a relationship, it might be represented bya dependency, inheritance, implementation, etc. All ofthese details must be present in the diagram legend.1005WHAT DOES THATCOLOR MEAN?Having a diagram with multiple colors for boxes and lineswithout a corresponding key will raise multiple questions(Why are some boxes green while others are red? Whyare some lines black and others blue?). Color schemeis less important in a diagram, and using a rich numberof colors doesn't add valuable content or information.A diagram can be self-explanatory and well-designedwith just the use of black and white. Unless there is a reason to emphasize some parts of the diagram by usingdistinguishable colors, it adds unnecessary complexity.It is always better to stick to simplicity in terms of colors,but if you choose to use them, don’t forget to clearlylabel what each color represents.06MISSING RELATIONSHIPSBETWEEN DIAGRAMELEMENTS OR ISOLATEDENTITIESMissing relationships between elements or isolatedentities in a diagram might indicate incompleteness.From both a structural and behavioral perspective,each element should have a relationship, representedby a line or an arrow, with another part of the system,which is represented through another element.07MISLEADING/UNDOCUMENTEDACRONYMS OR VAGUEAND GENERIC TERMSWhen labeling in a diagram, avoid using misleadingor undocumented acronyms that might cause confusion. A sequence of letters (e.g., TFH, RBPM) do notmean anything without a corresponding explanationon the diagram, or even better - in the diagram legend(e.g. TFH - ticket feed handler, RBPM - rates businessprocess manager). Another problem encountered innaming diagram elements relates to the use of extremely vague or generic terms (e.g., business logic, integration logic, etc.). The issue might reside at the codelevel as well. Always use self-explanatory names andfollow clean code principles.
MMING(OR SCRIPTING)LANGUAGES, IDEOR DEVELOPMENTMETHODOLOGYON DIAGRAMSArchitectural design is not fundamentally based on anyone technology, framework, programming or scriptinglanguage, IDE or development methodology. All ofthese come later on in the process to help build thearchitecture, but they are not the central focus. Theyshould not be included in diagrams, but stated in thearchitectural description instead, including the rationale around choosing them.09MIXING RUNTIME ANDSTATIC ELEMENTS IN THESAME DIAGRAM11CONFLICTING LEVELSOF DETAIL OR MIXEDABSTRACTIONSAdding elements related to different levels of abstraction in the same diagram can conflict since they areseen from different perspectives. For example, adding components to an architectural context diagramor classes to a deployment diagram can distract fromthe purpose of the diagram itself. When creating a diagram, try to stick with the same level of abstraction.12CLUTTERED OR VAGUEDIAGRAMS SHOWINGTOO MUCH OR TOOLITTLE DETAIL“Everything should be made as simple as possible, butno simpler, ” is a well-known quote attributed to AlbertEinstein. This is valid for architectural diagrams as well;the level and the granularity of captured informationshould be meaningfully chosen. This is not an easy thing;it depends on the architectural model used, the experience of the architect and the complexity of the system.Runtime elements (threads, processes, virtual machines, containers, services, firewalls, data repositories,etc.) are not present at compilation time and mixingthem with static elements (components, packages,classes and so on) in the same diagram should beavoided. There are dedicated diagram types (such asconcurrency diagrams or deployment diagrams) whichare primarily focuse
QlikView: The personal edition is free, with limited document sharing. Each named user license is 1,350 and it’s 15,000 to add a concurrent user. The server license is 35,000 per server. It costs an additional 21,000 per server for PDF distr