Transcription
Fiscal Year Ended March 2007Full Year ResultsMay 14th, 2007SEGA SAMMY HOLDINGS INC[Disclaimer]The contents of this material and comments made during the questions and answers etc of this briefingsession are the judgment and projections of the Company’s management based on currently availableinformation.These judgments and projections involve risk and uncertainty and the actual results may differ materiallyfrom these contents/comments.Copyright SEGA SAMMY HOLDINGS INC. All Rights Reserved.1
Full Year ResultsCopyright SEGA SAMMY HOLDINGS INC. All Rights Reserved.2
Highlights Net sales: 528.2 Billion, Operating Profit: 76.5 Billion,Ordinary Income 81.2 Billion, Net Income: 43.4 Billion Decline in sales and profits versus the prior yearPachinko Pachislot:Pachislot: Sales of both old and new regulation machines were strongPachinko: Did not meet sales expectations or the prior year’s levelAmusement Machines:Generally strong results, sales and profits at the same level as the prioryearAmusement Facilities:As a result of same store sales and the kids card game business notachieving plans, results fell well short of the prior year’s resultsConsumer Business:Strong entertainment software sales lead to increased revenue, butrevenue growth offset by increases in R&D as profits maintain the samelevel as the prior periodCorporate Actions: Purchase of overseas entertainment software studios Europe: Sports Interactive Ltd.US: Secret Level Inc. Business and Capital tie-up with Taiyo Elec Co., Ltd Comprehensive strategic alliance with SanrioCopyright SEGA SAMMY HOLDINGS INC. All Rights Reserved.3
Condensed Consolidated Income StatementFY 2006FY 2007( Billions)ResultsForecastResultsYOY ChangeNet 6.5-35.8%21.5 %16.8%14.5%-7.0 Points119.5100.081.2-32.0%21.6%17.2 %15.4%-6.2 PointsNet Income66.260.043.4-34.4%Net Income Margin12.0%10.3 %8.2%-3.8 PointsOperating MarginOrdinaryIncomeOrdinary IncomeMargin*FY 2007 EPS: 172. 47Copyright SEGA SAMMY HOLDINGS INC. All Rights Reserved.4
Segment ResultsFY 2006FY 2007( Billions)ForecastResultsNet 20.4%Amusement Machines71.584.075.4 5.5%Amusement .5 inko Pachislot99.878.571.1-28.8%Amusement Machines12.112.511.6-4.1%Amusement ther-1.70.0-1.3-Eliminations-2.3-8.0-6.7-Pachinko PachislotBreakoutResultsOperating ProfitBreakoutCopyright SEGA SAMMY HOLDINGS INC. All Rights Reserved.5
Balance SheetAssetsAccountCash an d Equiv alent sPrior1Li abi l i ti es and Net AssetsCurrent214 4,5 21146 ,64 5Receivables9 6,7 2783 ,49 2M ark et able Securit ies1 9,4 9799 6Change2 ,12 43 2,2 0040 ,11 77 ,91 73 8,3 8440 ,92 22 ,53 8Total Curre nt Asse ts56.8%P ayables(18 ,50 1) Ot herOt her63.4%Account(13 ,23 4) Sh ort T erm LoansIn vent oriesCurre nt Asse ts %Curre nt Lia bilitie s %8,3 9529 ,24 420 ,84 96 6,8 2452 ,36 2(14 ,46 2)26.2%27.9%1.8%5,5 961 ,11 1(4,485 )2 0,3 5321 ,25 4In t an gible Fixed Asset s1 6,7 1225 ,26 78 ,55 4Ot herLong Term Lia bilitie s %Long Te rm Liabilitie s3 ,55 36.6%90 16.9%-2.6%38,060Total Liabilitie s186,923191,0824,158Sh areh older's Equit y32 1,1 963 48 ,56 527 ,36 9(10 ,49 6)(5,979 )W arrant s4 ,83 09.5%15,66849,569Va lua tion a nd Tra nsla tion Adj ustm e ntsFixe d Asse ts %9,280(19,156) Lon g T erm Debt29 ,24 337 ,12 871 ,41 4(7,925 )111 ,89 73 2,2 97Change6 2,1 3315 ,69 58 2,6 54Ot her22 3,6 20T angible Fix ed Asset s63 ,47 1CurrentCorp orat e Bonds312,1755 9,9 181153,021-6.6%Total Curre nt Liabilitie sPrior137,353331,331In vest m ent Securit ies\ Millions(4,5 16 ) Min orit y Int erest1 9,3 11Sha re holde r's Equity %64.3%(11,509)45 445 420 ,33 41,02236.6%43.2%Total Fixe d Asse ts191,583237,76546,181 Ne t Asse ts335,991358,85822,867Total Asse ts522,914549,94027,025 Total Net Assets an d Liab ilities522,914549,94027,025Topics Purchased 12.32 million shares of Sanrio(13.98% of outstanding shares) Increase in tangible fixed assets due to purchase of land in Minato Mirai (Yokohama) 7.2 Billion increase in goodwill partially due to purchase of overseas subsidiaries Book value per share: 1,341.8065.2%0.9%1As of March 31st, 20062As of March 31st, 2007Copyright SEGA SAMMY HOLDINGS INC. All Rights Reserved.6
Consolidated Cash Flows( Billions)Cash Flows from OperationsFY 2006FY 200783.260.6Cash Flows from Investing-54.7-75.3Cash Flows from Financing-21.1-1.7Effect of Exchange Rate on Cash and CashEquivalents0.60.7Change in Cash and Cash Equivalents8.0-15.7151.2160.0Change in Cash and Equivalents due toconsolidation scope change0.40.5Change in Cash and Equivalents due to merger0.3 160.0144.8Cash and Equivalents at beginning of yearCash and Cash Equivalents at the end of the periodTopics【Major Factors】Cash Flow from Operations: Pretax income of 77.4 BillionCash Flow from Investments: Payment for purchase of tangible assets totaled 49.3 Billion, andinvestment purchases 33.1 BillionCash Flow from Financing: Payment of dividends 15 BillionCopyright SEGA SAMMY HOLDINGS INC. All Rights Reserved.7
Segment Results: Pachinko PachislotFY 2006FY 2007( Billions)Full Year ResultsNet SalesPachislotForecastResultsYOY .7%Peripherals, Other9.29.59.5 3.2%Operating Income99.878.571.1-28.8%Operating Margin37.5%34.7%33.6%-3.9 PointsNew rental systemintroduced fromMarch 2007*Further details on pachinko pachislot sales available on the following page.Points While the rental mix was lower than expected leading to a rise in selling price it was notenough to offset poor sales in pachinko and operating income therefore fell below plan and theresults achieved in the prior fiscal yearPachislot: Hokuto-no-Ken SE achieved sales of 340k units Reg 5 Machines Kamen Rider DX8 and Ring ni Kakero sell well after strong start by Spiderman 2 Established a large advantage going into peak demandPachinko: Results well below target of 301k units With review of pachinko development process and introduction of external reviews, expect toincrease product quality from this period forwardCopyright SEGA SAMMY HOLDINGS INC. All Rights Reserved.8
Pachinko PachislotPachislot SalesMain Pachislot TitlesFY 2006FY 2007ResultsUnit SupplyForecastResultsUnits Sold(FY 2007)Sales PeriodHokuto no Ken SE340,760 UnitsJulySpiderman 239,000 UnitsOctoberKamen Rider DX29,173 UnitsFebruaryOre no Sora25,118 UnitsPrior FYSakigake!! Otokojuku12,020 UnitsMarchRing ni Kakero118,837 UnitsMarchYOY Change6 Titles5 Titles5 Titles-1 Title312,865 Units415,000 Units426,159 Units 113,294 Units4 Titles5 Titles3 Titles-1 Title159,123 Units69,000 Units43,905 Units-115,218 Units-1 Title2 Titles 2 Titles-10,000 Units19,922 Units 19,922 Units4 Titles9 Titles7 Titles 3 Titles135,118 Units30,000 Units33,436 Units-101,682 Units14 Titles20 Titles17 Titles 3 Titles607,106 Units524,000 Units523,422 Units(26,487 Units)-83,684 UnitsTotal(Rental)TitleBrandBrandKaido OuUnitSupplyTaiho ShichauzoNovember33,436 UnitsSangokushiMarchOther*Rental developed in Sammy BrandPachinko SalesNovemberMain Pachinko Sales8 Titles12 Titles11 Titles 3 Titles288,895 Units234,000 Units108,568 Units-180,327 Units-5 Titles4 Titles 4 Titles-67,000 Units24,413 Units 24,413 Units8 Titles17 Titles15 Titles 7 Titles288,895 Units301,000 Units132,981 Units-155,914 UnitsTotalBrandTitleUntits Sold(FY 2007)Sales PeriodCR Salaryman Kintaro28,133 UnitsNovemberCR Hokuto no Ken STV23,242 UnitsJulyCR Freddy vs Jason19,897 UnitsMayCR Gachaman10,453 UnitsSeptemberCR Mangetsu no Yoru ni Shoten Shitai12,439 UnitsJuneCR 1・2 no Sanshiro4,739 UnitsAugustCopyright SEGA SAMMY HOLDINGS INC. All Rights Reserved.9
Segment Results: Amusement Machines( Billions)FY 2006FY 2007ResultsForecastResultsYOY Change71.584.075.4 5.5%Domestic63.369.565.7 3.8%Overseas8.114.59.7 19.8%12.112.511.6-4.1%17.0%14.8%15.4%-1.6 PointsNet SalesOperating ProfitOperating Margin*Further breakdown on the Amusement Machines segment provided on the following pagePoints Results generally firm, sales and operating profit similar to prior year Strong shipments of “Amigyo”, “Sangokushi Taisen 2” card sales, “Initial DARCADE STAGE 4” All. Net P-ras (Billing model based on machine use)Analyze results thus far to determine strategy going forward In overseas markets results were short of plan due to a lack titlesCopyright SEGA SAMMY HOLDINGS INC. All Rights Reserved.10
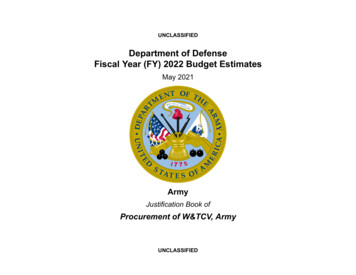
Amusement MachinesMain Titles(FY 2007)ProductSales ResultsSangokushi Taisen 2Cards: 69,821 CartonsInitial D ARCADE STAGE 4Satellite: 3,056 UnitsAmigyoStar Horse 2 2006Virtua Fighter 5Body: 640 UnitsBody: 100 UnitsSatellite: 2,055 UnitsDX Set: 696 UnitsCopyright SEGA SAMMY HOLDINGS INC. All Rights Reserved.11
Segment Results: Amusement Facilities( Billions)Net SalesFY 2007FY 2006ForecastFull Year ResultsFull Year ResultsYOY Change106.2125.0103.8-2.3%6.18.79.8 60.7%9.212.00.1-98.9%Operating Margin8.7%9.6%0.1%-8.6 PointsDepreciation17.118.118.0 0.9Cap-ex24.520.418.1-6.4(Overseas)Operating Profit*Further details on facilities, business environment and kids cards available on the following page.*TMS Entertainment fully consolidated from 2H FY 2006Points Full year profitability well below prior year Negative same store comps from 2nd quarter forward Kids card sales below plan and prior year results Impact of a highly competitive and saturated marketCopyright SEGA SAMMY HOLDINGS INC. All Rights Reserved.12
Amusement FacilitiesFacilities DataFY 2006*FY 318Closed521431 3.3% 3.4%-4.2%Same store comps*TMS fully consolidated from 2H FY 2006Kids Card DataFY 2006ResultsTotalsFY 2007ForecastResultsIncrease in Units16,200 Units9,000 Units2,400 UnitsInstalled Units Period End27,000 Units36,000 Units29,400 UnitsCard Sales in Period347,500,000357,000,000216,000,000Accumulated Card Sales515,000,000872,000,000731,000,000Copyright SEGA SAMMY HOLDINGS INC. All Rights Reserved.13
Segment Results: Consumer( Billions)Net SalesFY 2006FY 2007Full Year ResultsForecastFull Year ResultsYOY Change90.3123.0119.5 32.3%Ent Software56.277.976.1 35.4%Network/Other34.145.143.4 27.3%Operating Profit1.92.51.7-10.5%Operating Margin2.1%2.0%1.4%-0.7 PointsR&D Expense17.826.426.6 8.8Breakout*Further details on software titles and units available on the following page.Points With strong results in the US and contribution from recently acquired companies,entertainment software as a whole was profitable and in-line with plansJapan: LOVE AND BERRY sells 1.12 Million unitsRyu ga Gotoku series (1&2) exceeds the million markUS:Sonic the Hedgehog for XBOX360 and PS3, Sonic Mega Collection/Plus andcatalogue titles sell stronglyEurope: Football manager 2007 and Medieval II: Total War achieve strong sales.Certain titles moved to the March ’08 fiscal year. Services in the network businesses delayed until the March 2008 period, results wellbelow planCopyright SEGA SAMMY HOLDINGS INC. All Rights Reserved.14
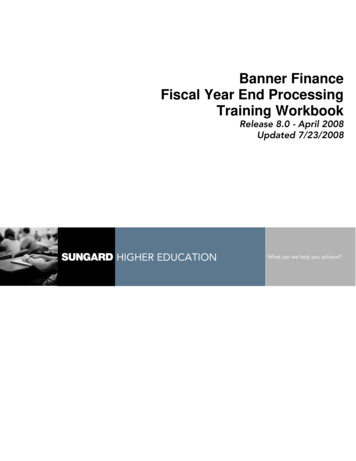
ConsumerSales Results for Main TitlesEntertainment Software SalesFY 2006RegionBreakout# TitlesFY 2007Sales k’sSales k’s# ,060447,18012216,40014021,270TotalFY 2006Platform# TitlesTotalSales k’s# TitlesSales -141,640Wii--71,420181,820Includes ogueJapanFY 2007PS2Xbox360BreakoutRegionUSEuropePlatformFY 2007 Major TitlesSales k’s1,120NDSLOVE AND BERRYPS2Ryu ga Gotoku 2600PS2 PlayStation 2 the Best Ryu ga Gotoku510PS2/PSP/NDSJissen Pachislot HisshohoHokuto no Ken SE380NDS/PSP/PS2Puyo Puyo250PS2/XB/GCSonic Mega Collection/Plus570PS2/XB/GC/PCSonic Riders560X360/PS3Sonic The Hedgehog530PS2/XB/GCShadow The Hedgehog470PS2/XB/GCSonic Heroes420PC/X360/PSPFootball Manager 2007(*1)840PS3/X360/PSP/PCVirtua Tennis 3610PCMedieval II : Total War(*2)500NDSSonic Rush360X360/PS3Sonic The Hedgehog340Titles from acquired studios:(*1) Sports Interactive Ltd. (*2)Creative Assembly Ltd.Copyright SEGA SAMMY HOLDINGS INC. All Rights Reserved.15
Listed SubsidiariesCopyright SEGA SAMMY HOLDINGS INC. All Rights Reserved.16
Listed Subsidiaries Results(1)FY 2006FY 2007( Billions)ResultsNet FY 2006YOYChange8.2710.1010.62 28.5%2.162.552.52 16.8%26.1%25.2%23.7% -2.4 PointsSammy Networks Increase in sales and profits Services for PCs In addition to Pachislot games also introduced 7 pachinkotitles. 16 contributing companies, 38 different contents Overseas net sales falls Negative impact from strengthening of regulations in China M&A By making Realus and Media-Trust subsidiaries increasedrevenue in the point media and solutions businessFY 2007( Billions)ResultsNet YOYChange14.4014.6015.20 5.5%1.050.340.33-68.5%7.2%8.4%2.1% -5.1 PointsSega Toys Increased sales reduced operating income Underperformance in NEW content business①Falling sales of domestic boys and girls toys②Reduction in inventory valuation ( 280 Million) Strong overseas sales (Overseas contribution 20.1% 32.6%) Successful introduction of Grand Pianist Homestar becomes a sales staple Anpanman continues to sell wellCopyright SEGA SAMMY HOLDINGS INC. All Rights Reserved.17
Listed Subsidiaries Results (2)FY 2006( Billions)ResultsNet SalesOperatingIncomeOperatingMarginFY 2006FY 681.761.60-4.8%10.4%11.2%10.3%-0.1 PointTMS Entertainment Animation Business: Increased sales and profits While new productions fell, licensed business experiencedstrong growth leading to a large increase in profits Created group related content “Pururun! Shizukuchan”and “Bakugan” Amusement Business: Decreased sales and profits
Strong shipments of “Amigyo”, “Sangokushi Taisen 2” card sales, “Initial D ARCADE STAGE 4” All. Net P-ras (Billing model based on machine use) Analyze results thus far to determine strategy going forward In overseas markets results were short of plan due to a lack titles *Further breakdown on the Amusement Machines segment provided on the following page FY 2006 FY 2007 ( Billions .