Transcription
Eur J Forest Res (2013) 132:151–163DOI 10.1007/s10342-012-0664-zORIGINAL PAPERGreater abundance of Fagus sylvatica in coniferous floodprotection forests due to climate change: impact of modified rootdensities on infiltrationBenjamin Lange Peter F. GermannPeter Lüscher Received: 9 March 2012 / Revised: 21 August 2012 / Accepted: 2 October 2012 / Published online: 4 November 2012Ó The Author(s) 2012. This article is published with open access at Springerlink.comAbstract Climate change is expected to modify thespatial distributions of zonal forest communities and thus,their species compositions. The aim of this paper was tostudy the impact of higher abundance of beech on waterstorage capacity in current coniferous flood protectionforests due to varying root densities of the main tree species. Two forest communities in the northern pre-Alps inSwitzerland with similar soil properties but varying inspecies composition were investigated (space-for-timesubstitution). It was assumed that the Vaccinio myrtilliiAbieti-Piceetum (site A) will be replaced by a LuzuloAbieti-Fagetum (site B). We irrigated 16 hydromorphicsoils (1 m2, 70 mm/h, three consecutive irrigations) at siteA and 10 at site B and recorded water-content variationswith time domain—and frequency domain reflectometry.Roots were extracted from soil cores taken from the positions where the water-content probes were inserted, anddigitally measured. Infiltration capacity xI was mainlylimited to the upper soil at site A but was approximatelyconstant down to 0.7 m depth at site B. Between 0.3 and1.0 m soil depth, root densities at site B exceeded those atsite A. Root density was the main predictor for xI(R2 0.57) at site A as shown by a multiple linearCommunicated by C. Ammer.B. Lange P. LüscherSwiss Federal Institute for Forest, Snow and Landscape ResearchWSL, Zürcherstrasse 111, 8903 Birmensdorf, SwitzerlandB. Lange (&)In der Wässeri 37, 8047 Zürich, Switzerlande-mail: b.lange@gmx.chP. F. GermannDepartment of Geography, University of Bern, Hallerstrasse 12,3012 Bern, Switzerlandregression analysis. Assuming that the root density in thecurrent coniferous forest (A) will increase to that of thebeech stand (B) due to the greater abundance of beech, thewater storage capacity will increase by 9.2 mm in consequence of the expected forest transformation.Keywords Climate change Flood protection forests Water storage capacity Beech Spruce Forest transformationIntroductionClimate change is expected to increase the annual meantemperature in the northern part of Switzerland by approximately 2 C by 2050 compared with 1990 (OcCC/ProClim(ed.) 2007). As a consequence, the spatial distribution ofzonal forest communities and thus the species compositionsof these forests will be modified by temperature increase.Approximately 36 % of the total forested area in Switzerland has an important protection function (Brändli2010). Flood protection forests are likely to become evenmore necessary since floods are expected to occur morefrequently due to climate change (OcCC/ProClim-(ed.)2007). Such forests are in the catchment areas of the largeSwiss rivers and are located in the montane and subalpinebelts. Simulations indicate that the currently dominantPiceo-Abietion community in the northern pre-Alps inSwitzerland will be replaced by Abieti-Fagion (Brzezieckiet al. 1995). Thus, the abundance of Fagus sylvatica willincrease at the expense of Picea abies and, to a lesserextent, of Abies alba. This forest transformation mayinfluence the efficiency of these flood protection forests.Species change in forests impacts their hydrologicalproperties directly by modifying their transpiration and123
152interception rates. The interception rates of deciduous treesvary during the course of the year, while those of evergreenconifers remain nearly constant throughout all seasons(Christiansen et al. 2006). Furthermore, the transpirationrates of conifers and deciduous trees differ. Peck andMayer (1996) analysed several studies about transpirationrates of trees and concluded that beech transpires onaverage 27 % more than Norway spruce, even though thetranspiration of beech is mainly limited to the growingseason. Hence, tree species significantly influence the soilwater content and, consequently, how much water the soilcan potentially store.The transformation of forest composition also affectssoil hydrological characteristics indirectly by modifyingsoil properties. The thickness of the forest floor layerdeclined during a Pinus sylvestris to F. sylvatica transformation in Germany, but the humus topsoil increased (Benset al. 2007). Organic layers have high water storagecapacities (Guevara-Escobar et al. 2007), but may alsoreduce infiltration capacity as they are water repellent (e.g.Doerr et al. 2000). Moreover, changes in tree speciesimpact the rhizosphere since different species have different root systems and root densities, resulting in varyingspatial patterns of water uptake, and thus drying out of thesoils (Schwärzel et al. 2009).Roots are important generators of preferential flowpaths, which may improve the forest soil’s infiltrationcapacity substantially (Beven and Germann 1982). Noguchi et al. (1999) demonstrated that 70 % of the macroporesin the topsoil and 55 % in the subsoil in a Japanese forestwere related to roots. Lange et al. (2009, 2010) comparedthe root distributions in hydromorphic soils with theporosity that effectively carried preferential flow, andconcluded that root density was related to infiltrationcapacity. Pores generated by woody roots can persist fordecades, as has been shown in Denmark and Switzerland(Jorgensen et al. 2002; Hagedorn and Bundt 2002). Furthermore, saturated hydraulic conductivity ks can beimproved by roots since Li and Ghodrati (1994) found thatks was five to six times higher in samples with root channels than in those without roots. Thus, roots seem to be oneof the most important generators of well-connected poresin forest soils. Periodical anaerobic conditions in soils limitthe root growth of certain species. Lehnardt and Brechtel(1980) found the roots of adult beech stands penetrateddown to 0.6 m, whereas the maximum root depth of sprucewas only 0.4 m in comparable hydromorphic soils, indicating that spruce is more liable to oxygen deficiency in therhizosphere.Pores generated by roots are of particular importance forinfiltration in forest stands growing on poorly drainableforest soils (Lüscher and Zürcher 2003; Lange et al. 2009).A species shift in such stands may influence the soil’s123Eur J Forest Res (2013) 132:151–163infiltration capacity and, hence, the flood protective function. Even though it is widely accepted that roots areimportant for infiltration and that climate change will resultin a forest transformation, the significance of these processes for flood protection has, as far as we know, neverbeen explored. Thus, the main objective of this study wasto investigate how an increasing abundance of beech inconiferous flood protection forest stands on hydromorphicsoils in Switzerland will affect infiltration and waterretention due to the resulting modified root densities anddistributions. In particular, we aimed to:(i)compare the infiltration characteristics of two forestsites with comparable soil properties but varyingabundances of beech and spruce;(ii) evaluate the relevance of roots and other soilproperties for infiltration characteristics and(iii) model the modification of water storage capacityresulting from the greater abundance of beech inconiferous flood protection forests.Materials and methodsSite and soil descriptionThe experiments were conducted in the Gantrisch region inthe Swiss pre-Alps approximately 30 km south of Berne ataltitudes between 880 and 1,000 m a.s.l. Annual precipitation averages 1,700 mm and the mean annual temperature is 5.9 C at 1,160 m a.s.l. (Zimmermann et al. 2006).The study sites are located in the Flysch zone and featuresmainly marled clays interlaced with stony or sandy layers.A space-for-time substitution was applied to evaluate thepotential effects of greater abundance of beech in the floodprotection forest, currently composed of spruce and fir.Two adult forest sites with comparable soil properties butvarying in forest composition and altitude were investigated. The distance between the sites is approximately700 m and the difference in the altitude &120 m. Site Adefines the current forest stand and is classified as a Vaccinio myrtillii-Abieti-Piceetum (Ellenberg and Klötzli1972), with Norway spruce (P. abies (L.) Karst.) as themost abundant species. Silver fir (A. alba Miller) andEuropean beech (F. sylvatica L.) are secondary.The prevailing soil types are Gleys, cambic Gleys,gleyic and stagnic Cambisols and Cambisols, according toFAO-UNESCO (1988). Beneath depths of 0.03–0.25 m,hydromorphic attributes such as iron and manganese concretions and mottles are found. The physical and chemicalproperties of the soil were determined from dried samples(48 h, 105 C for bulk density and 60 C for pH and texture). Three cylinders per horizon, with a volume of
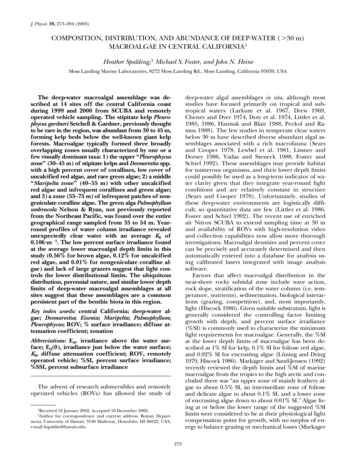
Eur J Forest Res (2013) 132:151–1631531,000 cm3 and a height of 0.1 m, were collected to determine bulk density. pH was determined in a CaCl2 solutionand the pipette method was applied for particle-size distribution separation. Considering all horizons investigatedat site A, the percentage of sand was 18.6–71.6 %, siltcontent was 12.7–43.5 % and clay varied between 9.9 and42.0 %. Bulk density was between 0.19 and 1.19 Mg m-3in topsoils and 0.75 and 1.60 Mg m-3 in subsoils. Theslopes of the investigated areas did not exceed 15 .Climate change will enhance the abundance of beech inwhat are currently mainly coniferous forests in the montanebelt (Brzeziecki et al. 1995). Thus, the second area investigated (site B) was a Luzulo-Abieti-Fagetum (Ellenberg andKlötzli 1972), which is what will presumably replace thecurrent Vaccinio myrtillii-Abieti-Piceetum with globalwarming. This stand is characterised by more abundantEuropean beech, while silver fir and especially Norway spruceare less dominant. Figure 1 shows a map of the investigatedareas. The prevailing soil types are Gleys according to FAOUNESCO (1988), and hydromorphic attributes are foundbeneath depths of 0.05–0.14 m. Soil texture varied between17.5 and 73.1 % sand, 16.4 and 48.6 % silt and 8.6 and 34.6 %clay. Bulk density was 0.65–1.00 Mg m-3 in topsoils and0.79–1.60 Mg m-3 in subsoils. The slopes of the areasinvestigated were less than 7 .Table 1 summarises the characteristics of the study sitesand Fig. 2 compares generalised soil profiles and averagethicknesses of classes of soil genetic horizons. Both sitesare characterised by an organic layer of 0.04–0.05 m abovenon-hydromorphic horizons with average thicknessesbetween 0.12 and 0.13 m, following by a layer with onlyfew hydromorphic features up to approximately 0.3 m.Site BSite AFig. 1 Map of the investigated areas. Reproduced by permission ofswisstopo (BA12053)Table 1 Characteristics of the study sitesStudy siteABAltitude(m) a.s.l.&1,000&880Slope \15\7Soil typesGleys, cambic Gleys, gleyic orstagnic Cambisols, CambisolsGleysForestcommunityVaccinio myrtillii-Abieti-PiceetumLuzulo-AbietiFagetumMain treespeciesNorway spruce, silver firSilver fir,EuropeanbeechNumber ofirrigatedplots1610Below, periodically water saturated horizons dominate.The soil textures at sites A and B were comparable, butvaried considerably within the sites (Fig. 3). The bulkdensity was equal at both study sites in the top- and subsoils, while pH tended to be higher at site A (Fig. 4).Sprinkling experimentsWe conducted sprinkling experiments to measure variationsin the volumetric water content h(Z, t) as a function of time(t) at various depths (Z). At site A, the volumetric watercontent was measured with TDR equipment (time domainreflectometry). The wave guides consisted of two pairedstainless steel rods, 0.15 m long, 30 mm apart and 5 mm indiameter. A 50-X coax cable connected the rods to an SDMX50 coaxial multiplexer controlled by a CR10X micro-logger.A Campbell TDR100 device (Campbell Scientific, Logan,USA) generated the electrical pulses and received the signals. The transfer function of Roth et al. (1990) was appliedto calculate the volumetric water content. At site B, soilmoisture was recorded with FDR equipment (frequencydomain reflectometry) from Decagon Device (Pullman,USA). We used 10HS soil moisture sensors (0.1 m long) andcollected data with an Em50 data logger. Dielectric permittivity was converted to volumetric water content by applyingthe transfer function of Topp et al. (1980). Variations inwater content were recorded at 60 s intervals at both sites.The wave guides were installed horizontally from a trenchinto each soil genetic horizon according to the soil profiledescriptions. Thus, depth of water-content probes variedbetween the investigated plots. Each soil profile was equipped with five probes, where a soil was composed of less thanfive horizons, the thickest layer was equipped with two waveguides one below the other.The sprinkler device consisted of an aluminium plate(1 m 9 1 m) perforated with 100 holes in a123
154Eur J Forest Res (2013) 132:151–163Fig. 2 Exemplary soil profiles and average depths of soil horizons atsites A and B0100Site ASite BAverage Site AAverage Site B25C la5075%]50t[Sily[%]75250.1 m 9 0.1 m square pattern. The holes were attached toPVC tubes (inner diameters 2 mm) connected to a waterreservoir with a constant water table. The plate was movedby a motor 50 mm back and forth in both horizontaldimensions during the irrigation experiments so that it tookapproximately 1,800 s until a tube returned to exactly thesame position. The intensity of irrigation was 70 mm h-1and lasted 1 h. No visible surface run-off occurred duringthe experiments. A waterproof tent (3 m 9 3 m) coveredthe set-up and the soil profiles during the experiments.At each plot, we conducted three consecutive irrigationexperiments in 23 h intervals. The first and second irrigations primarily served to saturate the finer pores in the soilwhere capillarity may be dominant. As shown by Langeet al. (2011) at the same location, water flow released bythe third artificial rainfall event was mainly restricted tolarger, fast-draining pores, where capillarity can beneglected. Thus, the principal focus of our interpretationwas on the results of the third irrigation, where the poresize spectra of pores carrying mobile water were comparable in all plots and the influence of the varying antecedent soil moisture level was negligible.Overall, we recorded 371 time series of water-contentvariations from 16 plots at site A and 10 plots at site B. Theplots were distributed over an area of approximately10,000 m2 at site A and 2,000 m2 at site B and the distances of the irrigated areas to the closest tree was about1 m (with the exceptions of three plots at site A where thedistance to the stem was about 3.5 m). The depths of theprobes were between 0.04 and 0.97 m. We conducted theinfiltration experiments in fall 2006 and summer and fall2007 (site A), and in summer and fall 2010 (site B).Root measurements10002507550100Sand [%]Fig. 3 Texture of all soil horizons at sites A and BA topsoilB topsoilA subsoilB subsoilSoil cores for the analyses of the root length distributionwere taken subsequent to irrigation with a HUMAX soilcorer (diameter 0.1 m) to depths between 0.5 and 1 m, atthe same positions as those where the TDR and FDRprobes were installed. The cores consisted of 0.25 m longsegments in plastic tubes in which the soil was leftundisturbed. The roots were sorted out and washed in a1-mm sieve with tap water. All root fragments (woody andherbal roots) were collected and stored at 4 C for no morethan 12 weeks. Root length (cm) was measured with winRHIZO (V4.1c; Regent Instruments Inc., Quebec, Canada)for each morphological horizon separately.Statistical analyses0.00.51.01.52.0-3Bulk density [Mg m ]34567pHFig. 4 Bulk density and pH (CaCl2) at sites A and B, shown fortopsoil and subsoil separately123To test distributions for different means, a rank-based testwas applied (Mann–Whitney U test) since some data werenot normally distributed. Statistical analyses were
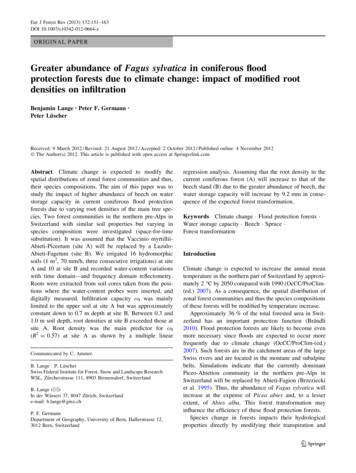
Eur J Forest Res (2013) 132:151–163155conducted with SYSTAT (V10; Cranes Software International, Bangalore, India).xI ¼ L Fwhere F is the water films’ average thickness. According toGermann and al Hagrey (2008), the wcw’s average wettingfront velocity from the soil surface to depth Z [m], vW[m s-1] is given by:TheoryInfiltration was analysed according to a Stokes-flowapproach. A steady water input during the period Ts [s],beginning at t 0 [s], to the soil surface initiates a watercontent wave (wcw, see Fig. 5a). The balance betweengravity g as driving force and kinematic viscosity g, whichexpresses momentum dissipation, is what determines flow.Capillarity is neglected. The wcw consists of thin waterfilms moving between two neighbouring layers (solid orgaseous phase). A water film is defined with its thickness f[m], its length of contact K [m] in the horizontal plane andthe vertical position of the wetting front zw(t) [m] at time t(Fig. 6). A water film’s specific contact length l [m-1] isthe contact area at time t between mobile water and thesolid soil phase per soil volume, which corresponds to thelength of contact K per horizontal two-dimensional extentof the soil A [m2]:l¼K zw ðtÞ K¼A zw ðtÞ AvW ¼L¼ð6Þ(b)3-3xIFSee Germann et al. (2007) for further details. Stokes flowis amenable to a certain range in the soil water contentbetween Darcy’s saturated flow and a lower degree ofsaturation, where Richards’ capillary equilibriumrequirement remains valid. Thus, the approach used islimited to a soil moisture range where mainly larger, fastdraining pores are involved in water flow and capillaryforces can be ignored. According to Hincapie and Germann (2009), a rainfall intensity of 5 mm h-1 maypresent the lower limit for producing significant watercontent waves. The volume flux density of our irrigationexperiments was 70 mm h-1, and most likely resulted inwcws amenable to Stokes flow.and its mobile water content per soil volume, which is theamplitude of infiltration xI [m3 m-3], is given by:Volumetric soil moisture [m m ]ð5ÞContact length L can be determined by solving Eq. (3) forL:AtDð4Þ Zg 0:5F¼ 3tW gwhere l describes porosity which effectively carries mobilewater. Single water streaks are too tiny to be measured withordinarily applied instrumentation such as TDR equipment.Superposition of all films adds up to the entire wcw, whichis measurable in situ. An entire wcw’s contact length L[m-1] per area A is:XL¼lð2ÞVolumetric water contentFitted increasing limbg 2ZF ¼3gtWwhere g [9.81 m s-2] is the acceleration due to gravity, g[10-6 m2 s-1] is the kinematic viscosity and tW [s] is thearrival time of the wetting front. Rearranging Eq. (4) leadsto F:ð1Þ(a)ð3Þθ 2θ inθF020000 40000 60000 80000Time since irrigation began [s]Fig. 5 a Definitions of parameters and variables of water-contentwaves (wcw). b Fitted increasing limb of a wcw. hin initial volumetricwater content, hmax maximum volumetric water content, hF volumetric water content 75,000 s after the irrigation began, xI hmax - hin,ωF0.440.42-5000tW500100015002000Time since irrigation began [s]amplitude of infiltration, xD hmax - hF, amplitude of drainage, xFhF - hin, amount of non-draining water, tw arrival time of wettingfront, tE end of irrigation at t 3,600 s, tD arrival time of thedrainage front123
156Analyses of wcwsThe key points of a wcw, initial (hin) and maximal (hmax)water content were derived from the mean of ten watercontent recordings between the beginning of the irrigationt0 and t0 - 540 [s] (hin) and between the arrival time of thedrainage front tD and tD - 540 [s] (hmax). The final watercontent hF refe
mately 2 C by 2050 compared with 1990 (OcCC/ProClim-(ed.) 2007). As a consequence, the spatial distribution of zonal forest communities and thus the species compositions of these forests will be modified by temperature increase. Approximately 36 % of the total forested area in Swit-zerland has an important protection function (Bra ndli 2010).