Transcription
Visualizing Big Network Traffic Data usingFrequent Pattern Mining and HypergraphsEduard Glatz · Stelios Mavromatidis ·Bernhard Ager · XenofontasDimitropoulosReceived: 30 August 2012 / Accepted: 8 November 2012AbstractVisualizing communication logs, like NetFlow records, is extremely usefulfor numerous tasks that need to analyze network traffic traces, like networkplanning, performance monitoring, and troubleshooting. Communication logs,however, can be massive, which necessitates designing effective visualizationtechniques for large data sets. To address this problem, we introduce a novelnetwork traffic visualization scheme based on the key ideas of 1) exploitingfrequent itemset mining (FIM) to visualize a succinct set of interesting trafficpatterns extracted from large traces of communication logs; and 2) visualizing extracted patterns as hypergraphs that clearly display multi-attributeassociations. We demonstrate case studies that support the utility of our visualization scheme and show that it enables the visualization of substantiallylarger data sets than existing network traffic visualization schemes based onparallel-coordinate plots or graphs. For example, we show that our scheme caneasily visualize the patterns of more than 41 million NetFlow records.1 IntroductionComputer networks, in contrast to other more established disciplines (e.g. programming languages), are largely lacking efficient techniques to debug networkproblems. Because of this, networks are kept working by masters of complexity,E. Glatz, B. Ager, X. DimitropoulosETH Zurich, Gloriastrasse 35, 8092, Switzerland E-mail: eglatz,bager,fontas@tik.ee.ethz.chS. MavromatidisOpen University of Cyprus, PO Box 12794, 2252, Latsia Cyprus E-mail: steliosmavromatidis@hotmail.comFirst IMC Workshop on Internet Visualization (WIV 2012), November 13, 2012, Boston,Massachusetts, USA.
2Eduard Glatz et al.who need to know in detail the infrastructure and configuration of a network,extract useful information from diverse and massive monitoring data, and iteratively test and verify their assumptions about the underlying cause of aproblem, while they are steered solely by their intuition. Effective visualization techniques for network monitoring data can greatly facilitate slow manualdata exploration processes by enabling to absorb large amounts of data quicklyas a good picture is worth a thousand words. Specifically, visualizing networkmonitoring data is very useful for identifying changes in traffic patterns, troubleshooting network performance problems, detecting security incidents, andplanning network growth.A key challenge in visualizing network monitoring data, like traffic traces, istheir massive volume. For example, a NetFlow collector in ETH Zurich receivedin 2011 on average 4.55 billion flow records per day from a Swiss nationalbackbone network. In order to effectively explore large volumes of networkdata, effective visualization techniques that reduce the cognitive burden of theanalyst are essential.In this work we introduce a general scheme for visualizing communicationlogs, like NetFlow records, based on the novel ideas of 1) exploiting FIM tovisualize a succinct set of interesting traffic patterns extracted from large tracesof communication logs; and 2) visualizing extracted patterns as hypergraphsthat clearly display multi-attribute associations.FIM is an extensively-studied data mining problem that mines frequentpatterns from input transactions. In our context, a transaction models a communication, which includes a number of logged or derived attributes, like theIP addresses, port numbers, and AS numbers of a NetFlow connection record.A frequent pattern is a set, called itemset, of attributes that occur in a largenumber of transactions. For example, an extracted frequent itemset could indicate that a very large number of flow records share a specific source IP address, destination port, and flow size (which is a pattern that results from portscanning attacks). Frequent itemsets identify multi-dimensional heavy hitters,which have been shown to be very useful for profiling network traffic [10] andfor identifying interesting events [5], like scanning and DDoS attacks.We visualize extracted patterns as hypergraphs, which are a generalizationof classical graphs in which edges can connect to an arbitrary number of vertices. This is very useful because it enables the visualization of multi-attributeassociations. In contrast, edges in classical graphs as used in existing trafficvisualization schemes can only visualize associations between two attributes.Our scheme is general because it can visualize arbitrary types of transactions and incorporate arbitrary attributes, like performance metrics (packetloss, latency, etc.) or security indicators (severity and type of IDS alerts) of acommunication. A frequent itemset in this context could indicate that a largenumber of traffic flows are routed through a specific uplink provider towardsa certain port number and experience poor performance. Discovering such interesting associations among communication attributes is a key concept at theheart of network measurement research. Our visualization scheme can greatlyhelp in discovering such associations.
Title Suppressed Due to Excessive Length3The remaining of our paper is structured as follows. In the next section wediscuss related work and then in Section 3 we describe in detail our visualization scheme and software. In Section 4 we show how our scheme complementsexisting approaches by enabling to visualize larger datasets. In Section 5 wepresent case studies showing how our visualization enables us to easily pinpointinteresting traffic patterns. Finally, we conclude our paper in Section 6.2 Related WorkGraphs have been extensively used to visualize network traffic data. In particular, a commonly-used visualization approach uses graphs to display communicating entities. These graphs are used in traffic visualization tools, likeVIAssist [7], NFlowVis [11], OverFlow [13], TVi [4] and NVisionIP [22], andare also known as traffic dispersion or activity graphs (TDG or TAG) [18, 19].In this approach edges denote communications and vertices denote end-hosts,subnets, or organizations.BLINC [21] and HAPviewer [14] use multipartite graphs to visualize associations between source and destination IP addresses and port numbers usedby individual applications or hosts, respectively. In both schemes, vertices denote IP addresses, port numbers, or the layer-4 protocol and edges indicateassociations between adjacent vertices. Two vertices are linked if they appearin the same traffic connection record.A slightly different approach to display similar information is to use parallelcoordinate plots (an example plot is given in Figure 1). Instead of a multipartite graph, a parallel-coordinate system is used in which each vertical axisrepresents a different attribute (in other words each vertical axis of a parallelcoordinate plot corresponds to a partition of a multipartite graph) and linesvisualize associations between two coordinates. Parallel-coordinate plots areused by NfSight [2], VisFlowConnect [29], and PCAV [1] to visualize networktraffic.A main limitation of previous approaches based on graphs or parallelcoordinate plots is that edges/lines indicate associations between two linkedattributes, but they do not visualize multi-attribute associations. In our visualization scheme, we address this problem by using two types of vertices. Squaresdenote communication attributes, e.g., IP addresses, port numbers, etc., whilecircles illustrate multi-attribute associations. This enables the visualization ofmuch more complex association than possible with existing schemes. In addition, our scheme introduces the novel idea of using FIM to mine and visualizethe frequent patterns of arbitrarily large data-sets.Besides, a number of additional network traffic visualization tools exist, including Nfsen [16], ntop [23], FlowScan [24], NetPY [6], FloVis [27], NFlowVis [11],NVisionIP [22], and Fluxoscope [25]. These tools explore alternative visualization techniques of varying complexity, like histograms, timeseries plots,piecharts, scatterplots, heatmaps, heavy hitter lists, hierarchical heavy hittertrees, treemaps, and hierarchical edge bundles.
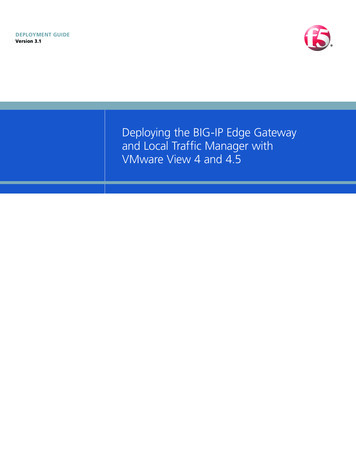
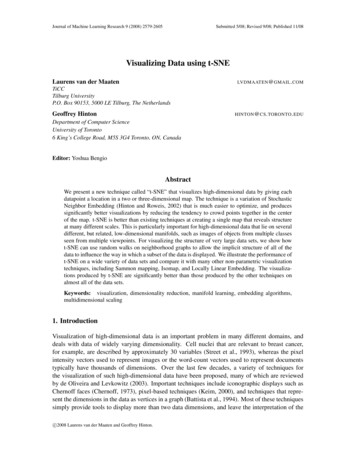
4Eduard Glatz et al.AutoFocus [10], in particular, provides a list of multi-dimensional hierarchical heavy hitters and a simple timeseries visualization of network traffic.Our work introduces a novel scheme that can be used to visualize the list ofmulti-dimensional heavy hitters produced by AutoFocus. Compared to the approach used in [10] to find multi-dimensional heavy hitters, FIM scales betterto higher dimensional data. For example, in Figure 3 we show that by exploiting efficient FIM software we can mine and visualize more than one millioninput records with 12 attributes (dimensions) each in less than 50 seconds.In the data mining community, a number of visualization approaches havebeen developed to visualize frequent itemsets. Our work has been inspired bythe visualization scheme of the arulesViz package [17] of the R project, whichis based on the techniques of [9] for visualizing association rules. To the bestour knowledge, our work is the first to exploit both FIM and hypergraphs tovisualize network traffic data.3 Visualization SchemeOur scheme takes as input communication logs, where each communicationtransaction is associated with a number of attributes. We first apply frequentitemset mining, as described in Section 3.1, to mine a set of frequent itemsets. Then, we visualize the extracted frequent itemsets using hypergraphs toportray the associations each itemset encodes (cf. Section 3.2).3.1 Frequent Itemset MiningWe first provide background information on FIM. FIM is a classical and oneof the most extensively studied data mining problems. It falls into the category of frequent pattern mining problems, which mine for different types ofpatterns like itemsets, sequences or sub-graphs. It is also the core componentof association rule mining, which first applies FIM to input transactions andthen uses the extracted frequent itemsets to build association rules.More formally, let I {i1 , ., in } be a set of n items and D {t1 , ., tm }be a set of m transactions. Each transaction contains a subset of the itemsin I. A frequent itemset is a subset of the items in I that is also a subset of atleast s transactions in D. In the classical context of market basket analysis,I is the set of all products in a market, ti is the set of products purchasedin a single transaction, and a frequent itemset is a set of products that arefrequently purchased together. In our context, we use transactions to modelcommunications, like NetFlow records, and items to model communicationattributes, like IP addresses.Standard FIM can produce a large number of redundant item-sets. This isbecause if an itemset of length l is frequent, then by definition all its 2l 1subsets are also frequent. This is a well-known property of FIM and has led totechniques that supress such redundant itemsets. We use maximal FIM, which
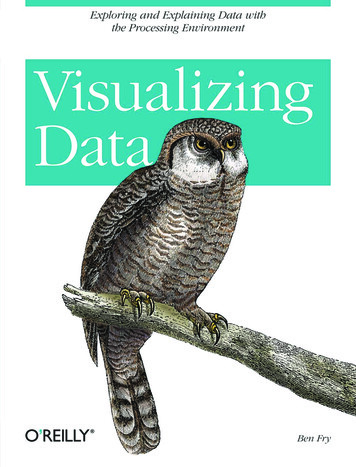
Title Suppressed Due to Excessive Length5supresses all frequent itemsets that are subset of another frequent itemset. Inother words, more specific frequent itemsets are prefered, while least specificitemsets are discarded.The threshold s determines the number of frequent itemsets. Alternatively,one can specify the number of desired itemsets in terms of a top-k parameterusing top-k FIM algorithms [28]. In our experiments, we have found usingNetFlow traces from different networks that when each input transaction corresponds to the standard NetFlow five-tuple, then a threshold value in therange between 1% and 10% of the total number of input transactions resultsin a few dozen of frequent itemsets, which can be effectively visualized. For theextended input transactions with 12 attributes we use in Section 5, a thresholdof 5% results in approximately 7 to 12 frequent itemsets.The FIM literature has produced many techniques for dealing with different types of attributes, including hierarchical and numerical attributes. Inthis context, generalized FIM [26], which deals with hierarchical attributes, isparticularly useful since it enables us to take into account the prefix structureof IP addresses. This way we can identify frequent itemsets that involve forexample a prefix block, although no single IP address within the block is partof a frequent item-set.3.2 VisualizationTo reflect the multi-attribute associations encoded in frequent item-sets, weuse hypergraphs. A hypergraph is a generalization of a classical graph in whichedges can connect to multiple vertices. We visualize a hypergraph using twotypes of vertices as shown in the example of Figure 2. Squares vertices denotecommunication attributes, e.g., IP addresses, port numbers, AS numbers, andcircles denote frequent itemsets. Edges connect a frequent itemset to its attributes and enable the visualization of multi-attribute associations. In contrast, previous network traffic visualization schemes use graphs to illustrateassociations only between two attributes. Our approach visualizes both howfrequent itemsets are composed of different items and which items they share.Therefore, we can clearly visualize associations between different itemsets andbuild a more succint representation of the itemsets than the plain approachof listing itemsets in a tabular. Arrows point towards the attributes that arelinked to a frequent item-set.In addition, we vary the size of the circles based on the volume of traffic itcaptures and display this volume as an absolute and relative number withina circle. This way we highlight and can easily identify network traffic heavyhitters. The size of an itemset can be measured in terms of flows, packets, orbytes. We measure it by default in terms of flows.Next, we describe the modular architecture of our software and point outthe generality of our scheme. Our software creates graphs from transactiondata in five distinct steps. First, the data is prepared as a text file to meetthe expected input format of the mining software. For the case studies pre-
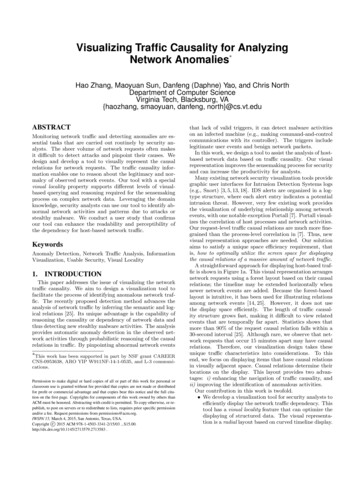
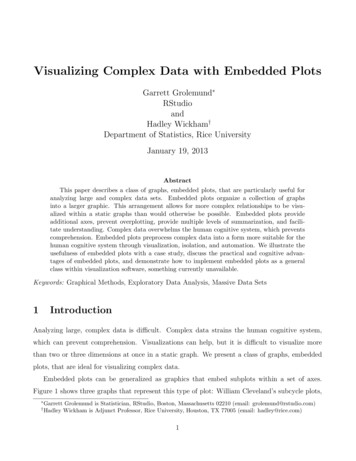
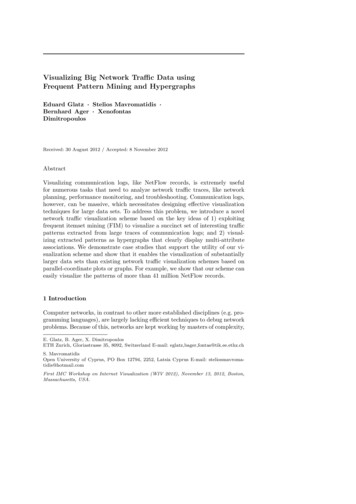
6Eduard Glatz et al.sented in this paper we use a dedicated program that converts our binary flowarchive format to text data. Alternatively, it is possible to feed our softwarewith transactional data stored in a CSV (comma separated values) file. Theinput data describe one transaction per line and can be of any kind, i.e., theyare not restricted to flow data. In a second step, the transaction attributevalues are linked to their respective attribute type to make the values froma particular column distinct from those of all neighbouring columns as theminer cannot process CSV column headers. We achieve this distinction byprepending the CSV column name to each value string. As a result we obtaina new text file that contains unique attribute/value pairs and can be fed to theminer. In a third step, we run the frequent item set miner. We chose the ‘SaM’miner programmed by Christian Borgelt [3] due to its short run time evenon massive datasets. We configure the miner for maximal frequent itemsetsand parameterize the support threshold. The output of the frequent itemsetminer is a text file containing those itemsets that exceed the configured support threshold along with their actual support values. In a fourth step, theitemset result data is mapped to a graph representation. We make use of thepopular graphing software GraphViz [8] and, consequently, describe the graphdata in the GraphViz DOT language. Finally, in step five, we render a graphimage. For rendering we prefer a force-directed layout that is supported by theGraphViz tool ‘fdp’ implementing the Fruchterman and Reingold algorithm[12]. Alternatively, the GraphViz tool ‘neato’ can be used that is based on anapproach by Kamada and Kawai [20].Our software is not restricted to network flow data or network data ingeneral. Any transactional data can be used as long as it can be providedas a CSV file. This makes our visualization approach suitable for differentapplication areas. Our software produces compatible DOT files.4 Scaling to Large Data SetsIn this section, we show how our scheme complements existing commonly-usedapproaches, which visualize every individual connection, but can only scale tosmall data sets, by enabling the visualization of frequent patterns of arbitrarylarge data sets.For example, in Figure 1 we illustrate a visualization on a parallel-coordinateplot, like the ones used by VisFlowConnect [29] and Nfsight [2], of 15,000 NetFlow records collected from a small enterprise network. For simplicity, wetreat every flow record as an individual transaction and keep four attributesper transaction: the source and destination IP addresses and port numbersof a flow. This is a small number of NetFlow records that in large networkscorrespond to only few seconds of real time. However, an analyst typicallyneeds to explore much larger data sets spanning longer time intervals. We observe in Figure 1 that even with only 15,000 transactions the plot becomescluttered making it hard to extract useful information. Similarly, graph-based
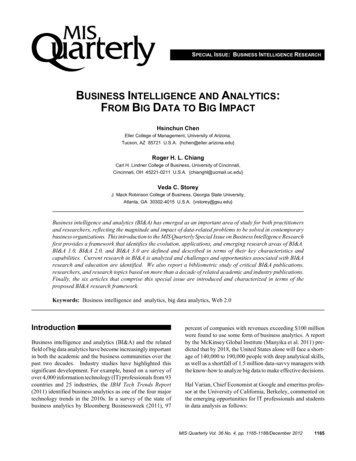
Title Suppressed Due to Excessive Length7approaches that visualize the information of every individual traffic flow produce cluttered results.Fig. 1 Visualization of 15,000 traffic flows in a parallel-coordinate plot. The visualizationbecomes cluttered even with a small number of flow records.Our approach complements such approaches by using FIM to extract andvisualize only the main patterns of large data sets. To illustrate this, in Figure 2we visualize the same data after applying FIM. We show the top 5 frequentitemsets, which capture 42.6% of the flows. We see that the proposed schemeprovides a meaningful visualization even if the number of input transactionsis very large. In fact, the amount of visualized information is independent ofthe volume of the input data, but it only depends on the number of selecteditem-sets. In our experiments, we have found that for input transactions with4 attributes, hypergraphs can clearly visualize up to 60-80 itemsets.Frequent itemset mining and its visualization is especially attractive tofind interesting patterns hidden in massive datasets. Thus, the scalability is amajor concern. Based both on measurements and theoretical analysis we findthat our processing scales linearly with the flow count. In Figure 3 we showhow the processing time scales with the number of input transactions. Wesee that we can mine and visualize more than one million input records with12 attributes each in less than 50 seconds. For 8 million records, our softwarerequires slightly more than 3 minutes. These numbers are well within real-timebounds for the large backbone network from which we are collecting NetFlowdata.
8Eduard Glatz et DstIP:194.63.247.190Fig. 2 Frequent itemset visualization of top 5 frequent itemsets extracted from 15,000traffic flows based on the proposed scheme.Run Time [s]20015010050001e 06 2e 06 3e 06 4e 06 5e 06 6e 06 7e 06 8e 06 9e 06Flow CountFig. 3 Run time of our software versus the number of input transactions. Each transactionis a flow record with 12 different attributes.5 Use CasesWe use data from the Swiss academic backbone network that serves 46 singlehomed universities and research institutes. For our use cases we collect data in
Title Suppressed Due to Excessive Length9locPort 1235.6%[2352785]remPort 80locIP 130.59.211.105.0%[2102623]prot UDP7.4%[3079375]locPort 53packet 25.6%[2328743]6.9%[2887513]USCH6.3%[2624197]prot TCPlocIP 130.59.1.80remPort 535.0%[2092766]5.5%[2278566]locPort 80remAS 15169Fig. 4 Frequent itemset visualization of one hour of traffic in
present case studies showing how our visualization enables us to easily pinpoint interesting tra c patterns. Finally, we conclude our paper in Section 6. 2 Related Work Graphs have been extensively used to visualize network tra c data. In par-ticular, a commonly-used visualization