Transcription
International Journal of Marketing, Financial Services & Management ResearchVol.1 Issue 11, November 2012, ISSN 2277 3622Online available at www.indianresearchjournals.comA STUDY OF FINANCIAL PERFORMANCE: A COMPARATIVEANALYSIS OF SBI AND ICICI BANKDR. ANURAG. B. SINGH*; MS. PRIYANKA TANDON*** Associate ProfessorLDC Institute of Technical StudiesSoraon, Allahabad (Uttar Pradesh)India** Assistant ProfessorLDC Institute of Technical StudiesSoraon, AllahabadIndiaABSTRACTBanking Sector plays an important role in economic development of a country. The bankingsystem of India is featured by a large network of bank branches, serving many kinds of financialservices of the people. The State Bank of India, popularly known as SBI is one of the leadingbank of public sector in India. SBI has 14 Local Head Offices and 57 Zonal Offices located atimportant cities throughout the country. ICICI Bank is second largest and leading bank of privatesector in India. The Bank has 2,533 branches and 6,800 ATMs in India. The purpose of the studyis to examine the financial performance of SBI and ICICI Bank, public sector and private sectorrespectively. The research is descriptive and analytical in nature. The data used for the study wasentirely secondary in nature. The present study is conducted to compare the financialperformance of SBI and ICICI Bank on the basis of ratios such as credit deposit, net profitmargin etc. The period of study taken is from the year 2007-08 to 2011-12. The study found thatSBI is performing well and financially sound than ICICI Bank but in context of deposits andexpenditure ICICI bank has better managing efficiency than SBI.KEYWORDS: Credit Deposit Ratio, ICICI, Net Profit Margin, Net worth Ratio, Advances, SBI.INTRODUCTIONAn efficient banking system is recognized as basic requirement for the economic development ofany economy. Banks mobilize the savings of community into productive channels. The bankingsystem of India is featured by a large network of bank branches, serving many kinds of financialneeds of the people.The State Bank of India, popularly known as SBI is one of the leading banks in India. The StateBank Group, with over 16,000 branches provides a wide range of banking products through itsvast network of branches in India and overseas, including products aimed at Non-ResidentIndians (NRIs). The headquarter of SBI is at Mumbai. SBI has 14 Local Head Offices and 57Zonal Offices that are located at important cities throughout the country. It also has around 13056
International Journal of Marketing, Financial Services & Management ResearchVol.1 Issue 11, November 2012, ISSN 2277 3622Online available at www.indianresearchjournals.combranches out of the country. It has a market share among Indian commercial banks of about 20%in deposits and loans.The roots of the State Bank of India rest in the first decade of 19th century, when the Bank ofCalcutta later on renamed the Bank of Bengal, was established on 2 June 1806. The Bank ofBengal was one of three Presidency banks, the other two being the Bank of Bombay(incorporated on 15 April 1840) and the Bank of Madras (incorporated on 1 July 1843). With theresult of the royal charters all three Presidency banks were incorporated as joint stock companiesand received the exclusive right to issue paper currency in 1861 with the Paper Currency Act.They retained this right till the formation of the Reserve Bank of India. The Presidency banksamalgamated on 27 January 1921, and renamed Imperial Bank of India. The Imperial Bank ofIndia remained a joint stock company.The State Bank of India was constituted on 1st July 1955, pursuant to the State Bank of IndiaAct, 1955 (the "SBI Act") for the purpose of creating a state-partnered and state-sponsored bankintegrating the former Imperial Bank of India. In 1959, the State Bank of India (SubsidiaryBanks) Act was passed, enabling the Bank to take over eight former state associated banks as itssubsidiaries.The State Bank of India's is largest bank, with approximately 9,000 branches in India and 54international offices. Its Associate Banks have a domestic network of around 4,600 branches,with strong regional ties. The Bank also has subsidiaries and joint ventures outside India,including Europe, the United States, Canada, Mauritius, Nigeria, Nepal, and Bhutan. The Bankhas the largest retail banking customer base in India.SUBSIDIARIES OF SBIState Bank of Bikaner & JaipurState Bank of HyderabadState Bank of MysoreState Bank of PatialaState Bank of PatialaState Bank of TravancoreICICI BANK-PROFILEICICI Bank is second largest and leading bank of private sector in India. It‟s headquarter is inMumbai, India. According to Forbes State Bank of India is the 29th most reputed company in theworld. The Bank has 2,533 branches and 6,800 ATMs in India. In 1998 ICICI Bank launchedinternet banking operations. The Bank offers a wide range of banking products and financialservices to the corporate and retail customers. It also provides services in the areas of venturecapital investment banking, asset management and life and non-life insurance. ICICI Bank'sequity shares are listed in India on Bombay Stock Exchange (BSE) and the National Stock57
International Journal of Marketing, Financial Services & Management ResearchVol.1 Issue 11, November 2012, ISSN 2277 3622Online available at www.indianresearchjournals.comExchange (NSE) and its American Depositary Receipts (ADRs) are also listed on the New YorkStock Exchange (NYSE).ICICI Bank limited is major banking and financial services organization in India. The bank is thesecond largest bank in India and the largest private sector bank in India by market capitalization.They are publicly held banking company engaged in providing a wide range of banking andfinancial services including commercial banking and treasury operations. The bank and theirsubsidiaries offers a wide range of banking and financial services including commercial banking,retail banking, project and corporate finance, working capital finance, insurance, venture capitaland private equity, investment banking, broking and treasury products and services. They offerthrough a variety of delivery channels and through their specialized subsidiaries in the area ofinvestment banking, life and non-life insurance, venture capital and assets management. Thebank has a network of 2035 branches and about 5518 ATMs in India and presence in 18countries. They have subsidiaries in the United Kingdom, Russia and Canada, branches in UnitedStates, Singapore, Bahrain, Hong-Kong, Srilanka, Qatar and Dubai International finance centreand representative offices in United Arab Emirates, China, South Africa, Bangladesh, Thailand,Malaysia and Indonesia. Our UK subsidiary has established branches in Belgium and Germany.The bank equity shares are listed in India on Bombay Stock Exchange and National stockexchange of India Limited and their American Depository Receipts (ADRs) are listed on NYSE.The bank is first Indian banks listed NYSE.SUBSIDIARIES OF ICICI BANKNATIONALINTERNATIONALICICI LombardICICI Bank UK PLCICICI Prudential Life Insurance CompanyLtdICICI Bank CanadaICICI Securities LimitedICICI Bank Eurasia LLCICICI Prudential Asset ManagementCompany LimitedICICI VentureICICI direct.comICICI FoundationOBJECTIVE OF THE STUDY To study the financial performance of SBI and ICICI Bank. To compare the financial performance of SBI and ICICI Bank.RESEARCH METHODOLOGY58
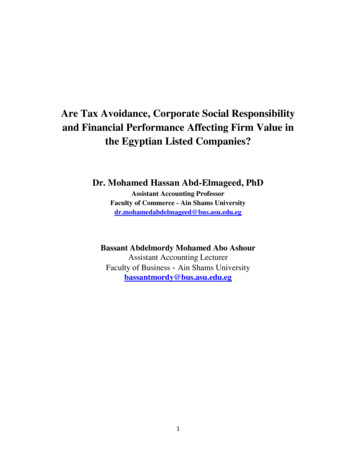
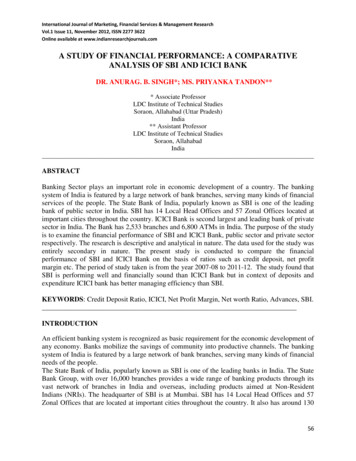
International Journal of Marketing, Financial Services & Management ResearchVol.1 Issue 11, November 2012, ISSN 2277 3622Online available at www.indianresearchjournals.comIn the present study, an attempt has been made to measure, evaluate and compare the financialperformance of SBI and ICICI Bank which one related to the public sector and private sectorrespectively. The study is based on secondary data that has been collected from annual reports ofthe respective banks, magazines, journals, documents and other published information. The studycovers the period of 5 years i.e. from year 2007-08 to year 2011-12. Ratio Analysis was appliedto analyze and compare the trends in banking business and financial performance. Mean andCompound Growth Rate (CGR) have also been deployed to analyze the trends in bankingbusiness profitability.LIMITATION OF THE STUDYDue to constraints of time and resources, the study is likely to suffer from certain limitations.Some of these are mentioned here under so that the findings of the study may be understood in aproper perspective.The limitations of the study are: The study is based on the secondary data and the limitation of using secondary data mayaffect the results. The secondary data was taken from the annual reports of the SBI and ICICI Bank. It maybe possible that the data shown in the annual reports may be window dressed which doesnot show the actual position of the banks.Financial analysis is mainly done to compare the growth, profitability and financial soundness ofthe respective banks by diagnosing the information contained in the financial statements.Financial analysis is done to identify the financial strengths and weaknesses of the two banks byproperly establishing relationship between the items of Balance Sheet and Profit & LossAccount. It helps in better understanding of banks financial position, growth and performance byanalyzing the financial statements with various tools and evaluating the relationship betweenvarious elements of financial statements.FOR THIS PURPOSE THE FOLLOWING PARAMETERS HAVE BEEN STUDIED1. Credit Deposit Ratio2. Interest Expenses to Total Expenses3. Interest Income to Total Income4. Other Income to Total Income5. Net Profit Margin6. Net worth Ratio7. Percentage Change in Net Profits8. Percentage Change in Total Income9. Percentage Change in Total Expenditure10. Percentage Change in Deposits11. Percentage Change in AdvancesCREDIT DEPOSIT RATIO:Credit-Deposit Ratio is the proportion of loan-assets created by a bank from the depositsreceived. Credits are the loans and advances granted by the bank. In other words it is the amountlent by the bank to a person or an organization which is recovered later on. Interest is chargedfrom the borrower. Deposit is the amount accepted by bank from the savers and interest is paid tothem.59
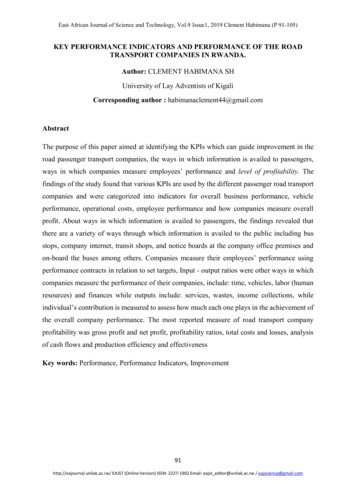
International Journal of Marketing, Financial Services & Management ResearchVol.1 Issue 11, November 2012, ISSN 2277 3622Online available at www.indianresearchjournals.comTABLE 1.1 - CREDIT DEPOSIT RATIO(IN 92.23MEAN76.18489.302CGR1.198.51Source: Annual Reports of SBI and ICICI from 2007-08 to 2011-12FIG. NO. 1.1:- CREDIT DEPOSIT RATIOTable 1.1 depicts that over the course of five financial periods of study the mean of CreditDeposit Ratio in ICICI was higher (89.302%) than in SBI (76.184%). But the Compound GrowthRate in SBI lowers 1.19% than in ICICI (8.51%). In case of SBI the credit deposit ratio washighest in 2011-12 and lowest in 2009-10. But in case of ICICI credit deposit ratio was highest in2011-12 and lowest in 2007-08. This shows that ICICI Bank has created more loan assets fromits deposits as compared to SBI.INTEREST EXPENSES TO TOTAL EXPENSES:Interest Expenses to Total Expenses reveals the expenses incurred on interest inproportion to total expenses. Banks accepts deposits from savers and pay interest on theseaccounts. This payment of interest is known as interest expenses. Total expenses include theamount spent in the form of staff expenses, interest expenses, overhead expenses and otheroperating expenses etc.60
International Journal of Marketing, Financial Services & Management ResearchVol.1 Issue 11, November 2012, ISSN 2277 3622Online available at www.indianresearchjournals.comTABLE 1.2:- INTEREST EXPENSES TO TOTAL EXPENSES(IN 065.19MEAN59.963.36CGR-6.38-1.46Source: Annual Reports of SBI and ICICI from 2007-08 to 2011-12FIG.NO.1.2:- INTEREST EXPENSES TO TOTAL EXPENSESThe table 1.2 shows that the ratio of interest expenses to total expenses in SBI was highlyvolatile it increased from 61.85 per cent to 63.27 per cent during the period 2007-08 to 2008-09.Afterwards it was decreased till 2010-11 and then again increased to 57.90 per cent. The ratio ofinterest expenses to total expenses in ICICI was also decreased from 66.135 per cent to 64.10 percent during the period 2007-08 to 2008-09. It remain stable from 2009-10 to 2010-2011 butFurther it was increased to 65.19 per cent in 2011-12 . It has been found that the share of interestexpenses in total expenses was higher in case of SBI as compared to ICICI, which shows thatpeople preferred to invest their savings in SBI than ICICI.INTEREST INCOME TO TOTAL INCOME:Interest Income to Total Income shows the proportionate contribution of interest incomein total income. Banks lend money in the form of loans and advances to the borrowers and61
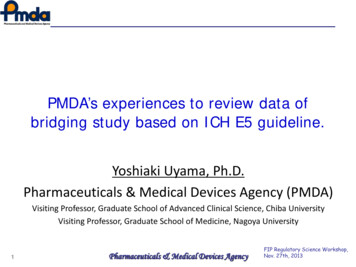
International Journal of Marketing, Financial Services & Management ResearchVol.1 Issue 11, November 2012, ISSN 2277 3622Online available at www.indianresearchjournals.comreceive interest on it. This receipt of interest is called interest income. Total income includesinterest income, non-interest income and operating income.TABLE 1.3:-INTEREST INCOME TO TOTAL INCOME IN SBI AND ICICI(IN PER 92MEAN84.4978.84CGR5.044.26Source: Annual Reports of SBI and ICICI from 2007-08 to 2011-12FIG.NO.1.3 INTEREST INCOME TO TOTAL INCOME IN SBI AND ICICIThe table 1.3 represents that the ratio of interest income to total income in SBI and ICICI both isquite stable and volatile over the years. The growth rate of SBI is 5.04 while that of ICICI is4.26. Thus, the proportion of interest income to total income in SBI was higher than that ofICICI, which shows that people preferred SBI to take loans and advances.OTHER INCOME TO TOTAL INCOME:Other income to total income reveals the proportionate share of other income in totalincome. Other income includes non-interest income and operating income. Total incomeincludes interest income, non-interest income and operating income.62
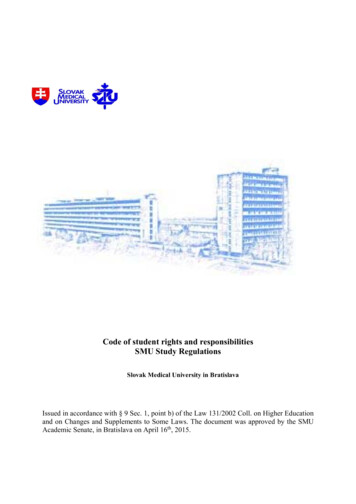
International Journal of Marketing, Financial Services & Management ResearchVol.1 Issue 11, November 2012, ISSN 2277 3622Online available at www.indianresearchjournals.comTABLE 1.4:-OTHER INCOME TO TOTAL INCOME IN SBI AND ICICI(IN 2221.44CGR-31.6-14.7Source: Annual Reports of SBI and ICICI Bank from 2007-08 to 2011-12FIG.NO.1.4 OTHER INCOME TO TOTAL INCOME IN SBI AND ICICIThe table 1.4 shows that the ratio of other income to total income was decreased from 16.10 percent in 2007-08 to 11.00 per cent in 2011-12 in case of SBI. However, the share of other incomein total income of ICICI was also decreased from 22.38 per cent in 2007-08 to 19.07 per cent2011-12. The table shows that the ratio of other income to total income was relatively higher inICICI (21.44%) as compared to SBI (15.22%) during the period of study.NET PROFIT MARGIN:Net Profit Margin reveals the financial results of the business activity and efficiency ofmanagement in operations. The table 5.8 shows the net profit margin in SBI and ICICI during thePeriod 2005-06 to 2009-10.63
International Journal of Marketing, Financial Services & Management ResearchVol.1 Issue 11, November 2012, ISSN 2277 3622Online available at www.indianresearchjournals.comTABLE-1.5:-NET PROFIT MARGIN IN SBI AND ICICI(IN .45MEAN10.9114.37CGR23.0247.7Source: Annual Reports of SBI and ICICI from 2007-08 to 2011-12FIG. NO.1.5 NET PROFIT MARGIN IN SBI AND ICICIThe table 1.5 reveals that the ratio of net profits to total income of ICICI was varied from 11.81per cent to 17.45 percent whereas in case of SBI it is not stable. It increased to 13.11 percentfrom 12.64 percent in 2008-09 then further decreased to 10.54 percent in 2009-10 and 8.55percent in 2010-11 and finally increased to 9.73 percent in 2011-12 during the period of 5 yearsof study. However, the net profit margin was higher in ICICI (14.37%) as compared to SBI(10.91%) during the period of study. But it was continuously decreased from 2007-08 to 2011-12in ICICI. Thus, the ICICI has shown comparatively lower operational efficiency than SBI.NET WORTH RATIO:Net worth Ratio is used for measuring the overall efficiency of a firm. This ratio establishes therelationship between net profit and the proprietor‟s funds.64
International Journal of Marketing, Financial Services & Management ResearchVol.1 Issue 11, November 2012, ISSN 2277 3622Online available at www.indianresearchjournals.comTABLE 1.6 NET WORTH RATIO(IN 0MEAN14.118.87CGR4.8719.68Source: Annual Reports of SBI and ICICI from 2007-08 to 2011-12FIG.NO.1.6 NET WORTH RATIOIt is clear from the table 1.6 that the net worth ratio of SBI was increased from 13.70 per cent to14.36 per cent during 2007-08 to 2011-12, and decreased in 2009-10 and 2010-2011. Whereasthe ratio was increased from 8.94 per cent to 10.70 per cent in ICICI. The table showed that thenet worth ratio was higher in SBI (14.11%) as compared to ICICI (8.87%) during the period ofstudy, which revealed that SBI has utilized its resources more efficiently as compared to ICICI.GROWTH OF PROFIT:-65
International Journal of Marketing, Financial Services & Management ResearchVol.1 Issue 11, November 2012, ISSN 2277 3622Online available at www.indianresearchjournals.comNet profit Ratio is used for measuring the profitability of the firm. It is calculated by dividing netprofit by net sales multiplied by 100. It establishes the relationship between the net profit andsales.TABLE 1.6 GROWTH OF PROFIT IN SBI AND ICICI(IN CRORES)SBIICICIYEARPROFIT% CHANGEPROFIT% CHANGE2007-086729 .4157.73 2625.50MEAN8996.64711.49CGR73.9755.49Source: Annual Reports of SBI and ICICI from 2007-08 to2011-12FIG.NO.1.6 GROWTH OF PROFIT IN SBI AND ICICIThe table 1.8 highlights that the mean value of net profit was higher in SBI (Rs. 8996.6 crores)as compared to that in ICICI (Rs. 4711.9 crores) during the period of study. Further the growth66
International Journal of Marketing, Financial Services & Management ResearchVol.1 Issue 11, November 2012, ISSN 2277 3622Online available at www.indianresearchjournals.comrate of Net Profits was also higher in SBI (73.97%) than that in ICICI (55.49%) during the studyperiod. The table also shows that the annual growth rate of profit in SBI was highest in the year2009-10 and was negative (-9.8%) in the year 2010-11. In ICICI, the annual growth rate of profitwas highest in the year 2010-11(27.9%) and was negative in the year 2008-09 (-9.61%).TOTAL INCOME:The total income indicates the rupee value of the income earned during a period. The highervalue of total income represents the efficiency and good performance.TABLE 1.7 GROWTH IN TOTAL INCOME OF SBI AND ICICI(IN CRORES)SBIICICIYEARINCOME% CHANGEINCOME% CHANGE2007-0858,348.74 .39,667.19 98.5837282.114CGR107.154.49Source: Annual Reports of SBI and ICICI from 2007-08 to 2011-12FIG.NO.1.7 GROWTH IN TOTAL INCOME OF SBI AND ICICIThe table 1.9 highlights that the mean value of total income was higher in SBI (Rs. 87,598.58crores) as compared to that in ICICI (Rs. 37282.114 crores) during the period of study. Howeverthe rate of growth regarding total income was higher in SBI (107.15 %) than in ICICI (4.49 %)during the period of study.TOTAL EXPENDITURE:67
International Journal of Marketing, Financial Services & Management ResearchVol.1 Issue 11, November 2012, ISSN 2277 3622Online available at www.indianresearchjournals.comThe total expenditure reveals the proportionate share of total expenditure spent on thedevelopment of staff, interest expended and other overheads. The higher value of totalTABLE 1.8:- TOTAL EXPENDITURE OF SBI AND ICICI(IN CRORES)SBIICICIYEAREXPENDITURE% CHANGEEXPENDITURE% CHANGE2007-0851,619.622 .35,509.47 N78,784.0632570.61CGR111.52-1.47Source: Annual Reports of SBI and ICICI from 2007-08 to 2011-12FIG.NO.1.8 TOTAL EXPENDITURE OF SBI AND ICICIThe table 1.10 discloses that the mean value of total expenditure was higher in SBI (Rs.78,784.06 crores) as compared to that in ICICI (Rs. 32570.61 crore) during the period of study.But the rate of growth regarding expenditure in ICICI was (-1.47 %) than that in SBI (111.52%)during the same period. It is clear that ICICI is successful in decreasing their total expenditure ascompared to SBI. The table also highlights that the annual growth rate of expenditure in SBI washighest (30.04) in the year 2008-09 and was lowest (14.01) in the year 2009-10. In ICICI, theannual growth rate of expenditure was negative in the year 2009-10 and 2010-11 i.e. (-18.20) and(-3.59) respectively. Hence it is clear that ICICI is more efficient as compared to SBI in terms ofmanaging expenditure.ADVANCES:Advances are the credit facility granted by the bank. In other words it is the amount borrowed bya person from the Bank. It is also known as „Credit‟ granted where the money is disbursed andrecovery of which is made later on.TABLE 1.9- TOTAL ADVANCES OF SBI AND ICICI(IN CRORES)68
International Journal of Marketing, Financial Services & Management ResearchVol.1 Issue 11, November 2012, ISSN 2277 3622Online available at % CHANGEADVANCES% CHANGE2007-08416,768.20 .225,616.08 26%MEAN646,578.89224,645CGR108.1612.45Source: Annual Reports of SBI and ICICI from 2007-08 to 2011-12FIG.NO.1.9- TOTAL ADVANCES OF SBI AND ICICITable 1.9 presents that the mean of Advances of SBI was higher (646,578.89) as compared tomean of Advances of ICICI (224,645). Rate of growth was also higher in SBI (108.16 %) than inICICI (12.45%). Table also shows the per cent Change in Advances over the period of 5 years.In case of SBI Advances were continuously increased (with a decreasing trend) over the periodof study. However Advances in ICICI were decreased till 2009-10 but these were increased inthe subsequent years.DEPOSITS:Deposit is the amount accepted by bank from the savers in the form of current deposits, savingsdeposits and fixed deposits and interest is paid to them69
International Journal of Marketing, Financial Services & Management ResearchVol.1 Issue 11, November 2012, ISSN 2277 3622Online available at www.indianresearchjournals.comTABLE 1.10-TOTAL DEPOSITS OF SBI AND ICICI(IN CRORES)SBIICICIYEARDEPOSITS% CHANGEDEPOSITS% CHANGE2007-08537,403.94 .244,431.05 2%MEAN812,234229,179CGR94.204.52Source: Annual Reports of SBI and ICICI from 2007-08 to 2011-12FIG. NO.1.10:- TOTAL DEPOSITS OF SBI AND ICICITable 1.11 presents that the mean of Deposits of SBI was higher (812,234) as compared to meanof deposits of ICICI (229,179%). However the rate of growth was higher in SBI (94.20%) thanthat in ICICI (4.52%) during the period of study. Table also shows the per cent Change inDeposits over the period of 5 years. In case of SBI Deposits were continuously fluctuating overthe period of study. However deposits in ICICI were decreased in 2008-09 and 2009-10 but thesewere increased in the year 2010-11 and 2011-12 with 11.6% and 13.2% respectively.FINDINGS AND CONCLUSIONS:The study found that the mean of Credit Deposit Ratio in ICICI was higher (89.302 %) than inSBI (76.184%). This shows that ICICI Bank has created more loan assets from its deposits ascompared to SBI. The share of interest expenses in total expenses higher in ICICI (63.36 %) ascompare to SBI (59.99 %) and the proportion of interest income to total income was higher incase of SBI(84.49 % ) as compared to ICICI (78.84%), which shows that people prefer ICICI toinvest their savings and SBI to take loans & advances. The ratio of other income to total income70
International Journal of Marketing, Financial Services & Management ResearchVol.1 Issue 11, November 2012, ISSN 2277 3622Online available at www.indianresearchjournals.comwas relatively higher in ICICI (21.44 %) as compared to SBI (15.22 %). The Net Profit Marginof ICICI is higher (14.37 %) whereas in SBI it was (10.99 %), which shows that ICICI hasshown comparatively better operational efficiency than SBI. The growth rate of net profit is73.97% in SBI which is higher than ICICI which is 55.49%. This shows that SBI performed wellas compared to ICICI. The mean value of total income was higher in SBI (87,598.58) ascompared to that in ICICI (37,282.114). Net worth ratio was also higher in SBI (14.11 %) thanICICI (8.87 %), which revealed that SBI has utilized its resources more efficiently as comparedto ICICI.The mean value of total expenditure was higher in SBI (Rs. 78,784.06 crores) as compared tothat in ICICI (Rs.32,570.61) and the combined growth rate of expenditure was negative (-1.47%)in the case of ICICI whereas in SBI it is 111.52%. Deposits in SBI were continuously increased.However deposits in ICICI were decreased (with a declining trend) till 2009-10 but these wereincreased in the subsequent years. In case of SBI Advances were continuously increased (with adecreasing trend) with the combined growth rate of (108.16 %), However Advances in ICICIwere decreased (with a declining trend) till 2009-10 but these were increased thereafter withcombined growth rate of (12.45 %). It shows that ICICI has suffered with funds or avoidproviding advances through 2007-08 to 2009-10. Hence, on the basis of the above study oranalysis banking customer has more trust on the public sector banks as compared to privatesector banks.REFERENCES: Maheshwari & Maheshwari, Banking Law and Practices, Himalaya Publishing Pvt Ltd,Allahabad, pp.152. Pandey, I.M. Financial Management, Vikas Publishing. House Pvt. Ltd. 2002, pp. 633. Study material, Financial Management Unit 17, IGNOU, New Delhi. pp.6 Trend and progress of banking, RBI, pp.22-23 Gaylord A Freeman, “ The Problem of Adequate bank Capital”, quoted by Howard D.Crosse in his book on Management Policies for Commercial Banks, pp. 158. Development Research Group Study, No. 22, Department of Economic Analysis andPolicy, Reserve Bank of India, Mumbai September 20, 2000. Financial year report of SBI 2007-08 to 2011-12. SBI bulletin publication 2012.Financial year report of ICICI Bank 2007-08 to 2011-12. ICICI Bank bulletin publication 2012 RBI statistical table relating to banks 2011-12.Information Memorandum SBI and ICICI Bank annual report 2007-12.71
Mumbai, India. According to Forbes State Bank of India is the 29th most reputed company in the world. The Bank has 2,533 branches and 6,800 ATMs in India. In 1998 ICICI Bank launched internet banking operations. The Bank offers a wide range of banking products and financial services to the corporate and retail customers.