Transcription
FISCAL YEAR 2023PERFORMANCE PLANU.S. DEPARTMENT OF TRANSPORTATION
TABLE OF CONTENTSINTRODUCTION.1Organizational Structure. 1Legislative Authorities.2Overview of Strategic Goals and Objectives.2Agency Priority Goals. 4STRATEGIC GOAL 1: SAFETY. 5Strategic Objective 1.1: Safe Public.5Strategic Objective 1.2: Safe Workers.14Strategic Objective 1.3: Safe Design. 17Strategic Objective 1.4: Safe Systems. 19Strategic Objective 1.5: Critical Infrastructure Cybersecurity.22STRATEGIC GOAL 2: ECONOMIC STRENGTH AND GLOBAL COMPETITIVENESS. 24Strategic Objective 2.1: Job Creation and Fiscal Health. 24Strategic Objective 2.2: High-Performing Core Assets. 26Strategic Objective 2.3: Global Economic Leadership.35Strategic Objective 2.4: Resilient Supply Chains.37Strategic Objective 2.5: System Reliability and Connectivity. 39STRATEGIC GOAL 3: EQUITY.44Strategic Objective 3.1: Expanding Access. 44Strategic Objective 3.2: Wealth Creation. 45Strategic Objective 3.3: Power of Community. 47Strategic Objective 3.4: Proactive Intervention, Planning, and Capacity Building. 48STRATEGIC GOAL 4: CLIMATE AND SUSTAINABILITY. 53Strategic Objective 4.1: Path to Economy-Wide Net Zero Emissions by 2050.53Strategic Objective 4.2: Infrastructure Resilience. 58Strategic Objective 4.3: Climate Justice and Environmental Justice. 58STRATEGIC GOAL 5: TRANSFORMATION.60Strategic Objective 5.1: Matching Research and Policy to Advance Breakthroughs. 60Strategic Objective 5.2: Experimentation. 61U.S. Department of Transportationi
Strategic Objective 5.3: Collaboration and Competitiveness . 62Strategic Objective 5.4: Flexibility and Adaptability . 62STRATEGIC GOAL 6: ORGANIZATIONAL EXCELLENCE . 64Strategic Objective 6.1: Customer Service. 64Strategic Objective 6.2: Workforce Development . 65Strategic Objective 6.3: Data-Driven Programs and Policies. 69Strategic Objective 6.4: Oversight, Performance, and Technical Assistance . 71Strategic Objective 6.5: Sustainability Initiatives. 74Strategic Objective 6.6: Enterprise Cyber Risks.76ACRONYMS AND ABBREVIATIONS. 78APPENDIX: RESPONSE TO THE OFFICE OF INSPECTOR GENERAL'S FY 2022 TOPMANAGEMENT CHALLENGES. 80iiFY 2023 Annual Performance Plan
INTRODUCTIONThe mission of the U.S. Department of Transportation is to deliver the world’s leading transportation system,serving the American people and economy through the safe, efficient, sustainable, and equitable movement ofpeople and goods.In accordance with the Government Performance and Results Act of 1993, as amended by the GPRA ModernizationAct of 2010 (GPRAMA), the U.S. Department of Transportation (DOT or the Department) is pleased to present theFiscal Year (FY) 2023 Performance Plan. The Annual Performance Plan provides an overview of the Department’sstrategic goals and objectives included in the FY 2022 – 2026 Strategic Plan and the performance goals andindicators associated with those goals and objectives. A limited number of these performance goals are designatedas Agency Priority Goals (APGs).In FY 2022, the Infrastructure Investment and Jobs Act (IIJA), also known as the Bipartisan Infrastructure Law(BIL), created generational investments to improve our nation’s roads and bridges, promote safety for all roadusers, help combat the climate crisis, and advance equitable access to transportation. For a variety of IIJA programsassociated targets and initiatives, DOT will establish milestones to monitor progress and achieve intended resultsof the investments. In some cases, DOT has established new performance goals and is currently developing keyimplementation plans to establish baselines and create the program structure to implement milestones and report onprogress. The performance goals presented in the Annual Performance Plan span the Department’s nine OperatingAdministrations and the Office of the Secretary of Transportation (OST), providing details on the work of DOT’sapproximately 54,000 employees across the country. Throughout the Plan, performance goals are identified asaligning to DOT’s APGs, Key Performance Indicators (KPI), or BIL Key Results using the following labels: APG: Performance goal aligns to one of the Department’s FY 2022 – 2023 APGs KPI: Performance goal is a key performance indicator from the DOT FY 2022 – 2026 Strategic Plan BIL: Performance goal is a Bipartisan Infrastructure Law Key ResultA summary of the Department’s efforts to deliver greater impact through innovation, increased effectiveness andefficiency, and better customer service is included as an appendix to this Plan, entitled Response to the Office ofInspector General’s FY 2022 Top Management Challenges.Organizational StructureCongress established DOT in 1967, consolidating 31 transportation agencies and functions under the first U.S.Secretary of Transportation, Alan S. Boyd. Approximately 54,000 DOT employees continue to bring innovationsand integrity to the work of improving the safety and performance of our multi-modal transportation system.U.S. Department of Transportation1
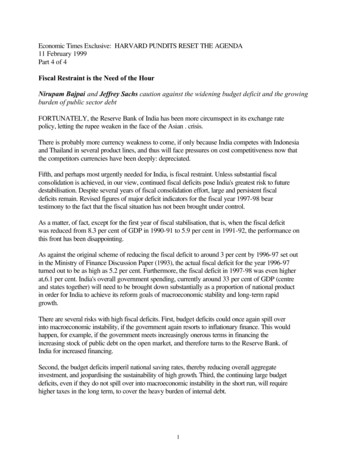
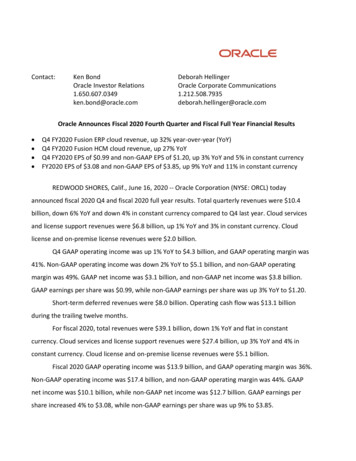
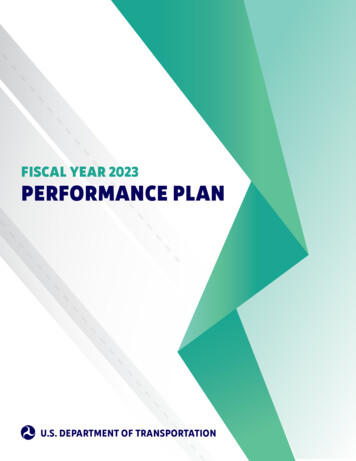
Legislative AuthoritiesCongress provides the funding and legislative authorities needed to carry out DOT’s mission. DOT’s authoritiesare substantially codified under Titles 23 (highways), 46 (maritime), and 49 (aviation, railroads, and other surfacemodes) of the United States Code. The following are significant authorization acts for DOT’s programs: Infrastructure Investment and Jobs Act (Public Law No. 117-58: November 15, 2021): Authorized funds toDOT for Federal-aid highways, highway safety programs, and transit programs, among other purposes. TheIIJA investments in infrastructure include the largest-ever Federal investment in public transit, largest Federalinvestment in passenger rail since the creation of Amtrak, and the largest dedicated bridge investment sincethe construction of the interstate system. Federal Aviation Administration Reauthorization Act of 2018 (Public Law No. 115-254: October 5, 2018):Provides a five-year authorization of the Federal Aviation Administration (FAA), the first significant multi-yearreauthorization since the FAA Modernization and Reform Act of 2012 (Public No. Law 112-95), and the firstfive-year reauthorization in over a decade. The FAA Reauthorization Act authorizes appropriations to FAAthrough FY 2023 and includes important changes related to increasing the safety and pace of UnmannedAircraft Systems integration, expediting the financing and development of airport capital projects, directingFAA to advance leadership in the field of international supersonic aircraft policies, reforming the aircraftcertification process, addressing aircraft noise, and ensuring safe lithium battery transport. Consolidated Appropriations Act of 2021 (Public Law No. 116- 260: December 27, 2020): Authorized thecontinued oversight of the nation’s more than 2.8 million miles of oil, gas, and hazardous liquid pipelines;set forth mandates for publication of new and revised safety standards for leak detection and gas distributionpipelines; and authorized research, grants, programs, and the related appropriations from FY 2021 throughFY 2023. It includes several mandates to issue regulations to improve safety of the nation’s pipelines andreduce leaks and methane emissions from pipeline facilities. The Act provides the Pipeline and HazardousMaterials Safety Administration (PHMSA) with new authority to establish pilot programs to evaluate innovativetechnologies and operations practices designed to enhance pipeline safety. The Act also directs PHMSA toconduct several studies, including a study on resources needed to establish a National Center of Excellence forLiquefied Natural Gas Safety to further U.S. government expertise in operations, management, and regulatorypractices of Liquified Natural Gas facilities and a study on the costs and benefits of establishing an independentpipeline safety testing facility under DOT. National Defense Authorization Act for Fiscal Year 2022 (Public Law No. 117-81: December 27, 2021):Authorized appropriations for MARAD’s programs, including Federal and State Maritime Academies, shipoperations, the Maritime Security Program, Tanker Security Program, Cable Security Fleet, grants to small U.S.Shipyards, and loan guarantees for ships constructed or reconditioned in the United States.Overview of Strategic Goals and ObjectivesThe FY 2022 – 2026 Strategic Plan identifies six strategic goals, which are outcome-oriented, long-term goals forthe major functions and operations of DOT. Each strategic goal has associated strategic objectives, which expressmore specifically the impact DOT is trying to achieve, many of which support the transformational initiatives madepossible by the IIJA. The Department’s strategic goals for FY 2022 – 2026 are:1. Safety: Make our Make our transportation system safer for all people. Advance a future without transportationrelated serious injuries and fatalities.2. Economic Strength and Global Competitiveness: Grow an inclusive and sustainable economy. Invest in ourtransportation system to provide American workers and businesses reliable and efficient access to resources,markets, and good-paying jobs.3. Equity: Reduce inequities across our transportation systems and the communities they affect. Support andengage people and communities to promote safe, affordable, accessible, and multimodal access to opportunitiesand services while reducing transportation-related disparities, adverse community impacts, and health effects.4. Climate and Sustainability: Tackle the climate crisis by ensuring that transportation plays a central role in thesolution. Substantially reduce greenhouse gas emissions and transportation-related pollution and build moreresilient and sustainable transportation systems to benefit and protect communities.2FY 2023 Annual Performance Plan
5. Transformation: Design for the future. Invest in purpose-driven research and innovation to meet the challengesof the present and modernize a transportation system of the future that serves everyone today and in the decadesto come.6. Organizational Excellence: Strengthen our world-class organization. Advance the Department’s mission byestablishing policies, processes, and an inclusive and innovative culture to effectively serve communities andresponsibly steward the public’s resources.GOAL 6GOAL 5GOAL 4GOAL 3GOAL 2GOAL 1STRATEGIC GOALSSAFETYECONOMICSTRENGTHAND GLOBALCOMPETITIVENESSEQUITYCLIMATE LENCEU.S. Department of TransportationSTRATEGIC OBJECTIVES1.1SAFE PUBLIC1.2SAFE WORKERS1.3SAFE DESIGN1.4SAFE SYSTEMS1.5CRITICAL INFRASTRUCTURE CYBERSECURITY2.1JOB CREATION AND FISCAL HEALTH2.2HIGH-PERFORMING CORE ASSETS2.3GLOBAL ECONOMIC LEADERSHIP2.4RESILIENT SUPPLY CHAINS2.5SYSTEM RELIABILITY AND CONNECTIVITY3.1EXPANDING ACCESS3.2WEALTH CREATION3.3POWER OF COMMUNITY3.4PROACTIVE INTERVENTION, PLANNING, AND CAPACITY BUILDING4.1PATH TO ECONOMY-WIDE NET-ZERO EMISSIONS BY 20504.2INFRASTRUCTURE RESILIENCE4.3CLIMATE JUSTICE AND ENVIRONMENTAL JUSTICE5.1MATCHING RESEARCH AND POLICY TO ADVANCE BREAKTHROUGHS5.2EXPERIMENTATION5.3COLLABORATION AND COMPETITIVENESS5.4FLEXIBILITY AND ADAPTABILITY6.1CUSTOMER SERVICE6.2WORKFORCE DEVELOPMENT6.3DATA-DRIVEN PROGRAMS AND POLICIES6.4OVERSIGHT, PERFORMANCE, AND TECHNICAL ASSISTANCE6.5SUSTAINABILITY INITIATIVES6.6ENTERPRISE CYBER RISKS3
Agency Priority GoalsAgency Priority Goals provide agencies with mechanisms to focus leadership priorities, set outcomes, andmeasure results. These include goals that can be achieved within about 24 months and depend predominantlyon agency implementation. The Department has five APGs under development spanning FY 2022 through FY2023. These APGs reflect the Biden-Harris Administration’s emphasis on climate and equity, the Department’scontinuing commitment to maintaining the safest transportation system in the world, and the historic investments intransportation infrastructure from the IIJA.1. Reduce Roadway-Related Fatalities: By September 30, 2023, the Department will reduce the rate of motorvehicle fatalities from 1.36 per 100 million vehicle miles traveled (VMT) as of October 1, 2021, to 1.22 per 100million VMT.2. Increase Aviation Safety for the Flying Public: By September 30, 2023, the Federal Aviation Administration’s(FAA) range of programs will contribute to the commercial air carrier fatality rate remaining below the target of4.9 fatalities per 100 million persons on board and contribute to the number of general aviation fatal accidentsremaining at no more than 0.94 fatal accidents per 100,000 flight hours.3. Improve the Conditions of Federally Funded Portions of the Nation’s Transportation Systems: By September30, 2023, the percentage of Interstate Pavement in either good or fair condition will be maintained at 95%; thepercentage of deck area on National Highway System bridges in either good or fair condition will be maintainedat or above 95%; the percent decrease in the reliability of Interstate person-miles traveled will be no more than0.7% from the FY 2018 baseline; and the percent of paved runways in the National Plan of Integrated AirportSystems in excellent, good, or fair condition will be maintained at 93%.4. Increase Wealth Creation Opportunities for Underserved Communities: By September 30, 2023, U.S. DOTcommits to raise small disadvantaged business utilization contract award dollars from 18.2% in FY 2021 to20.5%. In doing so, DOT aims to increase wealth creation opportunities for underserved communities throughdirect procurement mechanisms.5. Joint U.S. DOT/DOE Electric Vehicle Charging Infrastructure Deployment Under Bipartisan InfrastructureLaw (BIL): The BIL invests in the deployment of a national network of electric vehicle (EV) chargers as oneof many important ways to address the climate crisis across the U.S. Department of Transportation, U.S.Department of Energy, and their newly formed Joint Office of Energy and Transportation. All three entitieswill support building a national network of electric vehicle chargers. This is a new APG that supports thePresident’s BIL goal of installing 500,000 EV chargers. By September 30, 2023, the Joint Office of Energy andTransportation in conjunction with DOT and the U.S. Department of Energy will complete the following criticalbuilding blocks needed for the deployment of EV charging infrastructure by: Issuing a set of minimum standards and requirements for all EV chargers deployed under the BIL programsto ensure an affordable, reliable, accessible, and equitable EV charging network; Facilitating the development and approval of State, Puerto Rico, and District of Columbia EV chargingplans to establish a cohesive national EV charging network that covers all Interstates and designatedhighway corridors; Distributing formula funds “National EV Infrastructure Formula Program” and awarding competitivegrants under the Discretionary Grant Program for Charging and Fueling Infrastructure to eligible entitiesfollowing the timeline specified in the BIL; Launching a Federal EV Advisory Committee; and Offering technical assistance to school districts and transit operators deploying electric school and transitbuses under BIL programs.4FY 2023 Annual Performance Plan
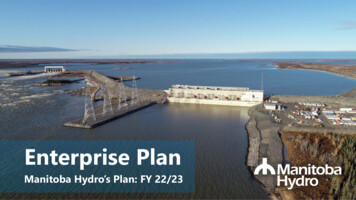
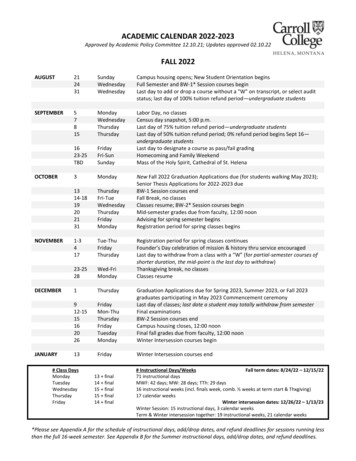
GOAL STATEMENTSTRATEGIC GOAL 1: SAFETYMake our transportationsystem safer for all people.Advance a future withouttransportation-related seriousinjuries and fatalities.1.1SAFE PUBLIC1.2SAFE WORKERS1.3SAFE DESIGN1.4SAFE SYSTEMS1.5CRITICAL INFRASTRUCTURE CYBERSECURITYStrategic Objective 1.1: Safe PublicProtect urban and rural communities and travelers, including vulnerable populations, from health and safety risks.The Safe Public objective is supported by six Operating Administrations and one OST office through the followingperformance goals: Reduce 66% of Motor Vehicle-Related Fatalities by 2040 to Demonstrate Progress to Achieve Zero RoadwayFatalities (OST-P, NHTSA, FHWA, FMCSA)KPI Reduce the Rate of Roadway-Related Fatalities to 1.22 per 100 Million Vehicle Miles Traveled by 2023(NHTSA, FHWA, FMCSA)APG, KPI, BIL Reduce Passenger Vehicle Occupant Fatalities per 100 Million Vehicle Miles Traveled (NHTSA) Reduce Large Truck and Bus Fatalities per 100 Million Vehicle Miles Traveled (FMCSA) Reduce Motorcycle Rider Fatalities per 100,000 Motorcycle Registrations (NHTSA) Reduce Non-Occupant (Pedestrian/Pedalcyclist/Other Non-occupant) Fatalities per 100,000 Population(NHTSA) Reduce the Number of Non-Motorized Fatalities and Serious Injuries (FHWA) Reduce the Race Fatality Ratio by Population (FHWA) Reduce Number of Vehicle Occupants Ejected from Passenger Vehicles per 100 Emergency Medical ServicesMotor Vehicle Crash Dispatches (NHTSA) Reduce Total Transit-Related Fatalities per 100 Million Vehicle Revenue Miles (FTA) Reduce Total Number of Transit-Related Fatalities (FTA) Reduce Highway-Rail Grade Crossing Incidents (FRA) Reduce Rail Right-of-Way Trespass Incidents (FRA) Reduce Train Accidents (FRA) Reduce Fatalities Caused by the Release of Hazardous Material Transported via Pipeline or SurfaceTransportation Conveyance (PHMSA) Reduce the Number of Incidents Involving Death and Major Injury Resulting from the Transportation ofHazardous Materials by All Modes Including Pipelines (PHMSA) Increase the Number of Overall Impressions, Social Media Engagement, Web Performance, and EmailEngagement for the Our Roads, Our Safety Campaign (FMCSA) Increase the Percentage of Person Trips by Transit and Active Transportation Modes from 4% in 2020 to 6%in 2026 (FHWA, FTA)KPIU.S. Department of Transportation5
Office of the Assistant Secretary for Transportation Policy (OST-P), National Highway TrafficSafety Administration (NHTSA), Federal Highway Administration (FHWA), Federal MotorCarrier Safety Administration (FMCSA)Reduce 66% of Motor VehicleRelated Fatalities by 2040 toDemonstrate Progress to AchieveZero Roadway FatalitiesKPIBaselineCY 2022 TargetCY 2023 Target38,824*2% reduction frombaseline5% reduction frombaselineKPI: This performance goal is a key performance indicator from the DOT FY 2022 – 2026 Strategic Plan* CY 2020 actual: blication/813266FY 2022 and 2023 Plans for ProgressThe Fatality Analysis Reporting System (FARS) contains data on every fatal motor vehicle traffic crash within the 50States, the District of Columbia, and Puerto Rico. To be included in the FARS, a traffic crash must involve a motorvehicle traveling on a public trafficway that results in the death of a vehicle occupant or a non-occupant within 30days of the crash. More information on the FARS can be found at reporting-system.In January 2022, DOT released a National Roadway Safety Strategy (NRSS) describing the major actions DOTwill take to make a meaningful difference over the next few years. At the core of this strategy is a Department-wideadoption of the Safe System Approach, which focuses on five key objectives: safer people, safer roads, safer vehicles,safer speeds, and post-crash care. The Department will launch new programs, coordinate and improve existingprograms, and adopt a foundational set of principles to guide this strategy.Safety gains beyond the long-term running decline in roadway fatalities will be achieved via three activities: (1)implementing funding from the IIJA, (2) carrying out Departmental actions in the National Roadway Safety Strategy,and (3) conducting a complementary Call to Action campaign to encourage external stakeholders to take tangible,substantive actions to advance roadway safety.National Highway Traffic Safety Administration (NHTSA), Federal Highway Administration(FHWA), Federal Motor Carrier Safety Administration (FMCSA)Reduce the Rate of RoadwayRelated Fatalities to 1.22 per 100Million Vehicle Miles Traveled by2023APG, KPI, BILBaselineFY 2022 TargetFY 2023 Target1.36*1.251.22APG: This performance goal is one of the Department’s FY 2022 – 2023 APGsKPI: This performance goal is a key performance indicator from the DOT FY 2022 – 2026 Strategic PlanBIL: This performance goal is a Bipartisan Infrastructure Law Key Result* Actual as of October 1, 2021FY 2022 and 2023 Plans for ProgressThe roadway fatality rate, which is the number of fatalities per 100 million VMT, includes fatality data in NHTSA’sFARS and VMT from FHWA’s Highway Performance Monitoring System. The FARS is a census of fatal trafficcrashes in the 50 States, District of Columbia, and Puerto Rico. To be included in the FARS, a crash must involve amotor vehicle traveling on a roadway and result in the death of at least one person (occupant or non-occupant ofa vehicle) within 30 days of the crash. The Highway Performance Monitoring System includes VMT by all types ofvehicles, including passenger vehicles, motorcycles, buses, and large trucks and buses.6FY 2023 Annual Performance Plan
There were 38,824 people killed in motor vehicle traffic crashes on U.S. roadways during 2020. This is the largestnumber of fatalities since 2007. It also represents a 6.8% increase from 36,355 fatalities in 2019, or 2,469 morepeople killed in traffic crashes in 2020. Note that 2020 was a leap year and there were 112 fatalities on February 29,2020. The fatality rate per 100 million VMT increased by 21% from 1.11 in 2019 to 1.34 in 2020, which is the largestpercentage increase on record. The estimated number of people injured on our roadways decreased in 2020 to 2.28million, falling from 2.74 million in 2019, a statistically significant decrease of 17%.NHTSA remains focused on achieving its mission through stakeholder outreach, facilitating widespread distributionof proven countermeasures, advancing vehicle safety through robust vehicle safety compliance and enforcementactivities, conducting behavioral and vehicle safety research, issuing safety rulemakings, and ensuring the safedeployment of advanced vehicle technologies, including automated driving systems.The IIJA contains numerous programs and deliverables related to addressing traffic safety, including enhancingcrash data collection, providing additional formula funds for States to address their critical safety concerns includingvulnerable road users, and advancing vehicle safety through rulemaking that provides consumers with valuablevehicle safety information.National Highway Traffic Safety Administration (NHTSA)Reduce Passenger VehicleOccupant Fatalities per 100Million Vehicle Miles TraveledBaselineFY 2022 TargetFY 2023 Target0.82*0.770.75* CY 2020 actualFY 2022 and 2023 Plans for ProgressPassenger vehicles include cars and light trucks (SUVs, pickup trucks, vans, and other light trucks) that weigh lessthan or equal to 10,000 pounds. They represent more than 90% of the vehicle fleet in the United States. NHTSA’sresearch suggests that throughout the COVID-19 pandemic, driving patterns and behaviors changed significantly.Drivers who remained on the roads engaged in riskier behavior, including speeding, failing to wear seat belts, anddriving under the influence of alcohol or other drugs. NHTSA continues to conduct research into these behaviors.NHTSA is currently working to implement the IIJA, and key safety provisions in NRSS, as follow: Underride Protection for Semi-Trailers (possible rulemaking expected in FY 2022); Adaptive Driving Beam Headlamps (final rule issued February 22); Establishing a state-of-the-art laboratory to analyze data from Event Data Recorders providing investigatorswith immediate and independent analytic capability to assist in safety investigations of potential vehicledefects, crash events, and cybersecurity and odometer tampering events; and Conducting accelerated research into effectiveness assessment of an expanded list of lifesaving vehicletechnologies, improvements in gender equity in crash outcomes, focused emphasis in vulnerable road usersafety, targeted human factors research into distraction impacts of new technologies, and high-voltage batterysafety research.U.S. Department of Transportation7
Federal Motor Carrier Safety Administration (FMCSA)Reduce Large Truck and BusFatalities per 100 Million VehicleMiles TraveledBaselineCY 2022 TargetCY 2023 Target0.177*0.1140.114* CY 2020 actualFY 2022 and 2023 Plans for ProgressIn calendar year (CY) 2020, 38,824 people died in crashes on the nation’s roadways, a 6.8% increase from CY 2019(36,355). In CY 2020, the percentage of large truck and bus fatalities actually decreased by slightly more than twopercent from 2019. There were an estimated 5,125 fatalities (13.2% of total fatalities) in crashes involving a largetruck or bus, resulting in a fatality rate of 0.177 per 100 million VMT. The large truck or bus fatality rate increasedfrom CY 2019 (0.161) to CY 2020 (0.177). The higher fatality rate, despite the reduction in large truck and busfatalities, is a result of a lower overall VMT, which includes the number of miles traveled by privately owned vehicles.The FY 2022 and 2023 fatality rate targets remain unchanged due to the steady 2018 and 2019 fatality rates andthe uncertainty of the effects of the COVID-19 pandemic. FMCSA will reevaluate the 2023 and future fatality ratetargets as the Department’s NRSS is rolled out and the nation returns to normal operations.National Highway Traffic Safety Administration (NHTSA)Reduce Motorcycle RiderFatalities per 100,000Motorcycle RegistrationsBaselineFY 2022 TargetFY 2023 Target67.0862.7161.20* CY 2020 actualFY 2022 and 2023 Plans for ProgressThe motorcycle fatality rate is measured by the number of motorcycle fatality riders per 100,000 motorcycleregistrations. This rate includes fatalities of riders of scooters, minibikes, and mopeds, in addition to motorcycles.Motorcyclists remain overrepresented in vehicle fatalities and are impacted by factors such as speed and impaireddriving. In 2020, there were 5,579 motorcyclist fatalities, an increase of 11% over FY 2019 (the highest number sincefirst data collection in 1975).To reduce the number of motorcycle fatalities, NHTSA is working to: Promote safer riding behaviors of motorcyclists in national media campaigns; Deliver education and technical assistance; and Conduct research on the safety of motorcyclists.8FY 2023 Annual Performance Plan
National Highway Traffic Safety Administration (NHTSA)Reduce Non-Occupant Fatalitiesper 100,000 PopulationBaselineFY 2022 TargetFY 2023 Target2.34*2.192.13* CY 2020 actual: blication/813266FY 2022 and 2023 Plans for ProgressNon-occupants include pedestrians, bicyclists, joggers, skateboard riders, and people riding on animals who arein a crash with a motor vehicle. They are the most vulnerable road users, as they face increased risk in crashesinvolving speeding, distracted driving, and impaired d
Throughout the Plan, performance goals are identified as aligning to DOT's APGs, Key Performance Indicators (KPI), or BIL Key Results using the following labels: APG: Performance goal aligns to one of the Department's FY 2022 - 2023 APGs KPI: Performance goal is a key performance indicator from the DOT FY 2022 - 2026 Strategic Plan