Transcription
Alcoa CorporationInvestor PresentationMarch 2021
Important informationCautionary statement regarding forward-looking statementsThis presentation contains statements that relate to future events and expectations and as such constitute forward-looking statements within the meaning of the PrivateSecurities Litigation Reform Act of 1995. Forward-looking statements include those containing such words as “anticipates,” “believes,” “could,” “estimates,” “expects,”“forecasts,” “goal,” “intends,” “may,” “outlook,” “plans,” “projects,” “seeks,” “sees,” “should,” “targets,” “will,” “would,” or other words of similar meaning. All statements by AlcoaCorporation that reflect expectations, assumptions or projections about the future, other than statements of historical fact, are forward-looking statements, including, withoutlimitation, forecasts concerning global demand growth for bauxite, alumina, and aluminum, and supply/demand balances; statements, projections or forecasts of future ortargeted financial results, or operating or sustainability performance; statements about strategies, outlook, and business and financial prospects; and statements about returnof capital. These statements reflect beliefs and assumptions that are based on Alcoa Corporation’s perception of historical trends, current conditions, and expected futuredevelopments, as well as other factors that management believes are appropriate in the circumstances. Forward-looking statements are not guarantees of future performanceand are subject to known and unknown risks, uncertainties, and changes in circumstances that are difficult to predict. Although Alcoa Corporation believes that theexpectations reflected in any forward-looking statements are based on reasonable assumptions, it can give no assurance that these expectations will be attained and it ispossible that actual results may differ materially from those indicated by these forward-looking statements due to a variety of risks and uncertainties. Such risks anduncertainties include, but are not limited to: (a) current and potential future impacts of the coronavirus (COVID-19) pandemic on the global economy and our business,financial condition, results of operations, or cash flows and judgments and assumptions used in our estimates; (b) material adverse changes in aluminum industry conditions,including global supply and demand conditions and fluctuations in London Metal Exchange-based prices and premiums, as applicable, for primary aluminum and otherproducts, and fluctuations in indexed-based and spot prices for alumina; (c) deterioration in global economic and financial market conditions generally and which may alsoaffect Alcoa Corporation’s ability to obtain credit or financing upon acceptable terms or at all; (d) unfavorable changes in the markets served by Alcoa Corporation; (e) theimpact of changes in foreign currency exchange and tax rates on costs and results; (f) increases in energy or raw material costs or uncertainty of energy supply or rawmaterials; (g) declines in the discount rates used to measure pension and other postretirement benefit liabilities or lower-than-expected investment returns on pension assets,or unfavorable changes in laws or regulations that govern pension plan funding; (h) the inability to achieve improvement in profitability and margins, cost savings, cashgeneration, revenue growth, fiscal discipline, sustainability targets, or strengthening of competitiveness and operations anticipated from portfolio actions, operational andproductivity improvements, technology advancements, and other initiatives; (i) the inability to realize expected benefits, in each case as planned and by targeted completiondates, from acquisitions, divestitures, restructuring activities, facility closures, curtailments, restarts, expansions, or joint ventures; (j) political, economic, trade, legal, publichealth and safety, and regulatory risks in the countries in which Alcoa Corporation operates or sells products; (k) labor disputes and/or and work stoppages; (l) the outcome ofcontingencies, including legal and tax proceedings, government or regulatory investigations, and environmental remediation; (m) the impact of cyberattacks and potentialinformation technology or data security breaches; and (n) the other risk factors discussed in Part I Item 1A of Alcoa Corporation’s Form 10-K for the fiscal year endedDecember 31, 2020 and other reports filed by Alcoa Corporation with the U.S. Securities and Exchange Commission, including those described in this report. AlcoaCorporation disclaims any obligation to update publicly any forward-looking statements, whether in response to new information, future events or otherwise, except asrequired by applicable law. Market projections are subject to the risks described above and other risks in the market.Any information contained in the following slides that has been previously publicly presented by Alcoa speaks as of the date that it was originally presented, asindicated. Alcoa is not updating or affirming any of such information as of today’s date. The provision of this information shall not imply that the information hasnot changed since it was originally presented.2
Important information (continued)Non-GAAP financial measuresSome of the information included in this presentation is derived from Alcoa’s consolidated financial information but is not presented in Alcoa’s financial statements prepared inaccordance with accounting principles generally accepted in the United States of America (GAAP). Certain of these data are considered “non-GAAP financial measures”under SEC rules. Alcoa Corporation believes that the presentation of non-GAAP financial measures is useful to investors because such measures provide both additionalinformation about the operating performance of Alcoa Corporation and insight on the ability of Alcoa Corporation to meet its financial obligations by adjusting the most directlycomparable GAAP financial measure for the impact of, among others, “special items” as defined by the Company, non-cash items in nature, and/or nonoperating expense orincome items. The presentation of non-GAAP financial measures is not intended to be a substitute for, and should not be considered in isolation from, the financial measuresreported in accordance with GAAP. Reconciliations to the most directly comparable GAAP financial measures and management’s rationale for the use of the non-GAAPfinancial measures can be found in the appendix to this presentation.Glossary of termsA glossary of abbreviations and defined terms used throughout this presentation can be found in the appendix.ResourcesThis presentation can be found under the “Events and Presentations” tab of the “Investors” section of the Company’s website, www.alcoa.com.3
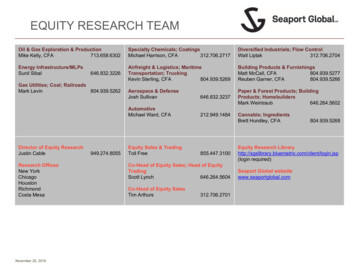
A global, values-driven aluminum industry leaderAlcoa global operations by business segmentIceland:Norway:Canada:Spain:United States:Saudi num4
Well positioned across three product segmentsAlcoa portfolio positionBauxiteAluminaAluminum1st Quartile1st Quartile2nd Quartile World’s second largest miner withoperations across four continents Largest refiner and largest longposition, outside of China Targeting 1st quartile followingportfolio review World class mine rehabilitation Lowest CO2e intensity refiner;sustainable residue managementand press filtration Low CO2e intensity producer, 78%of production from renewableenergy (targeting 85%) EcoSourceTM low carbon alumina SUSTANATM low carbon products Best-in-class mining methods inhigh biodiversity areasSource: CRU and Alcoa analysis5
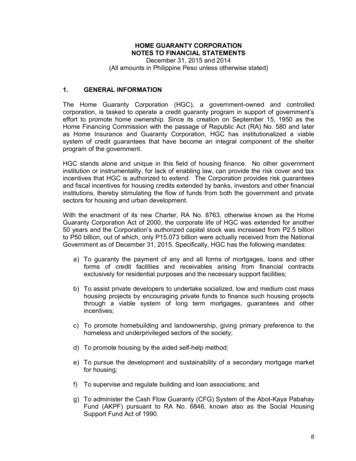
Aluminum an increasingly attractive solutionGlobal aluminum trendsAluminum integral in transition to low carbon economy and emerging market development Lightweight, durable andinfinitely recyclable Diversified demand, broadrange of aluminumapplications, sectors Accelerating consumerpreference for lower carbonfootprint materials Aluminum intensity to growin all passenger vehiclecategoriesContinued demand growth inconstruction andelectrificationSustainability goals andemerging markets drivepackaging demand growthAluminum semis consumption (Mmt) 41%2020 18%2025E 21%283020 24%2021 27%1510135TransportConstruction 17%18100 inery &Equipment6OtherChina nearing capacity cap; World ex-China produces 90% of global low carbon aluminum1 China approaching 45 Mmtper annum smeltingoperating capacity capChina smelting capacity 80% coal-fired with limitedability to transition torenewables, challenge forlong-term CO2e goals Regional CO2e costsexpected to increase by 2030due to increased worldwideconcern over climate change 10% of global primaryaluminum production is lowcarbon1China primary aluminum supply (Mmt)Unutilized Capacity2 4.0 Mt CO2e / Mt AlProduction50403020100225172010387312015Primary supply by carbon intensity1 (Mmt)4253745 Mmtper annumoperatingcapacity cap 4.0 Mt CO2e / Mt AlChinaWorldex-China36 122620202Source: Alcoa analysis, CRU, Ducker, LMC Automotive 1. Scope 1 & 2 emissions from aluminum, alumina & bauxite 4.0 Mt CO 2e / Mt aluminum in 2020. 2. Excludes 4 Mmt illegal unutilized capacity6
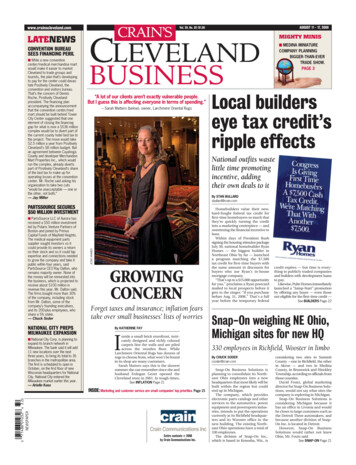
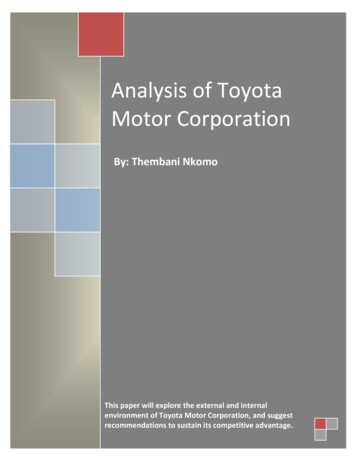
Alcoa well-positioned if carbon price shifts up cost curves2021 Global cost curve sensitivity to 50/Mt1 CO2e and sites ranked by CO2e intensityAluminumAluminaCost curve impact from global carbon pricing ( /mt aluminum)Cost curve impact from global carbon pricing ( /mt alumina)3,5006003,0002021 cost curve with 50/Mt CO2e price12,5002021 cost curve2021 cost curve with 50/Mt CO2e price12021 cost curve5004002,0003001,5001,00020th percentile to 80th percentile(curve steepness)2021 Cost curve 300Cost curve 50/Mt CO2e 82550002001000Aluminum productionCO2e intensity (Metric tons of CO2e/Mt aluminum)20th percentile to 80th percentile(curve steepness)2021 Cost curve 100Cost curve 50/Mt CO2e 150Alumina productionCO2e intensity (Metric tons of CO2e/Mt luminum productionAlumina productionSources: Alcoa analysis, CRU. Consolidated equity cost positions. 1. Applies 50/Mt price to scope 1 & 2 emissions. 2. Includes hydro, nuclear and other renewable sources of energy.7
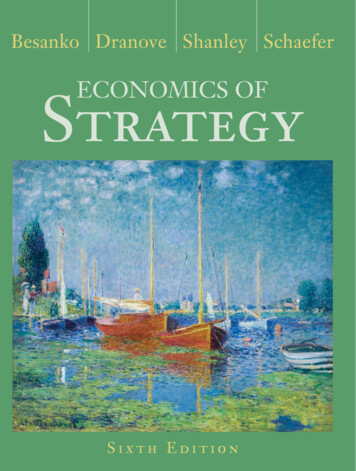
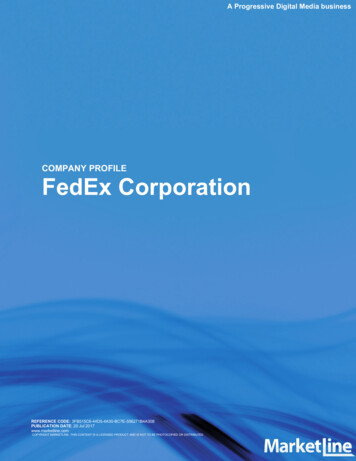
Many key strategic actions completed, others progressingKey strategic actions achievements and timelineCompletedNew operating modelCompletedNon-core asset sales Redesigned andsimplified organizationalstructure; eliminatedbusiness units Targeted 500 million to 1 billion cashproceeds; 850 millioncash proceedsannounced Enhanced operationalfocus and commercialeffectiveness Achieved target of 60million run rate savings Gum Springs facilitysold in 1Q20 Warrick rolling mill saleclosing expected 1Q21 Rockdale land listed2Q201Q21OngoingAsset portfolio review Complete Portland power negotiations Resolve San Ciprián smelter status Remaining review underway (Mmt)PointComfortRemaining capacity under reviewActions completed/underway153.220.820.7111.72019 refining capacityIntalcoSan CipriánPortland2019 smelting capacity20248
Delivering a stronger Company amidst industry gainsKey takeaways Market dynamics improvingExpecting benefit from supply shifts and aluminumdemand growth, especially in emerging markets Focusing on actionsImplementing key strategic actions to improveoperationally and financially Positioning for a sustainable worldLeveraging our industry-leading environmental andsocial standards for a sustainable future9
Appendix I
2020 Debt issue and stable conditions provide liquidityLiquidity position and business considerationsCash balance and maturity profile ( M)Cash and liquidity considerationsOn July 13, 2020 issued 750 million aggregate principalamount of 5.5% senior notes due 2027 Rationale at time of issue included providing an interimliquidity cushion during COVID-19 pandemic1,6071,500Additional considerations over last three quarters:750 Overall market stabilization and improved commoditypricing environment increasing financial stability andreducing need for enhanced liquidity750500500834Q20Cash20212022Debt maturities1.202320242025Revolving credit202620272028 Expect closing of the Warrick rolling mill sale in 1Q21to generate substantial cash proceedsWill deploy excess cash in accordance with capitalallocation framework4Q20 Cash balance1Does not include future expected proceeds from sale of Warrick rolling mill in 1Q2111
Appendix II:4Q20 Financial Results andOther Informationas presented onJanuary 20, 2021
4Q20 Results improve sequentially and year over yearIncome statement highlights4Q193Q204Q20FY19FY20 2,436 2,365 2,392 10,433 9,286 363 5 60 1,031 104 54 42 20 415 187Net loss attributable to Alcoa Corporation (303) (49) (4) (1,125) (170)Diluted loss per share (1.63) (0.26) (0.02) (6.07) (0.91) 346 284 361 1,656 1,151 86 229 27 436 22699.5%540.6%25.3%67.9%129.7%M, Except per share amountsIncome statement highlightsRevenueRestructuring and other charges, netProvision for income taxesAdjusted income statement highlightsAdjusted EBITDA excluding special itemsProvision for income taxesOperational tax rateAdjusted net (loss) income attributable to Alcoa CorporationAdjusted diluted (loss) earnings per share (57) (218) 49 (184) (215) (0.31) (1.17) 0.26 (0.99) (1.16)13
Higher metal and alumina prices drive EBITDA increaseAdjusted EBITDA excluding special items sequential changes, M3054(3)903613Q204Q20ChangeBauxite 124 120 (4)Alumina11997(22)Aluminum11618165Segment minations(35)540Other corporate(29)(34)(5) 284 361 esAPIRawEnergymaterialsPrice/ mixVolume Production Othercosts4Q2014
1.6 billion cash after 250 million U.S. pension fundingQuarterly cash comparison and cash flow informationQuarter ending cash balance, MYTD Cash flow information, M 2,248 728 1,736 1,607 736 736Debt issuanceproceeds (net)Debt issuanceproceeds (net) 965 8791.2.3.Change inworking capital 163Proceeds fromasset sales 198 829 1,0004Q19 7361Q202Q203Q20Other cash 8714Q20AdjustedEBITDA 1,520 9 67 112 141 120OtherSpecial itemsEnvironmental/AROInterest 159Restructuring2 183Cash income taxesNet distributions to NCI 1,151Sources1 353Capital expenditures 376Pension/OPEB funding3UsesSources defined as Adjusted EBITDA excluding special items plus changes in working capital (accounts receivable, inventories, accounts payable), proceeds from asset sales and debt issuance.Restructuring includes payments related to divestiture of the Avilés and La Coruña facilities and severance related to various programs.Pension/OPEB funding of 436 million is reflected net of 60 million related expenses within Adjusted EBITDA; 250 million contributed to U.S. pension plan on December 18, 2020.15
Capital allocation framework directs uses of excess cashCapital allocation framework and considerations Maintain liquidity throughout the cycle Capital expenditures to sustain and improve operations Maximize value creation opportunitiesReduce adj.net debt1 to 2.0B- 2.5Bover 1-3years1.Returnexcesscash tostockholdersTransformthe portfolioInvest invaluecreatinggrowthprojects Adjusted net debt defined as the Alcoa proportional share of net debt plus net pension and OPEB liability. 1 billion target for minimum cashbalance; 1.6 billion as of December 31Sustaining capital expenditures of 375million, return seeking capital of 50million, per 2021 outlookBased on current discount rates andestimated asset returns, expect to meetadjusted net debt target solely throughminimum required pension contributions 150 million available of existing 200million buyback authorizationPortfolio review and transformation overthe next four yearsInvest in major value creating projects16
Pension/OPEB net liability 2.4 billion, DWC 4 days betterKey financial metrics and pension/OPEB updateKey financial metricsPension/OPEB update, billionPensionFY20 Daysworking capital (DWC)FY20 Return on equity23 Days(5.9)%0.6 2.31.5FY20 CapitalexpendituresProportionaladjusted net debt1 353M 3.5B4Q20 Cash balance (142)M 1.6B 2.411.5(0.1)0.90.831-Dec-19FY20 Free cash flow lessnet NCI distributions(0.4)0.0OPEBFundingAsset returnabove expectedDiscountrateOther31-Dec-20FY20 funding Pension funding of 343 million (including 250 million inDecember 2020) OPEB payments of 93 million GAAP worldwide pension funding status 77%After 200 million use in early January 2021, U.S. pensionpre-funding balance of 500 million available for FY21 1.Includes OPEB liabilities of approximately 83 million related to the Warrick rolling mill sale; expected to close 1Q21. Recorded in Liabilities held for sale.17
Successful cash actions, solid progress on strategic actionsImpacts of cash actions, before tax and noncontrolling interest, MCash actions compared to FY19 baselineFY20 TargetFY20 ActualNew operating model4545Non-core asset sales20020310-7521New operating model: Leaner, more integrated, operator-centricorganization; achieved run-rate savings of 60 million per annumKey strategic actionsPortfolio review2020 programsLeaner working capital75-100111Lower production costs100731001222538Defer pension funding to 20212202021Hiring, travel, other restrictions3530 900845Non-core asset sales: 500 million to 1 billion from non-coreasset sales; Warrick rolling announced; Rockdale land remains onmarketUpper target 1,00083750500587Lower target0Contingent Gum SpringsWarrick rolling millGum Springs200Non-core asset sale update ( M)COVID-19 responseReduce capital expendituresDefer environmental/AROPortfolio review: 4 million metric tons of alumina refining and 1.5million metric tons of smelting capacity under review; sustainabilitytargetsRemaining capacity under reviewTotal82San Ciprián strike working capital impactTotal 90015PointComfort3.2221.00.5Intalco/San Ciprián111.72019 refining capacity2019 smelting capacity9271. 202 million deferred under CARES Act during 2020; 250 million contribution made on December 18, 2020.Actions completed/underway18
2021 OutlookFY20 and FY21 Key metricsCash flow impactsIncome statement excl. special items impactsFY20 ActualFY21 OutlookBauxite shipments (Mdmt)48.749.0 – 50.0Pension / OPEB fundingAlumina shipments (Mmt)13.913.9 – 14.0Discretionary debt repayment 0M3.02.7 – 2.8Stock repurchases 0M (45)M (65)MReturn-seeking capital expenditures2Aluminum shipments (Mmt)Transformation (adj. EBITDA impacts)Intersegment elims. (adj. EBITDA impacts)Varies (113)M (120)MDepreciation, depletion and amortization 653M 675MNon-operating pension/OPEB expense 108M 75MInterest expense 146M 165M 226MVaries 163M40% of AWAC NIOther corporate (adj. EBITDA impacts)Operational taxexpense1Net income of noncontrolling interest1.2.3.4. (8)MFY20 ActualFY21 Outlook 436M 315MWill vary based onmarket conditionsand cash availability 35M 50M 318M 375M 45M 25MCurrent period cash taxes1 114MVariesEnvironmental and ARO payments4 112M 150MImpact of restructuring and other charges 120MTBDSustaining capitalexpenditures2Payment of prior year incometaxes3Note: The COVID-19 pandemic has increased the potential for variance of actualresults compared to our outlook.Additional market sensitivities and business information are included in appendix.Estimate will vary with market conditions and jurisdictional profitability.AWAC portion of FY21 CapEx outlook: 50% of return-seeking capital expenditures, and 60% of sustaining capital expenditures.Net of pending tax refunds.As of December 31, 2020, the environmental remediation reserve balance was 321M and the ARO liability was 753M.19
Strengthening the Company, 2017-2020Multi-year strategy to remain competitive in a quickly evolving market2017 – 2019Operating Safely andEfficientlyOptimizing and Reshapingthe Portfolio Revitalized safety program withzero fatalities Restarted Lake Charles, Portland,and Warrick facilities Imp
Mar 03, 2021 · Cost curve impact from global carbon pricing ( /mt aluminum) 2021 cost curve 2021 cost curve with 50/Mt CO 2 e price1 100 200 300 400 500 600 CO 2 e intensity (Metric tons of CO 2 e/Mt alumina) Cost curve impact from global carbon pricing ( /mt alumina) Alumina production 2021 cost