Transcription
Analysis of ToyotaMotor CorporationBy: Thembani NkomoThis paper will explore the external and internalenvironment of Toyota Motor Corporation, and suggestrecommendations to sustain its competitive advantage.
Analysis of Toyota Motor Corporation by Thembani NkomoANALYISIS OF TOYOTA MOTOR CORPORATIONTABLE OF CONTENTS1COMPANY OVERVIEW2EXTERNAL ENVIRONMENT OF THE AUTOMOTIVE INDUSTRY2.1Industry Overview and Analysis2.2Industry Life Cycle2.3Industry Demand Determinants2.4Porter’s Five Forces2.5Industry Cost Structure Benchmark2.6Industry Competitive Landscape2.7Major Competitors2.8Key Success Factors in Industry3INTERNAL ENVIRONMENT OF TOYOTA3.1Core Competencies3.2Distinct Competency3.3SWOT Analysis3.4BCG Matrix: Internal Analysis of Toyota Portfolio3.5VRIO Framework Analysis3.6Toyota’s Efforts in Emerging Economies3.7Case Study: Toyota’s Successful Strategy in Indonesia3.8Strategic M&A, Partnerships, Joint Ventures, and Alliances3.9Analysis of Financial Performance4RECOMMENDATIONS5APPENDICES6REFERENCES
Analysis of Toyota Motor Corporation by Thembani Nkomo1. TOYOTA CORPORATE OVERVIEW:Founded in 1937, Toyota Motor Corporation is a Japanese company that engages in the design, manufacture, assembly, andsale of passenger cars, minivans, commercial vehicles, and related parts and accessories primarily in Japan, North America,Europe, and Asia. Current brands include Toyota, Lexus, Daihatsu and Hino. Toyota Motor Corporation is the leading automanufacturer and the eighth largest company in the world. As of March 31, 2013, Toyota Motor Corporation’s annualrevenue was 213 billion and it employed 333,498 people. 12. EXTERNAL ENVIROMENT OF AUTOMOTIVE INDUSTRY:2.1. Industry Overview and AnalysisToyota Motor Corporation competes in the automotive industry. The past five years were tumultuous for automobilemanufacturers. Skyrocketing fuel prices and growing environmental concerns have shifted consumers' preferences away fromfuel-guzzling pickup trucks to smaller, more fuel-efficient cars. Some automakers embraced the change by expanding theirsmall-car portfolios and diversifying into the production of hybrid electric motor vehicles. Other automakers were morereluctant to shift their focus from big to small cars, expecting the price of fuel to contract eventually, bringing consumersback to the big-car fold. When fuel prices did fall during the second half of 2008, it was due to the US financial crisis rippingthrough the global economy. This had a domino effect throughout the developed and emerging worlds, with many Westernnations following the United States into recession. Industry revenue fell about 15.4% in 2009. 2 Pent-up demands will aidindustry revenue growth, estimated at 2.1% in 2013, thus bringing overall revenue to an estimated 2.3 trillion. 3 Overall, thelarge declines followed by recovery are expected to lend the industry average growth of 2.2% per year during the five yearsto 2013. Throughout the past five years, growth in the BRIC countries supported production. Rising income in thesecountries led to an increase in the demand for motor vehicles. Also, Western automakers moved production facilities to BRICcountries to tap into these markets and benefit from low-cost production. Over the next five years, the emerging economieswill continue their growth, and demand for motor vehicles in the Western world will recover. Industry revenue is forecast togrow an annualized 2.5% to total an estimated 2.6 trillion over the five years to 2018. 42.2. Industry Life CycleThis industry is in the mature stage of its life cycle.2.3. Industry Demand DeterminantsWorldwide automobile demand is tied to vehicle prices, per capita disposable income, fuel prices and product innovation. Onthe supply end, vehicle prices stem from material and equipment costs, with higher steel and plastic prices raisingmanufacturers' purchasing costs and, ultimately, retail prices. During the past five years, automakers have been plagued withhigh steel and plastics prices, which have raised manufacturing costs and product prices. On the demand side, per capitadisposable incomes determine affordability for consumers. As incomes increase, the propensity to purchase motor vehiclesincreases as they become more affordable. Incentives are used to generate sales during periods of low economic growth. Overthe past five years, there has been a significant increase in the number of automobile financing companies being establishedin the BRICs. This has resulted in the number and range of automobile loans increasing, which has contributed to strongerindustry demand. In the developed world, overall improved quality among most manufacturers has caused buyers to feel freerto use price to differentiate similar products. Consumers are increasingly better informed about a vehicle's actual cost and lesslikely to accept large annual price increases. In an era of low inflation, customers familiar with dealer cost information fromconsumer publications and the internet have become more astute when negotiating the purchase of a vehicle. In this way,consumer awareness and access to information can determine demand. Movements in fuel prices also generally influence thedemand for vehicles by type. During periods of high fuel prices, more fuel-efficient vehicles are in demand. Over the pastfive years, the price of fuel has been rising, which has encouraged the adoption of hybrid and other fuel-efficient models. Forexample, Japanese carmakers offering more fuel-efficient vehicles took market share from manufacturers of large vehiclesthroughout the latter half of the past decade. Last, product innovation can spur demand, especially with regard to more fuelefficient vehicles such as hybrids and electric models. The more fuel-efficient a model is, the more likely a consumer will bewilling to invest up front in a new car for potential savings on fuel costs down the road.
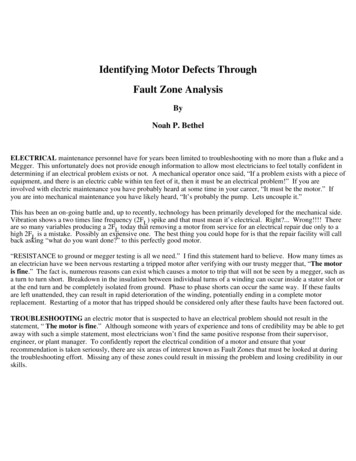
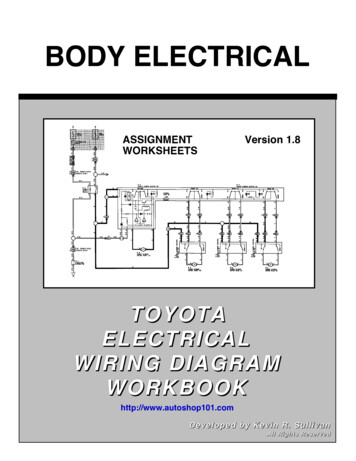
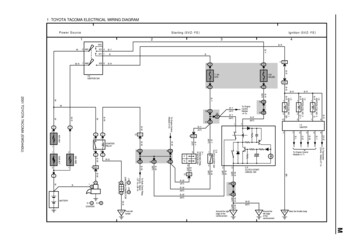
Analysis of Toyota Motor Corporation by Thembani Nkomo2.4. Porter’s Five Forces of the Automotive IndustryThreat of New Entry (Weak): Large amount of capital required High retaliation possible from existing companies, if new entrants would bring innovative products and ideas to theindustry Few legal barriers protect existing companies from new entrants All automotive companies have established brand image and reputation Products are mainly differentiated by design and engineering quality New entrant could easily access suppliers and distributors It is very hard to achieve economies of scale for small companies Governments often protect their home markets by introducing high import taxesSupplier power (Weak): Large number of suppliers Some suppliers are large but the most of them are pretty small Companies use another type of material (use one metal instead of another) but only to some extent (plastic instead ofmetal) Materials widely accessible Suppliers do not pose any threat of forward integrationBuyer power (Strong): There are many buyers Most of the buyers are individuals that buy one car, but corporates or governments usually buy large fleets and canbargain for lower prices It doesn’t cost much for buyers to switch to another brand of vehicle or to start using other type of transportation Buyers can easily choose alternative car brand Buyers are price sensitive and their decision is often based on how much does a vehicle cost Buyers do not threaten backward integrationThreat of Substitutes (Weak): There are many alternative types of transportation, such as bicycles, motorcycles, trains, buses or planes Substitutes can rarely offer the same convenience Alternative types of transportation almost always cost less and sometimes are more environment friendlyCompetitive Rivalry (Very Strong): Moderate number of competitors If a firm would decide to leave an industry it would incur huge losses, so most of the time it either bankrupts or stays inautomotive industry for the lifetime Industry is very large but matured Size of competing firm’s vary but they usually compete for different consumer segments Customers are loyal to their brands There is moderate threat of being acquired by a competitor2.5. Automotive Industry Cost Structure BenchmarkPurchases (70.7%), wages (6.3%), depreciation (6.0%), rent & utilities (1.7%), other (10.4%), profit (4.9%) 52.6. Automotive Industry Competitive LandscapeMarket share concentration in the industry is low. The industry is deemed to have a low level of concentration, and thelargest four automakers are estimated to account for about one-third of global revenue.2.7. Major Companies in the Automotive IndustryToyota (10.2%), Volkswagen (9.6%), General Motors (6.9%), Ford (5.6%), Others (67.7%) 62.8. Key Success Factors in the Automotive Industry: Flexibility in determining expenditure: Controlling employee-related costs, such as health and pension costs, makesmanufacturers in the developed world more competitive.
Analysis of Toyota Motor Corporation by Thembani Nkomo Establishment of export markets: Development of export markets helps negate any downturns in domestic markets.Use of most efficient work practices: Good industrial relations through a motivated workforce assist in minimizingindustrial disputes.Effective cost controls: A close relationship with suppliers and good distribution channels assist controlling costs.Access to the latest available and most efficient technology and techniques: The industry is highly competitive, soenterprises need a technology-enabled competitive edge.Optimum capacity utilization: Excessively high plant utilization is required for success in any modern automobile andlight-duty motor vehicle manufacturing plant.3. INTERNAL ENVIROMENT OF TOYOTA:3.1. Core CompetencyThe core competence of Toyota Motor Corporation is its ability to produce automobiles of great quality at best prices,thereby providing a value for money to the customers. This core competence of quality can be attributed to its innovativeproduction practices. The quality aspect of Toyota’s products have revolutionized the automobiles in the past and almost allthe automobile companies had to try and better the quality of their products. It is a cornerstone of the cost leadership strategythat the company pursues.3.2. Distinctive CompetencyToyota’s distinctive competence is its production system known as the “Toyota Production System” or TPS. TPS is based onthe Lean Manufacturing concept. This concept also includes innovative practices like Just in Time, Kaizen, and Six Sigmaand so on. Toyota has worked tirelessly over the years to establish this distinctive competence. No other automobilemanufacturer can do it as well as Toyota does. This distinct competence has led to a competitive advantage that has givenToyota a sustainable brand name and a market leader position. 73.3. SWOT AnalysisStrengths: Strong market position and brand recognition: Toyota has a strong market position in different geographies across theworld. The company's market share for Toyota and Lexus brands, (excluding mini vehicles) in Japan was 45.5% inFY2012. Similarly, Toyota has a market share of 12.2% in North America, 13.4% market share in Asia (excluding Japanand China), and 4.3% market share in Europe. In addition, the company holds a 7% share of the Chinese market and asignificant market share in South and Central America, Oceania, Africa and the Middle East regions. Such strong marketposition allows the company to gain competitive advantage and also expand into international markets. In addition,Toyota holds a portfolio of strong brands in the automotive industry. Thus, the company's strong market position gives itsignificant competitive advantage and helps it to register higher sales growth in domestic and international markets. 8 Strong focus on R&D: Toyota has a strong focus on R&D to expand its product portfolio and improve the functionality,quality; safety and environmental compatibility of its products. The company's R&D efforts are directed at developingnew products and processes and improving the capabilities of existing products. The company conducts its R&Doperations at 14 facilities worldwide. Strong focus on R&D has helped the company in incorporating newer features to itsexisting range of products and also in bringing out latest technologies in the varied areas. The company's strong focus onR&D allows it to uphold the technological leadership in most of its product segments. It also enables Toyota to developinnovative products, leading to strong sales. 9 Extensive production and distribution network: Toyota has an extensive production and distribution network. Toyotaand its affiliates produce automobiles and related parts and components through more than 50 manufacturing companiesin 27 countries and regions besides Japan. During FY2012, the company produced 7,435,781 vehicles, including3,940,000 vehicles in Japan and 3,495,000 vehicles across all other manufacturing locations. In addition, Toyota has anextensive distribution network. While the company’s geographically well spread production base diversifies businessrisks, its extensive distribution network provides a wider reach, thus boosting revenues. 10Weaknesses: Product recalls could affect brand image: Toyota has conducted a number of product recalls in the recent past, whichcould affect the brand image and overall sales of the company. For instance, in 2011, Toyota recalled 111,000 models ofToyota and Lexus brands’ vehicles due to the damage to elements of the substrate and potential shutdown of the hybridsystem. Further in the year, Toyota recalled 181,000 vehicles in Japan in relation to abnormal noise and oil leakage that
Analysis of Toyota Motor Corporation by Thembani Nkomomay have resulted from slack of bolts in the sub transmission and the rear wheel differential. In addition, the companywas involved in government investigations related to product recalls. For instance, in February 2012, the NationalHighway T
Analysis of Toyota Motor Corporation by Thembani Nkomo ANALYISIS OF TOYOTA MOTOR CORPORATION TABLE OF CONTENTS 1 COMPANY OVERVIEW 2 EXTERNAL ENVIRONMENT OF THE AUTOMOTIVE INDUSTRY 2.1 Industry Overview and Analysis 2.2 Industry Life Cycle 2.3 Industry Demand Determinants 2.4 Porter’s Five Forces 2.5 Industry Cost Structure Benchmark 2.6 Industry Competitive Landscape 2.7 Major Competitors