Transcription
The Differential Viscometer. 11. On-Line ViscosityDetector for Size-Exclusion ChromatographyMAX A. HANEY, Viscotek Corporation, 1030 Russell Dr.,Porter, Texas 77365SynopsisThe new technique of differential viscometry measures directly the specific viscosity of asolution by subtracting the contribution of solvent in a balanced capillary bridge. The presentwork adapts the differential viscometry principle to the design of a viscosity detector for usein size-exclusion chromatography. It is shown that the resulting viscosity detector possessesexcellent sensitivity and baseline stability with a minimum detectable specific viscosity of 2.7xThe viscosity detector can be operated together with a refractive index detector todetermine the intrinsic viscosity of polymer solute fractions as they elute from the SEC column.The bandspreading of the viscosity detector is compared to the refractive index detector bymeasuring the peak width of a compound having a single discrete molecular weight. The peakwidth at half-height was 0.29 mL for the viscosity detector and 0.25 mL for the refractiveindex detector.INTRODUCTIONSizeexclusion chromatography (SEC) is the most widely used techniquefor determining molecular weight distribution of polymers. A persistentproblem in SEC is the difficulty of calibration. Conventional calibrationmethods use a series of narrow distribution polymer standards or in somecases a broad distribution polymer standard. The difficulty arises from thefact that reliable standards are available for only a very few polymer materials. Standards of one polymer type do not work for any other polymertype. The calibration problem is so intractable that molecular weight valuesobtained by SEC are used mostly for comparative purposes among polymersof the same composition. This severely limits the applications, because inmany cases it is desired to compare molecular weights of different polymersin order to separate the effects of molecular weight and molecular structureon polymer properties.One way around the calibration problem is to use a low-angle laser lightscattering (LALLS) detector in conjunction with the concentration detector.'The LALLS detector produces a signal which is a function of the molecularweight of the polymer solute. No molecular weight standards are needed,but the refractive index increment dn/dc and the second virial coefficientA for the particular polymer-solvent system must be known or determinedseparately.The Universal Calibration Method has long been considered to be potentially the ideal solution to the problem. This method is based on the conceptof the hydrodynamic volume [ q] Mbeing the determining factor in the sizeexclusion retention mechanism. A plot of [ q ] Mvs. retention volume shouldJournal of Applied Polymer Science, Vol. 30,3037-3049 (1985)@ 1985 John Wiley & Sons, Inc.CCC 0021-8995/85/073037-13 04.OO
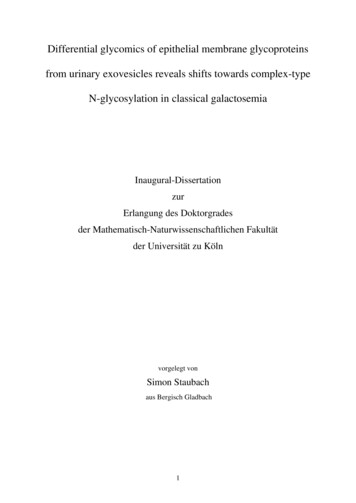
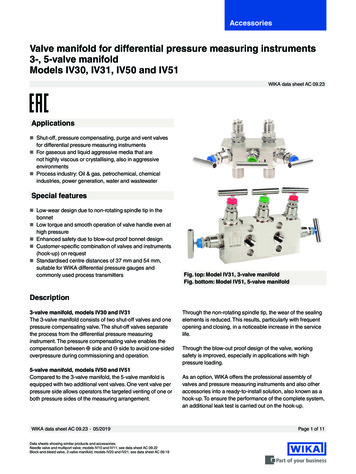
3038HANEYthen be invariate for a given column set, independent of polymer structure.The validity of universal calibration has been confirmed experimentally ona variety of polymer solvent systems. Benoit et a1.2first showed its validitywith flexibly coiled, organic-soluble polymers of the type used in thermoplastic applications. Fish et al.3 demonstrated it for complex proteins anddenatured proteins. Frigon et al., found it valid for dextrans and globularproteins. Many exceptions to universal calibration have been found, butthese are generally ascribed to the interference of nonexclusion mechanismson the retention. In fact, proportionality of retention volume to [q]Mis nowgenerally taken as a test of the operability of the size-exclusion mechanism.It is obvious that a viscosity detector is needed in order to fully utilizethe universal calibration method. However, most applications to date havenot used a viscosity detector because of the unavailability of commercialunits. Several attempts have been made to construct viscosity detectorsbased on the principle of measuring the pressure drop produced by the SECeffluent flowing through a single capillary tube.”7 These devices have succeeded in showing the utility of a viscosity detector, but they have notevolved into commercial instruments because of a lack of sensitivity andstable baseline. The root cause of this insensitivity and instability is evident:The baseline pressure due to the solvent is only slightly less than the peakpressure due to the SEC effluent. Clearly a method is needed which effectively subtracts the baseline pressure, e.g., a differential measurement.The differential viscometer (DV) previously described6 functions in thismanner, providing high sensitivity for specific viscosity measurements ofsolutions. It will be shown in this paper that a slight rearrangement of thebasic capillary bridge system converts the DV into a viscosity detector forSEC. The DV detector nulls the solvent pressure as desired, yielding adifferential signal proportional to the specific viscosity of the SEC effluent.It is somewhat analogous to a differential refractometer detector whichyields a differential signal proportional to concentration. The two detectorstogether provide measurement of the intrinsic viscosity qsp/C.INSTRUMENTATIONPrinciplesA simplified schematic of the SEC viscosity detector is shown in Figure1.The SEC effluent flows continuously through the bridge network, whichconsists of four capillaries R,-R, of equal flow resistances. It differs in basicdesign from the DV of Ref. 8 in that one of the holdup reservoirs (A) hasbeen relocated to a position out of the flow stream and now acts only as acompensation volume so that any temperature fluctuations cause equalvolume changes on each side of the differential pressure transducer. Theother reservoir holds up the SEC effluent and prevents it from enteringcapillary R,. Both reservoirs can be switched simultaneously either in orout of the bridge circuit by means of tandem switching valves S A S BWhen.they are out of the circuit (BYPASS position), they can be filled with mobilephase solvent by means of a pumping system not shown.When valves S A S Bare turned to INJECT position the SEC effluent flows
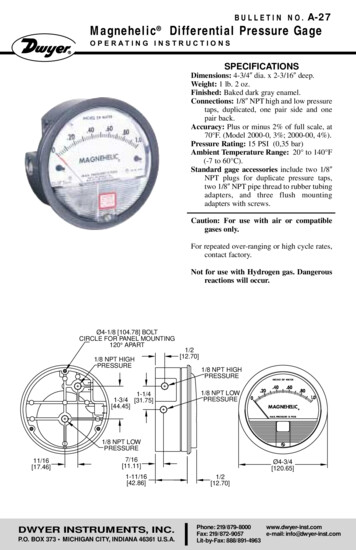
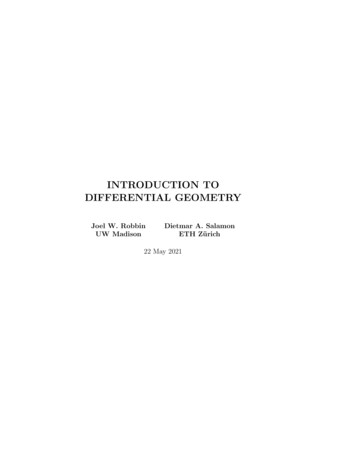
DIFFERENTIAL VISCOMETER. I13039SEC InI-@WasteFig. 1. Simplified schematic of DV detector.into reservoir B, displacing the solvent. For any time slice in the chromatogram polymer solution will be in capillaries R1, R2,and RB,but solventwill be in capillary R4.Obviously, reservoirs A and B must be large enoughthat the solvent is not entirely displaced until after the chromatographicpeak is completely eluted.The action of the reservoir is illustrated in Figure 2, which shows achromatogram obtained on the DV detector. The differential pressure baseline is constant until some point after the elution of the peak where thevolume of solvent in the holdup reservoir B is exhausted and breakthroughservoir1Elution Volume Fig. 2. DV chromatogram illustrating holdup action of reservoir.
HANEY3040of the polymer solution onto capillary R4 occurs. There follows a broadnegative peak as the holdup reservoir B is gradually purged by the mobilephase. The next injection can be made after the baseline is restored. Afaster alternative is to switch the valve back to BYPASS position after thepeak is eluted and use the gear pump to flush the holdup reservoir withfresh mobile phase solvent. The valve can then be switched back to INJECTposition, and the baseline is quickly restored.Calculation of Specific ViscosityThe measured quantities are bridge inlet pressure Pi, measured withrespect to the outlet, and the differential pressure at any point in time AP.where P I is the pressure drop across R3and P2 is the pressure drop acrossR4.Since the same solution is flowing through equal flow resistances R1and RS,Pi 2P1:Applying Poiseuille’s law to R, and R4,where Q1 is the flow rate through R,, R3,Q2 is the flow rate through R2,R4,q is the viscosity of the solution, and q0 is the viscosity of the solvent.The ratio of flow rates Q2Q1is equal to the inverse ratio of the total resistance in each side of the bridge:Combining eqs. (2H4)yieldsInserting the definition of specific viscosity in eq. (5) yields
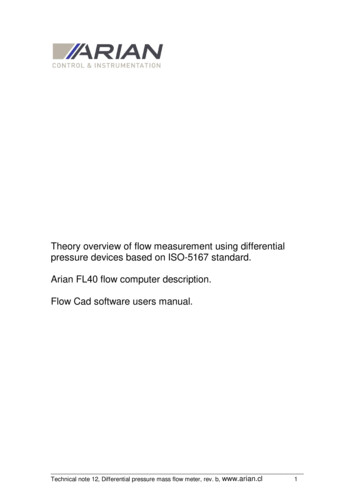
DIFFERENTIAL VISCOMETER. I13041which may be rearranged torlsp 4APP, - 2AP(7)Equation (7) is an exact equation subject to the following assumptions:-The capillaries have equal flow resistances. This condition can be obtained by trail and error to any desired degree of accuracy.-The flow is in accord with Poiseuille’s law. This law is typically validfor low flow rates and larger LID ratios of the capillaries.Design and ConstructionA plumbing schematic of the viscosity detector is shown in Figure 3.Construction is the same as for the viscometer configuration of Ref. 8, exceptfor the capillaries and reservoirs. For the present experiments the capillaries are made of coiled stainless steel tubing 0.010 in. ID x 0.0625 in.OD, approximately 30 in. L. The reservoirs are made of coiled stainlesssteel tubing 0.125 in. OD x 0.107 in. ID x 5 ft L with internal volume of8 mL.Connection to SEC1The viscosity detector must be used in conjunction with a concentrationdetector such as a refractive index detector (RID). In principle, the viscosityrl- nsducerIII/IiIFilterC\SECOutI AWSECInxnenISolvantinFig. 3. Detailed plumbing schematic of DV detector.
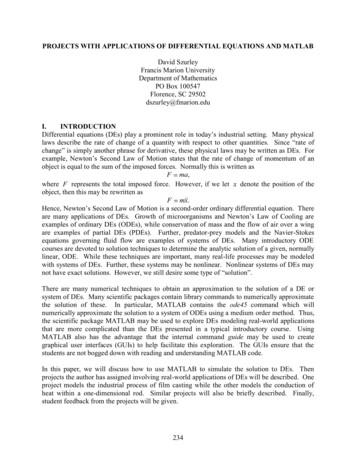
HANEY3042detector can be connected in three different positions with respect to theRID. Each of these configurations presents particular problems.DV before RID. The basic problem here is that the SEC effluent is dilutedby a factor of 2 as it passes through the viscosity detector.DV after RID. The viscosity detector presents a back pressure on theRID cell, which, if it becomes excessive, could break the cell. Also, mostRID units have large bore tubing on the outlet. This will cause excessivebandspreading in the DV chromatogram.Parallel. The flow resistance of each detector including correcting linesshould be approximately equal, although it is not strictly necessary. Thiswill require some adjustment of the length of connecting tubing to the twodetectors.It can be seen that the parallel configuration is generally more advantageous. The data reported here were obtained with this configuration. Ablock diagram of the SEC system is shown in Figure 4.The pneumatic pulsedampener shown is a coil of teflon tubing 0.125 in. OD x 18 in. L sealedat the end and filled initially with air. When the flow is turned on thesolvent pushes partly into the tubing, reaching an equilibrium static pressure. This simple pneumatic dampener has been found to be adequate forthe present experiments. For long term service the pump should be dampened directly.Chromatographic ConditionsRefractive index detector, DuPont; columns, 1 pair of DuPont PSM bimodals; mobile phase, tetrahydrofuran; flow rate, 1.5mL/min; temperature,ambient; injection volume, 50 pL.RESULTS AND DISCUSSIONThe advantage of the balanced bridge concept is dramatically illustratedin Figure 5, which shows a chromatogram of NBS 706 polystyrene standardwhile monitoring the differential pressure A P and the inlet pressure Pisimultaneously on the strip chart recorder. Figure 5(a) shows the chromatogram with the pulse dampener removed. The pulsations due to thepump are clearly visible in both the inlet pressure and the differentialpressure traces. Note, however, that the pulsation noise on the APtrace isPulseDifferentialRefractometer* --%DamoenersampleSEC ColumnswmteDlflefentlll-VIFig. 4. Block diagram of SEC system including DV detector.
DIFFERENTIAL VISCOMETER. I1Inlet Pressure30431600 PaIIYIe.-c00.-eQ)1.4 Pa-inlet PressurePP(b)Fig. 5. DV chromatogram of polystyrene sample NBS 706: (a) no pulse dampening; (b) pulsedampened.
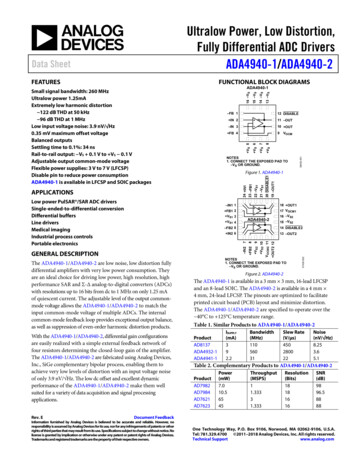
HANEY3044more than 1000 times lower than the pulsation noise on the inlet pressuretrace. This large reduction is due to the cancelling of the flow pulsationson each side of the bridge. It vividly illustrates the advantage of the balancedbridge approach over the single capillary viscometer. In Figure 50 ) thepulse dampener has been added, and now the pulsations are barely visibleon the inlet pressure and are buried in the random noise of the differentialpressure. The random noise (p-p) of the AP is 0.2 Pa, which together withthe measured P,of 30.6 kPa yields a specific viscosity of 2.7 xfromeq. (7). This noise level is approximately equal to the inherent noise of thecan be taken as thedifferential pressure transducer so that 2.7 xminimum detectable specific viscosity. Figure 6 is a dual chromatogram ofthe polystyrene standard using both the DV detector and the RI detectorconnected in parallel. The amount of sample injected is only 25 pg, but theDV peak shows ample sensitivity, even better than the RI peak. The weightaverage molecular weight of this sample is about 250,000 and the numberaverage molecular weight is about 115,000.Figure 7 is a dual chromatogramof a polyvinylchloride sample of unknown molecular weight. Observe thatthe S/N of the DV chromatogram is several times better than the RI chromatogram. Figure 8 is a dual chromatogram of a polybutadiene of molecularweight 3400. The SIN is comparable for the two detectors in this case.Figure 9 is a dual chromatogram of an epoxy resin of molecular weight300-400. Now the S/N of the DV is considerably worse than the RI. Figure10 is a dual chromatogram of a polymer additive, Irganox 1010, which hasa discrete molecular weight of 1120.The bandspreading of the DV detector can be measured from the peakwidths of Figure 10 since this compound has a single discrete molecularweight. The peak width at half height for the RI peak is 0.24 mL and forthe DV peak it is 0.29 mL. The DV detector adds 0.05 mL additional bandspreading compared to the RI detector. The quantitative implications ofDifferentlal Refractometw----/ \-si/-7IVDifferential ViscomelerFig. 6. Dual chromatogram of polystyrene sample NBS 706. Concentration injected 0.5mg/mL, volume 0.05 mL.
L\Dlfferentlal VlscometerIFig. 7. Dual chromatogram of polyvinylchloride sample. Concentration injected 1.1 mg/mL. volume 0.05 mL.\
P--
DIFFERENTIAL VISCOMETER. I13047.MEwI1
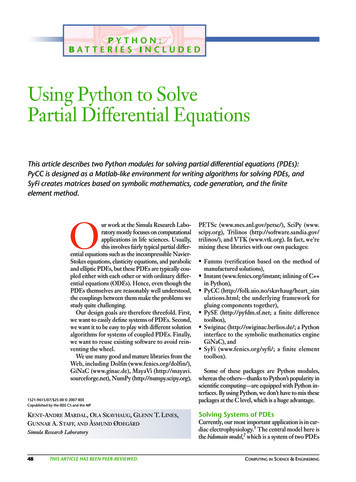
HANEY3048f--ccvIIiiEi-IFig. 10. Dual chromatogram of polymer antioxidant Irganox 1010. Concentration injected 1.8 mg/mL, volume 0.05 mL.this bandspreading will be assessed in future work. Qualitatively, it doesnot appear to have much effect. Observe the high molecular weight shoulderon the epoxy chromatogram in Figure 9. The apparent resolution of theshoulder is about the same in both the RI and DV traces. Bandspreadingcan be decreased by using smaller capillary tubing in the DV, if this provesnecessary. The primary application of the DV detector is for universalcalibration, which is beyond the scope of the present paper. The quantitativeapplication to universal calibration determination of molecular weight distributions will be investigated in subsequent publications. However, the DVdetector is very similar to the differential viscometer of Ref. 8, which hasbeen shown to yield excellent quantitative measurements of intrinsic viscosities.The strong dependence of the sensitivity of the DV on molecular weightis expected, of course. The intrinsic viscosity of polymers is related to themolecular weight by the Mark-Houwink equationwhere K and a are empirically determined constants. The exponent a t y pically lies in the range of 0.5-0.8.
DIFFERENTIAL VISCOMETER. I13049CONCLUSIONSThe application of the balanced bridge concept of differential viscometryto viscosity detection of SEC effluents yields sensitivity vastly superior tothat obtained with single capillary viscometers. Sensitivity of the DV detector is a function of molecular weight, of course, being superior to thatof an ordinary RI detector at molecular weights of only few thousand andabove. Band broadening is not excessive within the resolution capabilitiesof typical SEC columns.The excellent sensitivity and adequate resolution obtained with the DVshould make it a practical detector for use in the universal calibrationmethod. However, it is to be noted that its utility is not limited to theuniversal calibration method. When used in SEC in combination with aconcentration detector it will measure the intrinsic viscosity distributionof any polymer, regardless of the applicability of universal calibration. Formany practical polymer applications the intrinsic viscosity distribution willbe nearly as useful as the molecular weight distribution.The assistance of Dwight R. Hayes, Jr., in all phases of this work is gratefully acknowledged.References1. R. C.Jordan, J. Liq. Chromatogr., 3, 439463 (1980).2. M.Benoit, F. Grubisic, and R. Rempp, J. Polym. Sci, B, 5, 753 (1967).3. W.W.Fish, J. A. Reynolds, and C. Tanford, J. Bwl. Chem., 245, 5166-5168 (1970).4. R. P. Frigon, J. K. Leypoldt, S. Uyeji, and L. W. Henderson, Anal. Chem., 55, 1349-1354(1983).5.A. C.Ouano, J. Polym. Sci., A-1, 10,2169-2180 (1972).6.D.Lecacheux, J. Lesec, and C. Quivoron, J. Appl. Polym. Sci., 27, 48674877 (1982).7.F. B. Malihu, C. Kuo, M. E. Koehler, T. Provder, and A. F. Kah, Prep., Org. Coat. Plast.Chem., Diu. A m Chem. Soc., Seattle 1983,p. 760.8. M.A. Haney, JAPS 5691.Received October 22, 1984Accepted November 19, 1984
The Differential Viscometer. 11. On-Line Viscosity Detector for Size-Exclusion Chromatography MAX A. HANEY, Viscotek Corporation, 1030 Russell Dr., Porter, Texas 77365 Synopsis The new technique of differential