Transcription
Minitab@Oneonta.Manual:Selected Introductory Statistical and Data Manipulation ProceduresGordon & Johnson2002 Minitab version 13.0
Minitab@Oneonta.Manual:Selected Introductory Statistical and Data Manipulation ProceduresThis manual was donated by the authors to support the James A. Fraley Scholarship Fund.Authors:Lisa A. Gordon, Adjunct Lecturer: Statistics, Department of Mathematical Sciences, SUNY OneontaSteven D. Johnson, Senior Staff Associate, Institutional Research & Adjunct Lecturer: Statistics, Department of Mathematical Sciences, SUNY OneontaComments & Suggestions:Comments and suggestions may be forwarded to: GORDONLA@ONEONTA.EDU or JOHNSOSD@ONEONTA.EDU.James A. Fraley Scholarship:This manual was donated to support the James A. Fraley Scholarship at the SUNY College at Oneonta. All proceeds aid in the growth of the scholarship’s endowment.The Fraley scholarship assists students majoring in the field of statistics at SUNY Oneonta. For information about the Fraley Scholarship contact the Department ofMathematical Sciences, Fitzelle Hall, SUNY, Oneonta NY 13820 (607-436-3708).Printing:First Printing: August 2000. Revised/reprinted July 2001, August 2002Disclaimer:This document is intended for the use by students in STAT 101: Introductory Statistics and STAT 141: Statistical Software: Minitab, both courses offered at SUNYOneonta. It is not intended to be a comprehensive documentation of all that Minitab can provide with regard to a particular statistic or test. The content of the documentmay change as needed to meet its function as a reference manual for STAT 101/141. No living trees were harmed in the printing of this manual.Copyright:Copyright 2000, 2001, 2002 by the authorsNo rights reserved. Any part of this publication may be reproduced for educational purposes provided that appropriate credit is given to its authors and SPSS, Inc. Use onthe SUNY Oneonta campus must be coordinated through the authors and the Department of Mathematical Sciences.MINITABTM is a trademark of Minitab, Inc. and is used herein with the owner’s permission. The inclusion of Minitab Statistical Software input and output contained inthis manual is done with permission of Minitab, Inc. Screen shots were taken from Minitab version 13.0. For additional documentation, FAQ’s, etc. go to Minitab’s website at http://www.minitab.com.Tempus Fugit. Carpe Diem. Some assembly required.
TABLE OF CONTENTSTABLE OF CONTENTS. 1INTRODUCTION . 3THE MINITAB ENVIRONMENT:GETTING STARTED WITH MINITAB. 6PROJECTS AND WORKSHEETS. 9MINITAB STATISTICAL PROCEDURES:BAR CHART. 11BASIC STATISTICS (Descriptive Statistics) . 12BINOMIAL RANDOM VARIABLES (Calculating Probabilities) . 14BINOMIAL RANDOM VARIABLES (Obtaining a Probability Distribution). 16BOXPLOT (BOX-AND-WHISKER PLOT) . 17CHI-SQUARE ( χ 2 ): Test of Indepedence. 19COEFFICIENT OF DETERMINATION (r2) and the SUMS OF SQUARES IN LINEAR REGRESSION . 20CONFIDENCE INTERVAL FOR ONE POPULATION PROPORTION . 22CONFIDENCE INTERVAL FOR µ (σ UNKNOWN): ONE-SAMPLE t . 23CONFIDENCE INTERVAL FOR µ (σ KNOWN): ONE-SAMPLE Z. 24CROSS TABULATION TABLE (Contingency Table) . 25DISCRETE RANDOM VARIABLES (Obtaining a Probability Histogram) . 27DISCRETE RANDOM VARIABLES (Simulation) . 29DOTPLOT . 30FITTED LINE PLOT(Linear Regression). 31FIVE-NUMBER SUMMARY. 33FREQUENCY POLYGON/AREA GRAPH. 34HISTOGRAM. 35HYPOTHESIS TEST FOR ONE POPULATION PROPORTION . 36HYPOTHESIS TEST FOR µ (σ UNKNOWN): ONE-SAMPLE t. 37HYPOTHESIS TEST OF MEAN (σ KNOWN): ONE-SAMPLE Z . 38LINE GRAPH. 391
LINEAR CORRELATION. 40LINEAR REGRESSION . 41MEASURES OF CENTER . 43MEASURES OF VARIATION. 44NORMAL DISTRIBUTION (Probabilities for a Normally Distributed Variable). 45NORMAL PROBABILITY PLOT. 46NORMALLY DISTRIBUTED VARIABLE (Determining an Observation Corresponding to a Specified Percentile) . 48NORMALLY DISTRIBUTED VARIABLE (Simulating a Normal Distribution). 49PARETO CHART . 50PIE CHART . 51SAMPLING DISTRIBUTION OF THE MEAN (Obtaining Means for Generated Samples) . 53SAMPLING DISTRIBUTION OF THE MEAN (Simulation) . 54SCATTERPLOT. 55SIMPLE RANDOM SAMPLE (SRS) . 56STEM-AND-LEAF PLOT. 58TALLY . 60MINITAB DATA MANIPULATION:CALCULATE. 62CODE. 65DATA ENTRY . 67DISPLAY DATA. 72EDITING A WORKSHEET. 73EDITING CHARTS AND GRAPHS: TOOL AND ATTRIBUTE PALETTES. 76EXPORTING TABLES AND GRAPHS . 78PATTERNED DATA . 79PROJECT MANAGER . 82REPORTPAD . 84SPLIT WORKSHEET . 85APPENDIX A: Data File Descriptions. 86APPENDIX B: CONDUCTING A HYPOTHESIS TEST. 87INDEX . 882
INTRODUCTIONThis manual is intended as a reference guide to the Minitab statistical software package used by students in the introductory statistics classes at SUNY Oneonta. Themanual provides a "how to" approach to each topic presented. It does not discuss every option available for a given topic, but rather provides sufficient instruction toobtain the basic output one might need at an introductory level. At the same time, this is not a statistics text. Therefore, the user will need to refer to a statistics text fordefinitions and further clarification of the procedures presented herein.DOCUMENT OVERVIEWMost topics are presented on no more than one or two pages and include a brief overview, a PATH that lists the steps to follow, and an EXAMPLE of how to use thestatistical topic. Within each procedure’s Example, Minitab screen shots show how to access and complete the desired Minitab command. Minitab output is presented sothat the user may see the results of the command selected. In many cases the output is "enhanced" through superimposed notes, which point out various components ofthe output.CONVENTIONS USED IN THE MANUALThere are a number of conventions or means of presenting information that are constant throughout the manual. As one initiates a Minitab command, a Dialog Box willopen. It is within these Dialog Boxes that one will enter all the information needed to produce the desired output.PATH: All bold print, the PATH indicates all steps needed to successfully complete the minimum requirements for the Minitab command to provide output.OPTIONS: With the selected Minitab command, using the Options noted below the PATH will provide additional output or enhance the output.ADDITIONAL REQUIREMENTS: For some Minitab features it is necessary to go to a second Dialog Box and enter additional information BEFOREselecting the Ok button.RELATED GRAPHS: For some statistical procedures a reference may be made to a related graph.RELATED STATISTICAL PROCEDURE: For some Tables and Graphs a related statistical procedure may be noted.PROCESS: A PROCESS notation includes steps that do not directly produce output, but rather serve as an intermediate step leading to output.'VARIABLES' used in the examples appear in bold, all capital letters within single quotation marks."Cells" into which one would enter information are presented in bold lettering within double quotation marks.Words in bold italics are cross-referenced through the document index.Underlined words or numbers are meant as values to be entered into an identified cell of a dialog box.3
ORDERING OF TOPICSThe contents of this manual have been broken into three sections.Section 1: The Minitab Environment - provides information on how to get started using Minitab.Section 2: Statistical Procedures - provides an overview of many statistics and graphs encountered in an introductory statistics course.Section 3: Data Manipulation - provides information on many way to enhance/modify Minitab worksheet data files. These procedures are not necessary to obtainstatistical output, but do facilitate data analysis.DATAThe data used for examples throughout this manual were selected from worksheets that are distributed with Minitab. They may be accessed from within Minitab using thefollowing PATH: File Open Worksheet set the "Look in:" cell to the Data folder select the desired data file Open. Minitab will indicate that it isopening the worksheet in the current project. Select OK and the worksheet will be opened in the project.The data sets used in this manual are noted below. A key to their content is located in the manual's Appendix A. Descriptions for all Minitab sample worksheets may befound by using the following PATH: Help Search Help Index enter data file name select file Display.DATA FILES:Data: Market.MTWData: Pulse.MTWData: Schools.MTWData: Track15.MTW4
THE MINITAB ENVIRONMENT:HOW TO GET STARTED USING MINITAB5
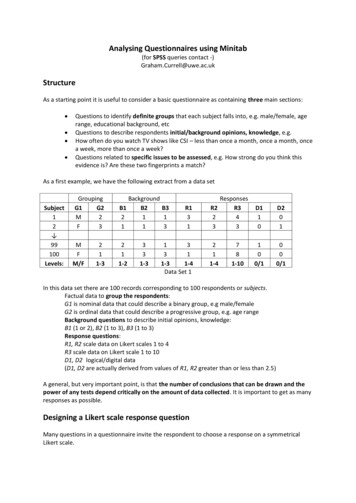
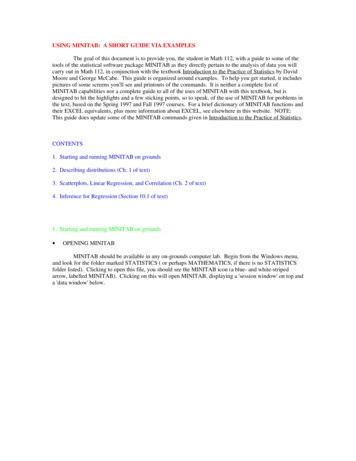
GETTING STARTED WITH MINITABWHERE TO FIND MINITAB: Minitab can be accessed from virtually any PC-based computer lab on campus. For a listing of the on-campus computer labs and hours ofavailability, go to the following URL: http://www.oneonta.edu/ocs/sti/computer map.htmlHOW TO ACCESS MINITAB: The location of the Minitab icon may varyfrom one lab to another. In most cases, it will be located on the desktop in afolder named Mathematics or Student Applications.TO START MINITAB: double-click on the Minitab icon. The followingwill appear:6
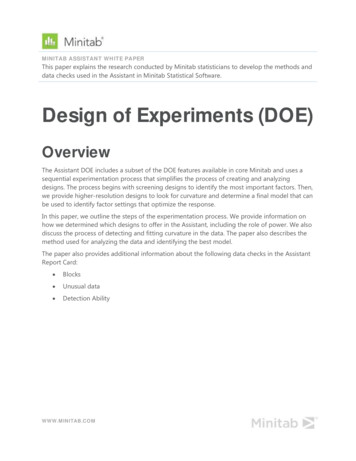
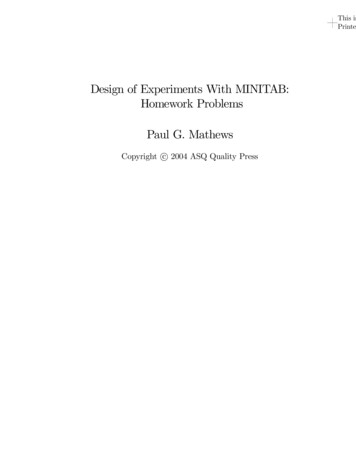
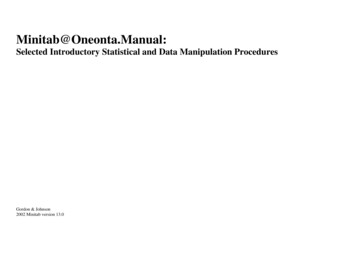
To open a Worksheet or Project: PATH: File Open Worksheet or Open Project select a data file Open.Minitab Windows:Session WindowThe Session Window displays text output of the analysisfor an active worksheet.The Graph Windows displays all graphs (up to 15) that arecreated. Each graph will appear in its own window.GraphWindowData Window (Worksheet) displays the worksheet(s) being used.DataWindow7
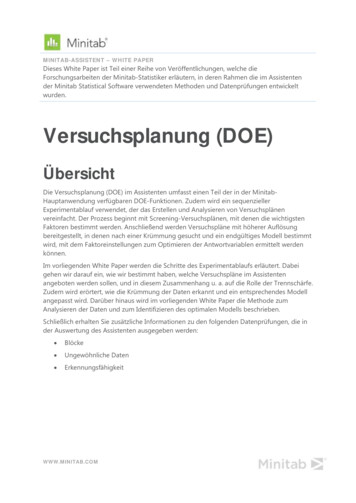
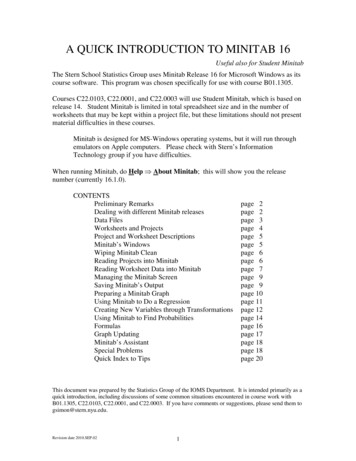
Project Manager: A Project Manager serves as framework within which the previously noted windows and those noted below are organized. Additional windows include:Info Window which contains a listing of variables and their characteristics.History Window in which an ongoing log of commands, etc. is maintained.ReportPad Window which serves as a mini word processor for the compilation of related tables, graphs, etc.Among the icons listed just below the main menu are a number that represent direct links to these six windows.Session & Worksheet toggle iconsand Project Manager IconComponents within the Project manager:Session, Worksheet, Graph, Info, History and ReportPadicons that open within a Project Manager formatExample showing Info Window and its correspondingWorksheet within the Project Manager framework.8
PROJECTS AND WORKSHEETSEach time Minitab is opened without specifying a file, a new (empty) Project will appear. A Project contains a Worksheet or Worksheets, Session Window output, and anyassociated graphs. Saving a Project saves all of these components. Upon reopening the project, all windows will reappear as they were when saved. A Worksheet contains allthe data from a data set. It represents one of several components of a Minitab Project.
BAR CHART A Bar Chart is a chart used to present a frequency distribution. It consists of bars (rectangles) of equal width. The lengths of the bars are proportional to the frequencies they represent. DATA: Pulse.MTW PATH: Graph Cha