Transcription
2020National Addiction IndustrySALARY SURVEY 2020 National Association of Addiction Treatment ProvidersAll Rights Reserved
2020 National Addiction Industry Salary SurveyPUBLISHED BY THE NATIONALASSOCIATION OF ADDICTIONTREATMENT PROVIDERSPrepared by:OMNI InstituteNatalie Wheeler, PhD Senior Researcher899 Logan Street, Suite 600Denver, CO onal Association ofAddiction Treatment ProvidersMarvin Ventrell, Chief Executive OfficerKatie Strand, Chief Operating Officer1120 Lincoln Street, Suite 1104Denver, Colorado 80203888.574.1008info@naatp.orgnaatp.orgLead StaffPeter ThomasDirector of Quality AssuranceKayla HuettProgram CoordinatorBoard of Directors ChairJohn Driscoll, Sr. VP of Recovery ServicesHazelden Betty Ford FoundationNAVIGATION TIPWhen clicked this icon links you to additionalinformation and resourcesLimit of Liability/Disclaimer of Warranty:The publisher, authors, and the National Association of AddictionTreatment Providers make no representations or warrantieswith respect to the accuracy or completeness of the contentsof this report and specifically disclaim any implied warranties.The information contained in this report is not intended to serve asa replacement for professional compensation and benefits advice.A human resource professional or other professional should beconsulted where appropriate.2
TABLE OF CONTENTSIntroductionThe National Addiction Industry Salary Survey 20202020 National Addiction Industry Salary Survey44Survey ParticipantsLocationOrganizational Profit StructureGross Annual RevenueOrganizational Classification by Type of FacilityType of Treatment ProvidedService AreaAffiliations, Licenses, and MembershipsOrganization Services DeliveredSources of RevenueFacility CapacityNumber of Clinical and Medical Staff per Type of Patient556689101011111213Staff CharacteristicsTotal StaffStaff DemographicsExecutive and Management Staff DemographicsContractors1414151617SalariesExecutive Management PositionsManagement PositionsClinical/Medical StaffSupport Staff1818202429BenefitsPaid Time OffAnnual Salary IncreasesHealth InsuranceOther Health BenefitsRetirement BenefitsAdditional Employee BenefitsCost of Employee BenefitsCost of Health Insurance333436363839414445Conclusion463
INTRODUCTIONThe National Association of Addiction TreatmentProviders (NAATP or The National Association)is a National not-for-profit membershiporganization of addiction treatment serviceproviders and supporters. The mission of TheNational Association is to provide leadership,advocacy, training, and member supportservices to assure the availability and highestquality of addiction treatment.Established in 1978, NAATP serves as theleading voice for addiction treatment providersin North America. Together with over 900treatment facilities as members, The NationalAssociation plays a strong leadership role onbehalf of addiction treatment providers in lawand public policy, practice standards, education,training, research, clinical and operationalresources, ethics, and business development.2020 National Addiction Industry Salary SurveyThe National AssociationAddiction Industry Salary Survey 2020In 1986, NAATP conducted the first ever salary surveywithin the addiction treatment provider industry,recognizing that a salary survey is an essential tool tohelp members of our field attract and retain top talentand provide high quality addiction service and care.The 2020 survey is the 12th salary survey producedby The National Association. The survey includedquestions related to location, leadership, staffing andbenefit structures, service and revenue information,salary information, employee benefits, and staffdemographics. We hope that this information willbe useful in helping benchmark your organizationregarding services offered, diversity of staff, benefits,and salaries.Data for the 2020 salary survey was collected online,via a survey hosted on Qualtrics. Data collectionbegan on April 1, 2020, and ended on August 14, 2020.Respondents completed the survey entirely online. Ifan organization had branches in different locations,a separate survey was completed for each location.Survey responses were then exported for analysis andthe final report was completed in October 2020.A total of 141 organizations participated in thesurvey, which represents 14% of NAATP membership.The participation in the 2020 survey represents a23% decrease in the number of organizations thatparticipated in the 2018 salary survey. The primaryreason for this decrease is the ongoing COVID-19pandemic. Data collection started three weeks afterthe World Health Organization declared COVID-19a worldwide pandemic. During the data collectionperiod, treatment providers were required to rapidlyadapt to new challenges to continue to provideservices. Each organization generously donated theirtime and data. NAATP and our field owe a debt ofgratitude to them. They exemplify the collegiality andcollaboration that NAATP stands for and encouragesfrom all our members. The next NAATP salary survey ofaddiction treatment providers will take place in 2022.To provide feedback, please go to:www.naatp.org/salary-survey-feedback-form4We welcome feedback from our members andothers within the addiction treatment industryto ensure that this report continues to provideuseful and actionable information to help addictiontreatment providers attract talent and strengthenservice offerings. Return to Table of Contents
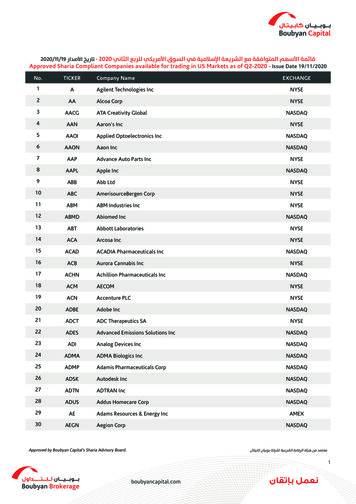
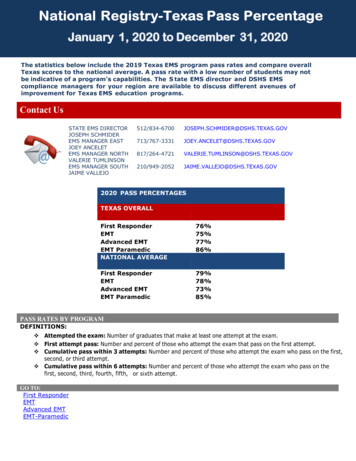
SURVEY PARTICIPANTS2020 National Addiction Industry Salary SurveyA total of 141 organizations/branches completed the 2020 National Addiction Industry Salary Survey.One hundred and forty of the providers were based in the United States, with one in Canada.LocationThe Southern and Western regions of the United States accounted for over half the sample. However, providersfrom all regions of the United States were represented in the %West2820%Northeast96%Canada11%When asked to describe the organization’s location, over half of participants described their location as urban(60%). Other participants were in rural areas (17%) and suburban areas (23%). Urban areas were defined as anarea with greater than 50,000 inhabitants, suburban areas were defined as areas with between 2,500 and 50,000inhabitants, and rural areas were defined as areas with less than 2,500 inhabitants1.Location 17%1. 12GARM.pdf5 Return to Table of Contents
SURVEY PARTICIPANTS2020 National Addiction Industry Salary SurveyOrganizational Profit StructureHalf of the organizations reported having a nonprofit organizational structure (51%) and half of the organizationsreported a for-profit organizational structure (48%).Profit StructureFrequencyPercentNonprofit Organization7251%For-Profit Organization6848%11%MissingGross Annual RevenueNearly half of organizations surveyed reported gross annual revenue of less than 5 million (49%). Twelve of the141 respondents (9%) did not answer this question. Note that some response options were combined for thepurposes of reporting to create more meaningful categories. For example, the response options “25-35 million”,“35-50 million”, and “over 50 million” were combined to create the category More than 25M.Gross Annual RevenueFrequencyPercentLess than 1.5M2115% 1.6M - 3M2014% 3.1M - 5M2820% 5.1M - 12M2719% 12.1M - 25M1511%More than 25M1813%Missing129%6 Return to Table of Contents
1120 Lincoln Street, Suite 1104Denver, Colorado 80203888.574.1008info@naatp.orgnaatp.org
OMNI Institute Natalie Wheeler, PhD Senior Researcher 899 Logan Street, Suite 600 Denver, CO 80203 303.839.9422 nwheeler@omni.org omni.org For: National Association of Addiction Treatment Providers Marvin Ventrell, Chief Executive Officer Katie Strand, Chief Operating Officer 1120 Lincoln Street,