Transcription
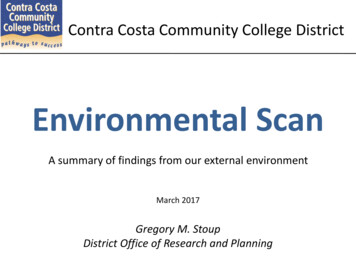
Contra Costa Community College DistrictEnvironmental ScanA summary of findings from our external environmentMarch 2017Gregory M. StoupDistrict Office of Research and Planning
Areas covered1. County Demographics Age distributionEthnicity profileOrigin of Birth / Language spokenEducational Attainment2. Market for High School Graduates Feeder school performance and trends Capture rates3. Workforce & Income Summary Labor market trends Income and housing market strength
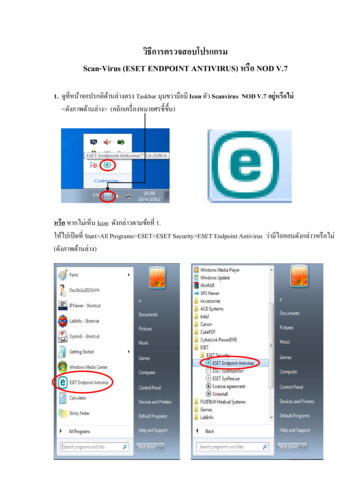
CCCCD Fall Headcount since 197845,000Peak of Recession42,500Peak of RecessionPeak of Recession40,00037,500BrentwoodCampus opens35,00032,50030,000San RamonCampus opensProp 13Fee Increase27,50025,000Enrollment Fees begin
CCCCD Fall Headcount since 1978Peak of RecessionPeak of RecessionPeak of RecessionDVCSan RamonCampus opensBrentwoodCampus opensCCCLMCPeriod ofdeclinePeriod ofgrowthTwenty year period of mostly flat growthwith episodes of punctuated enrollment
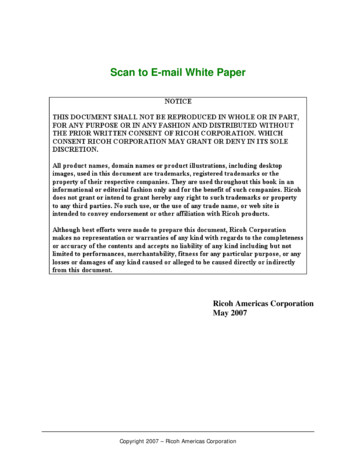
Environmental Scan GeographyWest CountyCCCCentral CountyEast CountyLMCDVCBrentwoodSan RamonContra Costa county was broken up into three regions usingcensus tracks associated with each college’s service area.
Contra Costa CountyDemographic Trends
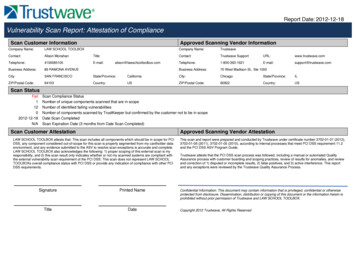
Contra Costa CountyDemographic Profile (2015)SizeGenderPopulation 1,096,068Growth Rate 10.6% per decadeFemale 51%Male 49%Age DistributionForeign Born Under 18 yrs old18 to 19 yrs old20-24 yrs old25-44 yrs old45-64 yrs old65 yrs old 24%2%6%26%28%14%Ethnicity DistributionAmerican IndianAsian / Pac Is.Black / Af. Am.HispanicTwo or More racesWhiteOther race 0.3% 15% 9% 24% 4% 48% 0.3% US Native Born 76%Foreign Born 24%Language Spoken at HomeEnglish Only 66%Other than English 34%Education AttainmentHigh School or lessAA/AS Degree or some collegeBachelors DegreeGraduate or Prof DegreeNote: Fastest growing groups by volume highlighted in orange 30%31%25%14%
Contra Costa County’s RegionsOverall populationEast CountyWest CountyThird largest region Home to roughly aquarter of a millionresidentsSlow growth Growing at a slowerrate than other regionsin the countyCentral CountySecond largestregion Largest region Houses more than halfthe county’s roughlyone million residentsModest growth Growing slightly slowerthan the countyaverageNote: Growth rates are derived from recorded population growth from 2010 to 2015.Data source: 2010 U.S. Decennial Census and 2015 5-Yr. American Community Survey (ACS).Slightly larger than theWest county with 284KresidentsRapid growth Fastest growing regionin the county
Age DistributionWest CountyMost diverse by age Most balanced agedistribution in countyAging by decline inyouth Net decline in residents19 and under and rapidgrowth of those 65 yrsand olderCentral CountyDeepest age pool Has more residents inevery age group thaneither the West or EastCountyAging by growth inelderly Has the highestconcentration of countyresidents 65 yrs oldOnly region experiencinggrowth in all age groupsNote: Growth rates are derived from recoded growth from 2010 to 2015.Data sources: 2010 U.S. Decennial Census and 2015 5-Yr American Community Survey.East CountyYoungest Highest concentrationof those 19 and under(30%) in countyU-Shaped growth Strong growth in boththe younger & olderage groups.
Ethnicity NarrativeWest CountyEthnically diverse Highest concentrationof residents of AsianAfrican Americansdecent.Central CountyLeast diverse Rapid decline ofAfrican-Americans Rapid decline in AfricanAmerican population(-9%)Slowest growth in AsianresidentsOnly area to experiencea significant increase inWhite residentsNearly two of everythree residents areWhite; all remainingethnic groups havinglower concentrationsthan the countyaverageEast CountyBimodal population Rapid growth amongminorities Growing more diverse Rapid growth amongAsian/Pac. Is AfricanAmerican and Two orMore RacesNote: Growth rates are derived from recoded growth from 2010 to 2015.Data sources: 2010 U.S. Decennial Census and 2015 5-Yr American Community Survey.Three of every fourresidents are eitherWhite or Hispanic Growth in residents ofTwo or More Racesoutpaced all otherethnic groupscombinedFastest growing regionamong Asian/Pac. Is.
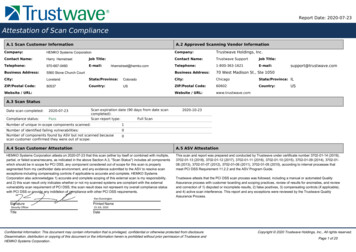
Distribution of Racial and Ethnicity Groups inContra Costa and Alameda CountiesMaps were taken from the New York Times online resource titled: Mapping America: Every City, Every Block(link: ef us).Map source data come from the Census Bureau's American Community Survey, based on samples from 2005 to 2009. Because these figures arebased on samples, they are subject to a margin of error, particularly in places with a low population, and are best regarded as estimates.
Origin of Birth and Language SpokenWest CountyOrigin of BirthHigh and growing densityof foreign born residents Highest concentration offoreign born residents(32%) and growing.Central CountyOrigin of BirthLow density but fast growthamong foreign bornresidents Language SpokenEnglish speakers soon tobe the minority Nearly half (47%) ofresidents don’t speakEnglish at home and thisgroup is growing at seventimes the rate of the restof the regionRoughly four in five residentsare Native US bornExperiencing the fastestgrowth of foreign bornresidents in the countyLanguage SpokenHighest density of Englishspeakers but transforming With roughly three in fourresidents speaking English athome the Central county hasa higher concentration ofEnglish speakers than thecounty overallNote: Growth rates are derived from recoded growth from 2010 to 2015.Data sources: 2010 U.S. Decennial Census and 2015 5-Yr American Community Survey.East CountyOrigin of BirthGrowth of foreign bornpushing region towardparity with the county Roughly three of fourresidents are Native US bornLanguage SpokenFastest growth among nonEnglish speakers One in three resident speaka language other thanEnglish at home and thenon-English speaking groupis growing faster here thanthe rest of the county
Education AttainmentEast CountyWest CountySlightly less educatedthan the county overall Nearly 39% of thepopulation has nomore than a HighSchool diplomaBut growing moreeducated 31% of residents have aBachelors degree orhigherCentral CountyHome to the mosteducated population Over 50% of thepopulation has aBachelors and/orgraduate degreeAnd growing still moreeducated The most growth isoccurring amongpeople with Bachelorsand graduate degreesNote: Growth rates are derived from recoded growth from 2010 to 2015.Data sources: 2010 U.S. Decennial Census and 2015 5-Yr American Community Survey.Least educated region Less than 20% of thepopulation hasbachelors or graduatedegreeStrong growth incommunity collegecredentials The fastest growingsegment are amongresidents with anAssociates Degree orhaving some college
Contra Costa CountyThe market for high schoolgraduates
Contra Costa CountyThe market for high school graduatesSizeGraduates 12,366 (2014)Growth Rate 9% (2014/15-2025/26)Projected 13,441 (2025)College-going Rates CCCsCSUsUCs Less than 25% 9% to 11.9% Greater than 6.5%CCCCD HS Graduate Capture Rate 3,456 of 12,366 28%Overall Remediation Rate Placement into dev ed 80%Enrolling in dev ed 45%Data sources: California Dept of Education. College-going rates from http://www.ppic.org/main/dataSet.asp?i 1232
Contra Costa CountyThe market for High School GraduatesLMCCCCDVCWeak growth Graduates of feederHigh Schools growing atone-fourth the rate ofthe countyModerate growth Capture rates stable CCC capture rates offeeder high schoolgraduates remainsstable at 26%, slightlybelow the countyaverage of 28%Data sources: California Dept of Education and Colleague.Graduation rate atfeeder HS is slightly lessthan the countyaverageCapture rates stable DVC capture rates offeeder high schoolgraduates remainsstable at 26%, slightlybelow the countyaverage of 28%Booming HSgraduate population Graduation rate atfeeder HS over the rateof the countyRising capture rates LMC capture rates offeeder high school isimproving, movingfrom below the countyaverage in 2000/01 to5% above in 2015/16
DVCFeeder high schools arehome to the mostacademically preparedCCCFeeder high schools aremidlevel performers As a group four all of CCC’sseven feeder high schoolsare below the state average.Two of the high schools havethe lowest performance. Of the District’s 29 primaryfeeder high schools, the 12highest ACT scores belong toDVC feeder schoolsAll but two of DVC’s feederhigh schools score above thestatewide average of 57.45LMCService area containssome of the lowestperforming high schools All but one of LMC’s sevenfeeder high schools scorebelow the state average.Source: California Department of Education: http://dq.cde.ca.gov/Dataquest. ACT scores range from 1 to 36 points. The percentage of scores 21 is used as a benchmark. This percentage iscalculated by dividing the "Number of Scores 21" by the "Number Tested.“ For more information on ACT, go to: http://www.cde.ca.gov/ds/sp/ai/glossaryact2014.asp
Contra Costa CountyWorkforce & Income
Contra Costa CountyWorkforce & Income ProfileLabor MarketJobs 530,221Proj Job Growth (2010-2016) 13.4%Unemployment Rate (2017) 4.3%Industries adding most jobs Services for the Elderly and Personswith DisabilitiesCorporate, Subsidiary, and RegionalManaging OfficesLimited-Service RestaurantsFastest growing Occupations Taxi Drivers and ChauffeursPersonal Care AidesFood Preparation & ServingData sources: U.S. Census Bureau; American Community Survey; EMSI Data reports.Household IncomeMedian Income 80,185 (2015)Income Growth 2.3% (2010-2015)PovertyIndividual Poverty Rate 10.9%All families 11.4%Families w/ children 17.3%Female Head of Household 24.8%Median Home ValueIn 2015 439,000Growth (2010-2015) (-19.8)
Distribution of Households Earning Under 30KContra Costa and Alameda CountiesMaps were taken from the New York Times online resource titled: Mapping America: Every City, Every Block(link: ef us).Map source data come from the Census Bureau's American Community Survey, based on samples from 2005 to 2009. Because these figures arebased on samples, they are subject to a margin of error, particularly in places with a low population, and are best regarded as estimates.
Contra Costa CountyWorkforce & Income ProfileWest CountyPockets of unemployment& high poverty At 4.1% the unemploymentrate is slightly lower than thecounty average overallThe poverty rate (14.5%) isthe higher than the countyaverage of 10.9%Stagnant income growth &struggling housing market Household incomes ( 62.9K)are below the countyaverage of 80.1K.Likewise, housing values aredeclining faster than thecounty average.Central CountyStrong labor market & lowlevels of poverty The unemployment rate(4.0%) and poverty rates(7.5%) remain below thecounty averageHigh income & high homevaluations At 95.1K householdincomes are the highest inthe county and growingthree times faster than thecounty average.Housing values are thehighest in the county at 615KData sources: U.S. Census Bureau; 2010 and 2015 5-Yr. American Community Surveys.East CountyHigher unemployment,weak job growth & growingpoverty Unemployment rates arehighest in the county at 5.4%At 19.8% the poverty rate isnearly double the countyaverage but the rate ofgrowth is fastest in the countyLow income & declininghousing market Household incomes arelowest in the county ( 55K).Median house values havedropped faster than otherareas in the county
West CountyCentral CountyEast CountyThird largest region;slow growthLargest region; modestgrowthSecond largest region;rapid growthAge DistributionMost diverse by age;aging by decline in youthDeepest age pool; agingby growth in elderlyYoungest age pool;U-shaped growthEthnicityEthnically diverse; rapiddecline of African-AmericansLeast diverse; growingmore diverseBimodal ethnicity;rapid minority growthOrigin of BirthHigh & growing densityof foreign bornLow density but fastgrowth in foreign bornModerate growth inforeign born residentsLanguage SpokenEnglish speakers soonto be minorityHigh density of Englishspeakers but changingEducation AttainmentSlightly less educatedbut growing more soMost educated andgrowing more soLeast educated; stronggrowth in AA degreesHS Graduate MarketWeak growth; stablecapture ratesModerate growth;stable capture ratesBooming growth;rising capture ratesFeeder HS ACT ProfileMidlevel performingHighest performingLowest performanceOverall populationLabor MarketIncome & HousingMarketPockets of unemployment; Strong labor market; lowlevels of povertyhigh povertyStagnant income;declining housing valueHigh income and highhome valuationsFastest growth amongnon-English speakersWeak job growth;growing povertyLow income & declininghousing market
THANK YOU!And special thanks to the Contra Costa District researchstaff who demonstrated outstanding data collection andresearch in support of the findings included in this report
Bachelors degree or higher. East County. Least educated region Less than 20% of the population has bachelors or graduate degree. Strong growth in community college credentials The fastest growing segment are among residents with an Associates Degree or having some college. Central C