Transcription
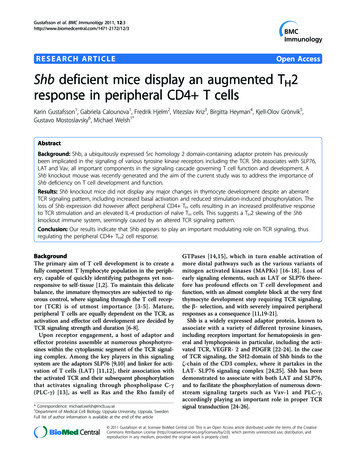
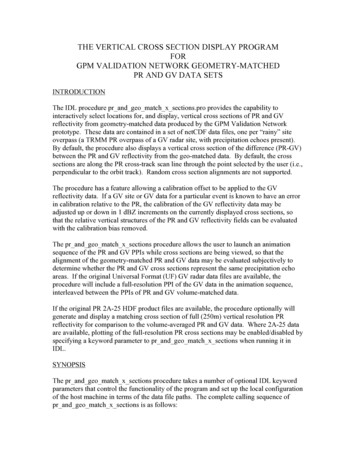
THE VERTICAL CROSS SECTION DISPLAY PROGRAMFORGPM VALIDATION NETWORK GEOMETRY-MATCHEDPR AND GV DATA SETSINTRODUCTIONThe IDL procedure pr and geo match x sections.pro provides the capability tointeractively select locations for, and display, vertical cross sections of PR and GVreflectivity from geometry-matched data produced by the GPM Validation Networkprototype. These data are contained in a set of netCDF data files, one per “rainy” siteoverpass (a TRMM PR overpass of a GV radar site, with precipitation echoes present).By default, the procedure also displays a vertical cross section of the difference (PR-GV)between the PR and GV reflectivity from the geo-matched data. By default, the crosssections are along the PR cross-track scan line through the point selected by the user (i.e.,perpendicular to the orbit track). Random cross section alignments are not supported.The procedure has a feature allowing a calibration offset to be applied to the GVreflectivity data. If a GV site or GV data for a particular event is known to have an errorin calibration relative to the PR, the calibration of the GV reflectivity data may beadjusted up or down in 1 dBZ increments on the currently displayed cross sections, sothat the relative vertical structures of the PR and GV reflectivity fields can be evaluatedwith the calibration bias removed.The pr and geo match x sections procedure allows the user to launch an animationsequence of the PR and GV PPIs while cross sections are being viewed, so that thealignment of the geometry-matched PR and GV data may be evaluated subjectively todetermine whether the PR and GV cross sections represent the same precipitation echoareas. If the original Universal Format (UF) GV radar data files are available, theprocedure will include a full-resolution PPI of the GV data in the animation sequence,interleaved between the PPIs of PR and GV volume-matched data.If the original PR 2A-25 HDF product files are available, the procedure optionally willgenerate and display a matching cross section of full (250m) vertical resolution PRreflectivity for comparison to the volume-averaged PR and GV data. Where 2A-25 dataare available, plotting of the full-resolution PR cross sections may be enabled/disabled byspecifying a keyword parameter to pr and geo match x sections when running it inIDL.SYNOPSISThe pr and geo match x sections procedure takes a number of optional IDL keywordparameters that control the functionality of the program and set up the local configurationof the host machine in terms of the data file paths. The complete calling sequence ofpr and geo match x sections is as follows:
pr and geo match x sections, ELEV2SHOW elev2show, SITE sitefilter,NO PROMPT no prompt, NCPATH ncpath,PRPATH prpath, UFPATH ufpath,USE DB use db, NO 2A25 no 2a25,PCT ABV THRESH pctAbvThresh Note that each keyword parameter is optional, and has a default value/behavior if leftunspecified. The use of each keyword parameter is as follows:ELEV2SHOW: sweep number of PR/GV PPIs to display for selection of the crosssection location, starting from 1 as the lowest elevation angle in the GV radar volume.Defaults to approximately 1/3 the way up the list of sweeps if unspecified.SITE: file pattern, which acts as a filter limiting the set of input files shown in the fileselector, or over which the program will iterate. Mode of selecting the (next) filedepends on the no prompt parameter. Default *NO PROMPT: method by which the next file in the set of files defined by NCPATHand SITE is selected. Binary parameter (e.g., /NO PROMPT or NO PROMPT 1 to setto On). If unset or set to 0, defaults to using DialogPickfile (IDL’s pop-up file selector).If set, then the program will automatically find the next file in the set, in order ofascending site ID and date.NCPATH: local directory path to the geo match netCDF files' location. Defaults to/data/netcdf/geo match if not specified. This parameter MUST be specified if thenetCDF files are not located under /data/netcdf/geo match on the local host.PRPATH: local directory path to the original PR product files root (in-common)directory. Defaults to /data/prsubsets. By convention, the 2A-25 data files must belocated in the /2A25 subdirectory located immediately under PRPATH.UFPATH: local directory path to the original GV radar UF file root (in-common)directory. Defaults to /data/gv radar/finalQC inNO 2A25: Binary parameter (e.g., /NO 2A25). If set, then the full-vertical-resolutionPR cross sections from the 2A-25 data will NOT be plotted by default, if the 2A-25 filesare available and PRPATH is properly specified. This means the program can be runusing only the geo match netCDF data files. If PRPATH is incorrect and/or the 2A-25files are NOT available, then this keyword parameter has no effect, and the procedurewill proceed without producing a display of full-resolution PR data.USE DB: Binary parameter. If set, then query the 'gpmgv' database to find the PR 2A25 product file that corresponds to the geo match netCDF file being rendered.Otherwise, generates a 'guess' of the filename pattern and searches for the file under thedirectory prpath/2A25 (default mode).
PCT ABV THRESH: constraint on the percent of full-resolution PR and GV binsaveraged into the geometric-matching volumes at or above their respective dBZthresholds, specified at the time the geo-match dataset was created (18.0 dBZ for PR,15.0 dBZ for GV). It is essentially a measure of "beam-filling goodness". 100 means useonly those matchup points where all the PR and GV bins in the volume averages wereabove threshold (the volumes are completely filled with above-threshold bin values). 0means use all matchup points available, with no regard for thresholds (the default, if nopctAbvThresh value is specified).RUNNING THE PROGRAM (IDL License Available)The following instructions apply to running the cross section procedure with a licensedcopy of IDL, or without an unlicensed copy, in time-limited evaluation mode. See theIDL Virtual Machine Option section for instructions on running the procedure with theIDL Virtual Machine.The pr and geo match x sections procedure is provided as a precompiled and savedIDL binary file: pr and geo match x sections.sav. To run the file, place it in adirectory of your choice, and start IDL (either command-line mode or DevelopmentEnvironment. At the IDL prompt (e.g., IDL ), change the current directory to the onewhere the pr and geo match x sections.sav file is located (the quotes in the examplecommands are required):IDL cd, ‘/Directory/Of/My/Choice’Then ‘restore’ the saved binary procedure so that it can be run:IDL restore, ‘pr and geo match x sections.sav’The procedure can then be run. At a minimum, the NCPATH parameter will need to bespecified on the command line so that the geo match netCDF file path is set. Forinstance, if the netCDF files are located under /Users/Chuck/data/netcdf/geo match, thenrun the procedure with NCPATH set as follows:IDL pr and geo match x sections, NCPATH ’/Users/Chuck/data/netcdf/geo match’The is a continuation character in IDL and allows you to enter a single command overseveral lines, for readability.If all is well the procedure should then start and the file selector user interface shouldappear and be populated with the list of geo match netCDF files, as shown in Fig. 1.
Figure 1. File selector for geometry-matched netCDF files.Once a file has been selected from the list in the File Selector, a pair of PPI images of thePR and GV volume-matched data in the netCDF file will be displayed (Fig. 2). If theELEV2SHOW parameter is unspecified, then the elevation angle that will be plotted inthe PPIs will be for the sweep that is about 1/3 of the way up in the list of elevations inthe GV volume scan, which is the 3.3 degree elevation sweep in the case shown in Fig. 2.Otherwise, if ELEV2SHOW N is specified as a keyword parameter, then the Nth sweepin the GV volume scan will be shown in the PPIs. Note that areas indicated as Stratiformrain type are shown on the PPIs with a horizontally-oriented line pattern, and areas ofConvective rain type are shown with a vertical line pattern. Samples where the rain typeis Unknown, are plotted with solid fill. Samples where a pattern appears but no color isshown indicate either a PR ray position where no valid reflectivity value is present at thedisplayed elevation, or where there is a valid reflectivity value but the sample does notmeet the “percent complete” criteria specified by the PCT ABV THRESH keywordparameter if the threshold specified and is non-zero.
Figure 2. PPIs of PR (upper) and GV (lower) volume-matched reflectivity, used for selecting crosssection locations. All available samples are shown in this example (i.e., PCT ABV THRESH 0).The patterned areas without color assignments show the locations of PR rays without valid volumematch data for this particular sweep elevation, but which do exist for other sweep elevations.To display a cross section, select a desired feature on either of the PPI images with thecursor, and click the left mouse button. An A-B line will be drawn along the PR scan linethrough the selected point on the PPIs (Fig. 3), and vertical cross sections of geometrymatched PR and GV data will be displayed in a separate window, as shown in Figure 4.Note that the PPI images use a different color table than the geometry-match crosssections. The color table of the PPIs aggregates the data into 5 dBZ steps, which is notsuitable for viewing small gradations or differences between reflectivity of the matchingPR and GV volumes. The cross sections use a smoothly varying color table that showsvariations of 1 dBZ or more between displayed volumes.
Figure 3. PR and GV PPIs showing the location of the user-selected cross section.
Figure 4. Vertical cross sections of geometry-matched PR (top) and GV (bottom) data along PR scanline through the user-selected location. All available samples are shown in this example (i.e.,PCT ABV THRESH 0).The vertical tick marks on either side of the cross section plots show the height above thesurface in 1-km steps. The cross section height range is from 0 to 20 km, and major tickmarks are at 5, 10, and 15 km. The displayed width of the cross sections is quasi-fixed sothat the plots are approximately square. Each column of data in the cross section showsone PR ray along the PR scan line being plotted, and represents approximately 5 km inthe horizontal. The displayed width of each PR ray is adjusted on the plot such that allPR rays between points A and B on the PPI are plotted on the cross section, and thesquare aspect ratio of the cross section plot is maintained. Where the sample volumesalong a given ray overlap in the vertical, the samples are divided at the midpoint of theoverlapping area for display purposes, and a 1-pixel-deep delimiter is plotted on theimage between overlapping or touching volumes to indicate the division betweenelevation sweeps.
The heavy dashed horizontal line in the vertical cross section plots indicates the meanheight of the bright band, as indicated in the PR level 2 product. Light dotted lines areplotted 500 m above and 750 m below the mean bright band. Any samples touching orfalling in the layer between these two heights are considered to be affected by the brightband in statistical analyses of the volume-matched data. Those samples completelyabove the upper line are considered to be above bright band in the statistics, and thosebelow the lower line are placed in the below bright band category. The orientation of thecross section relative to the PPIs is indicated by the letters A and B plotted on the crosssection and the PPIs.A PR-GV difference field will be computed for the selected cross section and displayedin a separate window, as seen in Figure 5. The difference field has its own unique colortable, where the warm colors (red, orange, yellow) indicate relatively ‘hot’ GV radarreflectivity samples (PR GV), and cool colors (green, blue, violet) indicate ‘cool’ GVradar samples (PR GV). Samples plotted in white are where PR and GV reflectivity arewithin 0.5 dBZ of each other.Figure 5. Cross section of reflectivity difference, PR-GV, from volume-matched data, for the caseshown in Fig. 4.If the PR 2A-25 product files are available on the local host, the PRPATH parameterpoints to the common directory above the /2A25 directory where these files are located,
and the NO 2A25 keyword is unset (unspecified or set to 0), then a second pair ofvertical cross sections showing the full-vertical-resolution PR reflectivity data will beplotted in a separate display window (Fig. 6). The upper panel in this set of crosssections shows the full-resolution PR data displayed using the same color scheme as thePPI images (Figs. 2 and 3), with 5-dBZ color steps. The lower panel shows the same datadisplayed using the smoothed color table of the cross section plots of the volume-matchPR and GV data as shown in Fig. 4, with a 1-dBZ resolution. If the NO 2A25 keywordparameter is set, or if it is unset and the 2A-25 data file cannot be found, then the plot offull-resolution PR data will be skipped.The full-resolution PR cross sections are not limited to the points with data in thegeometry-matching data. All PR gates are shown in the full-resolution PR cross sections(Fig. 6), while the geometry-matched data (Fig. 4) exist and are shown only at locationswhere the PR rays intersect the GV elevation sweeps, which are typically discontinuousin the vertical and have a ‘cone of silence’ centered above the GV radar.
Figure 6. Vertical cross section of full-vertical-resolution (250 m) PR reflectivity data from theoriginal, unaveraged 2A-25 attenuation-corrected reflectivity, for the case shown in Figs. 3-5. Thesame data are plotted in both panels – only the color table is different between the two.INTERACTIONS WITH THE PPI DISPLAYSelect A New Cross Section Location:The A-B line on Fig. 3, and the cross section displays of Figures 4-6 are updated eachtime the user selects a new point on the PPIs (Fig. 2), as long as the cursor is clickedwithin the PR/GV overlap area in the PPIs (dark gray or colored areas) using the leftmouse button. To exit the current case and allow selection of the next case, right-clickthe mouse with the cursor positioned the within the overlap area.
Start a PPI Animation Loop:Clicking on the small white square in the lower left of the GV PPI plot (Fig. 2 or 3) willlaunch another IDL procedure that will create an animation loop of the PPIs in a newwindow. This animation loop will contain a sequence of PPI images in the followingorder:1) Volume-match PR PPI at the level of the first elevation sweep2) Volume-match GV PPI at the level of the first elevation sweep3) As in (1), but for the second elevation sweep4) As in (2), but for the second elevation sweep.2*N–1) Volume-match PR PPI for the Nth elevation sweep2*N) Volume-match GV PPI for the Nth elevation sweepFigures 7 and 8 show examples of PR and GV PPI animation frames in the animationloop for the sample case of Figure 2.The user can let the animation run on its own, but it is more useful to pause theanimation, click on the slider bar, and then use the arrow keys on the keyboard tomanually toggle between adjacent frames to check the alignment of the echoes betweenthe PR and GV volume-matched data. This capability permits an analyst to make asubjective determination about the quality of the geometric alignment between the twodata sources to decide whether the PR-GV values in the difference cross sectionrepresents calibration and/or measurement differences between the two data types, or isdue to misalignment between the two data sources.The number of elevation sweeps included in the animation sequence matches the sweepnumber specified in the ELEV2SHOW parameter, or computed internally as the default(approximately one-third of the available sweeps) if ELEV2SHOW is not specified.Specifying a keyword value of ELEV2SHOW 1 causes an error if one then attempts tolaunch an animation sequence under this condition.If the original Universal Format (UF) file containing the GV radar volume for thedisplayed case is available and located under the directory pointed to by the UFPATHkeyword parameter, then the animation sequence will interleave a plot of the fullresolution GV radar PPI for each displayed sweep in the animation sequence. There willbe four PPIs for each elevation sweep displayed, in the following order:1)2)3)4)Volume-match PR PPI at the level of the elevation sweepFull-resolution GV PPI at the level of the elevation sweep (Fig. 9)Volume-match GV PPI at the level of the elevation sweepThe PR PPI of item (1), repeated in the sequence
This sequence is then repeated for each elevation sweep to be displayed. This allows oneto toggle back and forth between each of the data types: the volume-matched PR andfull-resolution GV; the volume-matched and full-resolution GV; and the volume-matchedPR and volume-matched GV.Figure 7. One PR frame of a PR and GV animation loop, showing volume-matched PR data for the2.4 degree elevation sweep of the GV radar.
Figure 8. As in Fig. 7, but for volume-matched GV data. The time difference between the PRoverpass and the GV radar sweep begin time is indicated in the plot title.While the animation window is present it takes over the cursor focus and nointeraction with the other PPI or cross section windows is possible. The animationwindow must be closed in order to select a new cross section location or a new case.
Figure 9. Full-resolution GV PPI from the original UF radar data file, if available, is interleavedwith corresponding PPIs of volume-matched data (Figs. 7, 8) in the animation loop.Apply a Calibration Adjustment to GV Reflectivity:A calibration offset may be applied to the GV reflectivity by clicking on the white boxeswith the and – signs on the GV PPI plots in the cross-section location selection window(Figs. 2 and 3). Once a set of cross-sections has been displayed, clicking on the or –sign will apply a 1 or -1 dBZ offset to the GV reflectivity and re-draw the existing crosssection plots with the calibration offset applied. Both GV cross sections (lower panel inFigure 4) and PR-GV difference cross sections (Figure 5) will be redrawn with the GVoffset applied. The effect is cumulative, so that each time a box is clicked the GV offsetincreases or decreases by 1 dBZ and the existing cross sections are redrawn. Figure 10shows a difference cross section for the KGRK radar, which had a 2-3 dBZ low biascompared to the PR. Figure 10 shows the difference cross section with no GV correction,and Fig. 11 shows the same cross section with a 3 dBZ offset applied to the GV, tobring the above-bright-band differences to near zero.Once an offset has been applied, it will automatically be applied to each new crosssection location selected for the current case (current matchup netCDF file). If a differentdata file is selected, the offset will be reinitialized to zero for its cross section selections.
Figure 10. PR-GV difference cross section for the KGRK WSR-88D radar with 0 dBZ GV offset.Figure 11. As in Fig. 10, but with a 3 dBZ calibration correction to the GV reflectivity.CONSTRAINING DATA QUALITYThe PCT ABV THRESH keyword parameter permits the analyst to constrain thevolume-match data shown in the selector PPIs and the cross sections of volume matchdata to only those samples where the percentage of original PR and GV bins in theirrespective volume averages had reflectivity values exceeding a cutoff threshold dBZ:18.0 for the PR, and 15.0 for the GV radar. Application of this data percentage thresholdis an attempt to limit the comparisons to points where partial beam filling of the samplevolumes is not an issue. Figure 12 shows the PR and GV PPIs of Fig. 2, and Figures 13and 14 show the PR and GV volume-match data cross sections of Fig. 4 and 5, but underthe c
IDL Virtual Machine Option section for instructions on running the procedure with the IDL Virtual Machine. The pr_and_geo_match_x_sections procedure is provided as a precompiled and saved IDL binary file: pr_and_geo_match_x_sections.sav. To run the file, place it in a directory of your choice, and start