Transcription
Gustafsson et al. BMC Immunology 2011, EARCH ARTICLEOpen AccessShb deficient mice display an augmented TH2response in peripheral CD4 T cellsKarin Gustafsson1, Gabriela Calounova1, Fredrik Hjelm2, Vitezslav Kriz3, Birgitta Heyman4, Kjell-Olov Grönvik5,Gustavo Mostoslavsky6, Michael Welsh1*AbstractBackground: Shb, a ubiquitously expressed Src homology 2 domain-containing adaptor protein has previouslybeen implicated in the signaling of various tyrosine kinase receptors including the TCR. Shb associates with SLP76,LAT and Vav, all important components in the signaling cascade governing T cell function and development. AShb knockout mouse was recently generated and the aim of the current study was to address the importance ofShb deficiency on T cell development and function.Results: Shb knockout mice did not display any major changes in thymocyte development despite an aberrantTCR signaling pattern, including increased basal activation and reduced stimulation-induced phosphorylation. Theloss of Shb expression did however affect peripheral CD4 TH cells resulting in an increased proliferative responseto TCR stimulation and an elevated IL-4 production of naïve TH cells. This suggests a TH2 skewing of the Shbknockout immune system, seemingly caused by an altered TCR signaling pattern.Conclusion: Our results indicate that Shb appears to play an important modulating role on TCR signaling, thusregulating the peripheral CD4 TH2 cell response.BackgroundThe primary aim of T cell development is to create afully competent T lymphocyte population in the periphery, capable of quickly identifying pathogens yet nonresponsive to self-tissue [1,2]. To maintain this delicatebalance, the immature thymocytes are subjected to rigorous control, where signaling through the T cell receptor (TCR) is of utmost importance [3-5]. Mature,peripheral T cells are equally dependent on the TCR, asactivation and effector cell development are decided byTCR signaling strength and duration [6-8].Upon receptor engagement, a host of adaptor andeffector proteins assemble at numerous phosphotyrosines within the cytoplasmic segment of the TCR signaling complex. Among the key players in this signalingsystem are the adaptors SLP76 [9,10] and linker for activation of T cells (LAT) [11,12], their association withthe activated TCR and their subsequent phosphorylationthat activates signaling through phospholipase C-g(PLC-g) [13], as well as Ras and the Rho family of* Correspondence: michael.welsh@mcb.uu.se1Department of Medical Cell Biology, Uppsala University, Uppsala, SwedenFull list of author information is available at the end of the articleGTPases [14,15], which in turn enable activation ofmore distal pathways such as the various variants ofmitogen activated kinases (MAPKs) [16-18]. Loss ofearly signaling elements, such as LAT or SLP76 therefore has profound effects on T cell development andfunction, with an almost complete block at the very firstthymocyte development step requiring TCR signaling,the b- selection, and with severely impaired peripheralresponses as a consequence [11,19-21].Shb is a widely expressed adaptor protein, known toassociate with a variety of different tyrosine kinases,including receptors important for hematopoiesis in general and lymphopoiesis in particular, including the activated TCR, VEGFR- 2 and PDGFR [22-24]. In the caseof TCR signaling, the SH2-domain of Shb binds to theζ-chain of the CD3 complex, where it partakes in theLAT- SLP76 signaling complex [24,25]. Shb has beendemonstrated to associate with both LAT and SLP76,and to facilitate the phosphorylation of numerous downstream signaling targets such as Vav-1 and PLC-g,accordingly playing an important role in proper TCRsignal transduction [24-26]. 2011 Gustafsson et al; licensee BioMed Central Ltd. This is an Open Access article distributed under the terms of the CreativeCommons Attribution License (http://creativecommons.org/licenses/by/2.0), which permits unrestricted use, distribution, andreproduction in any medium, provided the original work is properly cited.
Gustafsson et al. BMC Immunology 2011, 12:3http://www.biomedcentral.com/1471-2172/12/3A Shb knockout mouse has recently been generated.No viable Shb knockout offspring could be generated onthe C57Bl/6 background owing to an early embryonicdefect. However Shb null mice were obtained on amixed background (129Sv/C57Bl6/FVB) [27]. The animals display abnormalities in their reproduction, vasculature and glucose homeostasis [27-30]. We employedthe Shb knockout to assess thymus and T cell function.Although early T cell development appears unaffected,we observe hyperproliferation and a skewing towards aTH2 response in peripheral T cells.MethodsAnimalsThe generation of Shb knockout mice has beendescribed previously [27]. The animals were bred on amixed background (129Sv/C57Bl6/FVB). All experiments were approved by the local animal ethics committee at Uppsala University.Cell preparationFreshly isolated thymi and spleens were gently crushedthrough a 70 μm cell strainer (BD Bioscience, Erembodegem, Belgium) and thereafter treated with Red celllysis buffer (Sigma Aldrich, St. Lois, MO) in order toremove erythrocytes.Flow cytometryFor flow cytometry 1 106 cells in a final volume of 100μl 1% BSA in PBS were stained with the following antibodies CD4-FITC, CD8-FITC, CD4-PE-Cy5, CD8- PE,CD44-PE-Cy5, CD25-PE, and CD62L-PE (all antibodieswere purchased from eBioscience, Hartfield, UK). Flowcytometry was performed on a FACSCalibur (BDBioscience) using CellQuest software (BD Bioscience,Franklin Lakes, NJ).TCR stimulationSingle cell suspensions with 1 107 thymocytes or 1 106 splenocytes in RPMI 1640 (Gibco, Paisley, UK) supplemented with 10% FBS and 50 μM b-mercaptoethanol(Sigma Aldrich) were stimulated with CD3-antibody(BD Bioscience) at a concentration of 10 μg/ml in 37 C.Thymocytes were stimulated for either 2 or 5 minuteswhereas splenocytes were stimulated for 2 minutes.Immunoprecipitation and immunoblottingCell lysates were prepared by addition of lysis buffer (20mMTris -HCl pH 7.8, 150 mM NaCl, 2 mM EDTA, 1%Triton X- 100, 2 mM PMSF, 10 μg/L aprotinin and 10μg/L leupeptin). Immunoprecipitation was performed byincubating the samples with either a-phosphotyrosineantibody (Millipore, Watford, UK) or with Shb antibody[31] at 0.5 μg/ml or 5 μg/ml, respectively, for 1 hour atPage 2 of 104 C. This was followed by incubation with Protein Asepharose (GE Healthcare, Uppsala, Sweden) under thesame conditions. Samples were washed 3 times in lysisbuffer and resuspended in SDS-sample buffer.Protein denaturation was achieved by boiling the samples for 5 minutes followed by separation on SDSPAGE. Proteins were transferred to Hybond-P membranes (GE Healthcare) and subsequently blocked in 5%BSA over night at 4 C.Immunodetection The membraneswere probed with the following antibodies: a-phosphotyrosine (Millipore), phospho-ERK (Cell Signaling Technology), PLCg (Milipore), c-Cbl (BD Bioscience), Vav1(Millipore), phospho-p38 (Cell Signaling Technology),ZAP70 (BD Bioscience), p38 (Cell Signaling Technology), Shb and ERK (Cell Signaling Technology). Immunodetection was performed using HRP-conjugatedsecondary antibodies (GE Healthcare) and ECL detection solution (GE healthcare) according to manufacturer’s instructions. The autoradiographic film (GEhealthcare) was afterwards exposed to the membrane for2 seconds up to 2 minutes, depending on the strength ofthe signal.T cell purification, proliferation and cytokine productionassaySingle cell suspensions of splenocytes were fractionedinto either CD4 or CD8 cells or into naïve CD4 cells using MACS magnetic microbeads (MiltenyiBiotec, Bergisch Gladbach, Germany), following themanufacturer’s instructions. 5 10 5 CD4 or CD8 splenocytes were plated on 24-well plates precoatedwith 2.5 μg/ml a-CD3 and 3 μg/ml a-CD28 antibodies(BD Bioscience) in a volume of 1.5 ml F-DMEM (SVA,Uppsala, Sweden) supplemented with 10% FBS and 50μM b-mercaptoethanol. Supernatants were harvestedevery 24 hours for 6 days and cytokine production wasestimated by sandwich immunoassays using GyrolabBioaffy (Gyros Biotech, Uppsala, Sweden) following themanufacturer’s instructions [32]. On the fourth day ofstimulation, 10% of the cells were incubated with 1 μCiof 3H-thymidine (GE Healthcare) 4 hours, in order toestimate proliferative activity. The amount of radioactivity was thereafter determined with a Wallac 1409 scintillation counter (Perkin Elmer, Waltham, MA, USA).Naïve CD4 cells were cultured under the same conditions as described above, but the cells were plated on96-well plates at a concentration of 5 10 4 cells perwell in 200 μl for 2 day cultures and 2.5 104 cells perwell for 3 to 5 day cultures.Real-time reverse transcription- PCRRNA was isolated from naïve CD4 cells, at the indicatedtime points, using a RNAeasy mini kit (Qiagen, Solna,Sweden) following the manufacturer’s instructions. Gene
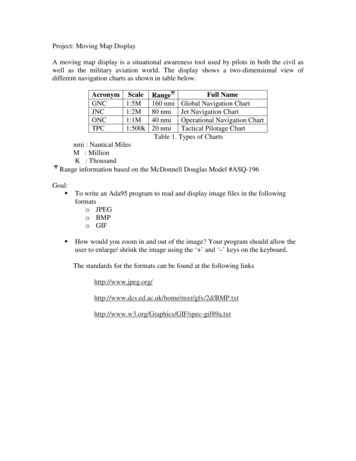
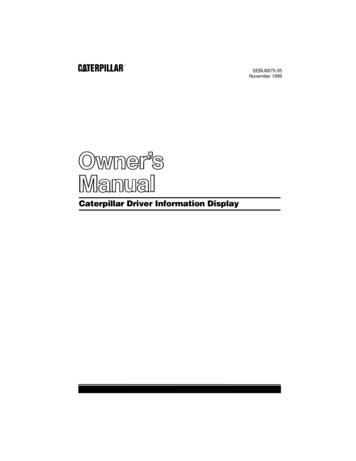
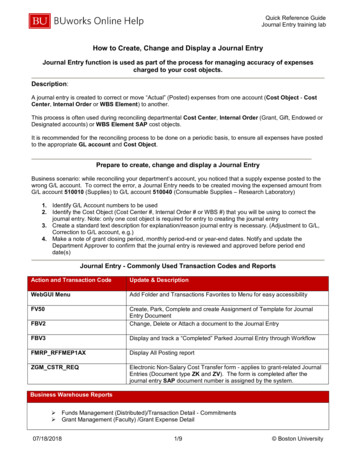
Gustafsson et al. BMC Immunology 2011, e 3 of 10Table 1 PCR primer sequences and Tm used for the RTPCR analysisResultsPrimersSequence (5’-3’)TmBeta-actin 5’CAC TAT TTG GCA ACG AGC GG60 CBeta-actin 3’TCC ATA CCC AAG AAG GAA GGC60 CIL-2 5’TTG AGT GCC AAT TCG ATG ATG55 CSince Shb has been demonstrated to interact with theTCR, but also with other receptors that are importantfor the development and function of the hematopoieticsystem it was of interest to determine whether the lossof Shb expression would result in any alterations in thenumber of blood cells. Hematocrit values and thrombocyte numbers appeared unchanged (data not shown),whereas both lymphocyte (WT 6.6 0.42 million cells/ml; KO 4.6 1.2 million cells/ml) and monocyte (WT0.21 0.05 million cells/ml; KO 0.07 0.02 millioncells/ml) numbers were decreased in the Shb knockout(lympocytes p 0.01; monocytes p 0.05) (Figure 1).IL-2 3’AGA TGA TGC TTT GAC AGA AGG CTA55 CIL-4 5’CGG AGA TGG ATG TGC CAA AA60 CIL-4 3’GCA CCT TGG AAG CCC TAC AG60 C60 CIFN-g 5’CCT GGG GCC TAG CTC TGAIFN-g 3’CAG CCA GGA ACA GCC ATG AG60 CGATA3 5’CGA GAT GGT ACC GGG CAC TA60 CGATA3 3’GAC AGT TCG CGC AGG ATG60 CTbet 5’TTC CCA TTC CTG TCC TTC ACC60 CTbet 3’TGC CTT CTG CCT TTC CAC AC60 Cexpression was quantified using the SYBR Green RTPCR kit (Qiagen). PCR conditions were 50 C for 20 minutes and 95 C for 15 minutes, followed by 45 cycles withdenaturation at 94 C for 15 seconds, annealing for 25seconds at the various temperatures indicated in table 1and extension at 72 C for 15 seconds. Primer sequencesare listed in table 1. Transcription levels were normalizedagainst b-actin. All PCR reactions were run on a LightCycler (Roche Diagnostics, Basel, Switzerland) and CTvalues were calculated using the accompanying software.Cell cycle analysisThe cell cycle status of naïve CD4 T cells was analyzedat the indicated time points by adding 5-bromo-2-deoxyuridine (BrdU) (Sigma Aldrich) in a final conctration of50 μM followed by a 2-hour incubation. The cells weresubsequently fixed and permeabilized using the BDCytofix/Cytoperm kit (BD Bioscience) following theinstructions provided by the manufacturer. Cell cyclestatus was determined by staining with anti-BrdU-APC(Invitrogen Ltd, Paisley, UK) and 7-amino-actinomyocinD (7AAD) (eBioscience) followed by analysis on aFACSCalibur (BD Bioscience) using CellQuest software(BD Bioscience).Effect of Shb null allele on blood cell numbersAberrant signal transduction in Shb knockout thymocytesTCR signaling is of uttermost importance in thymocytedevelopment as many of the survival and death signalsare mediated through the receptor. Peripheral lymphocytenumbers may therefore be adversely affected by a disruption of signaling during early thymocyte development. Toexplore this possibility further, wild type and knockoutthymocytes were stimulated for 2 and 5 minutes, followed by immunoprecipitation with phosphotyrosineantibody. This revealed alterations in important TCR signaling components. PLC-g phosphorylation was loweredafter both 2 and 5 minutes of stimulation in the Shbknockout (Figure 2) whereas Vav-1 and Cbl displayincreased basal phosphorylation levels in knockout thymocytes. Additionally, Shb knockout thymocytes fail tomount any stimulation-induced increase of Vav-1 andCbl phosphorylation (Figure 2). A similar pattern isobserved when the corresponding lysastes were probedfor tyrosine phosphorylations; two major phosphotyrosine Statistical analysisData is presented as mean Standard error of the mean(SEM). For comparison of difference between twogroups with normal distributed data, unpaired Studentst-tests were used unless otherwise stated. For pairedcomparisons, one wild type and one age and sexmatched knockout sample was analyzed simultaneously,under identical conditions, and the wild type and theknockout values were set as one observation each forthe comparison. All p-values less than 0.05 were considered statistically significant. Figure 1 Peripheral blood profile. Peripheral blood was stainedwith May-Grünwald Giemsa in order to quantify leukocyte numbers(n 8, mean SEM, ** denotes p 0,01, * denotes p 0,05 byStudents t-test).
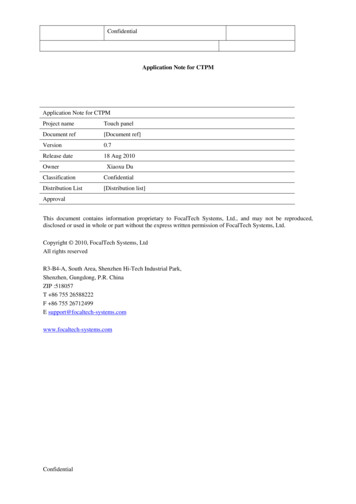
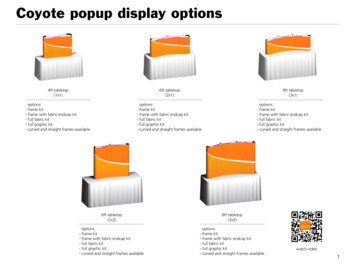
Gustafsson et al. BMC Immunology 2011, e 4 of 10 Figure 2 Thymocyte stimulation response. Thymocytes werestimulated with CD3-antibody for 2 and 5 minutes and analyzed byeither immunoprecipitation with phosphotyrosine antibody followedby Western blot or by just performing Western blot on cell lysates.Blots were probed for phosphotyrosine, phospho-PLCg, phospho-Vav,phospho-Zap70, phospho-Cbl, phospho-ERK, Cbl, ERK and Shb.proteins of 65 and 50 kDa both display elevated basalphosphorylation levels but no stimulation effect (Figure2). Other studies performed on Shb knockout endothelialcells and oocytes, have demonstrated elevated signaling inthe absence of ligand-stimulation, suggesting this as beinga feature in common in several signaling systems lackingShb [28,30]. ZAP70 phosphorylation was unaffected bythe absence of Shb, which is an expected finding sinceShb is predicted to operate downstream of ZAP70 in theTCR signaling pathway (Figure 2). Moreover, extracellularsignal regulated kinase (ERK) signaling, which has beenimplicated in positive selection [33,34], appeared similarin the two groups of cells after both 2 and 5 minutes ofstimulation (Figure 2).Unaltered thymocyte development in the Shb knockoutmouseSince thymocytes exhibited a changed signaling patternin response to TCR stimulation, thymi were isolatedfrom mice 3 weeks of age, as thymocyte developmentalactivity is at a peak at this time [35]. Thymocyte numbers were determined, but no distinguishable differencesbetween knockout and wild type animals were observed(Figure 3A). Even though there was no detectable deviation in thymocyte numbers, relative changes in the Figure 3 Thymocyte maturation in mice 3 weeks of age. (A) Thenumber of thymocytes was determined by Bürker chambercounting (n 9, mean SEM). (B) Thymocytes stained withfluorescent CD4 and CD8 antibodies and analyzed with flowcytometry (n 9, mean SEM). (C) Thymocytes were isolated andstained with fluorescent antibodies directed against CD4, CD8, CD25and CD44 and analyzed with flow cytometry (n 9, mean SEM).proportions of different developmental subsets in thethymus could cause the reduced numbers of lymphocytes in peripheral blood. Thymocytes were thereforestained for CD4 and CD8 in order to identify the different developmental stages [36,37]. However, Shb knockout animals displayed no statistically significant changesin the relative numbers of double positive (DP), singlepositive (SP) CD4 , and SP CD8 cells (Figure 3B).Thymocytes were also analyzed for CD44 and CD25expression to enable a distinction between the differentdouble negative (DN) subsets [5], but the Shb knockoutmice displayed no major differences in the DN1-4 populations (each given in percent of the total DN population) (Figure 3C).
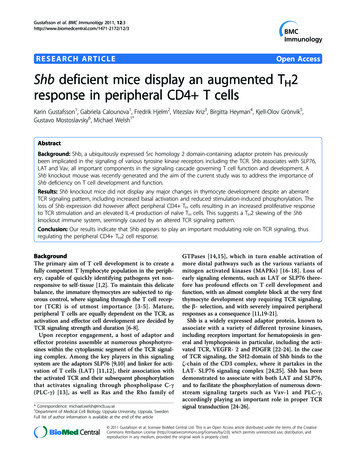
Gustafsson et al. BMC Immunology 2011, 12:3http://www.biomedcentral.com/1471-2172/12/3Shb knockout TH cells display altered signaling andproliferationDespite changes in the TCR response to stimulationobserved in Shb knockout thymocytes, knockout miceexhibited no major changes in central T cell development. This prompted us instead to evaluate peripheralT cell function. We first analyzed absolute numbers ofsplenocytes, yet no detectable difference between knockout and wild type animals was noted (Figure 4A).To further study the function of peripheral T cells,splenocytes were fractionated into CD4 TH cells andCD8 TK cells and stimulated with CD3 and CD28 antibodies for 96 hours after which proliferation was assessedby estimating 3H thymidine incorporation. When compared to the wild type cells, the Shb null CD4 cellsexhibited a modest proliferation increase in response tostimulation (WT 70 9; KO 98 2; p 0.05) (Figure4B). CD8 Shb knockout cells also displayed a slightlyelevated proliferative response, although this effect didnot reach statistical significance (Figure 4B).An increased proliferative rate is likely to be caused bychanges in TCR signal transduction. T cell signaling wasconsequently examined by stimulating CD4 TH cellswith CD3 antibody for 2 minutes. In immunodetectionwith phosphotyrosine antibody the Shb knockout samplesdisplayed an overall increased protein phosphorylation inPage 5 of 10the absence of stimulation (Figure 4C), a pattern similarto what was observed in thymocytes. More specificallythere was a difference between wild type and knockoutin the phosphorylation of a 150 kDa band under basalconditions as well as in stimulated cells (Figure 4C). Inaddition, bands of molecular weights 120 kDa, 100 kDaand 36/38 kDa exhibited a higher degree of phosphorylation in unstimulated Shb knockout samples, butphosphorylation levels did not appear to increase withstimulation.In order to address the effect on other signaling pathways downstream of Shb, ERK and p38 MAPK activitywas measured in the samples, as both are important forT cell survival and function. p38 MAPK stimulation waspoor in the knockout, partly as a consequence ofincreased basal signal, whereas there was a clear increasein the amount of phospho-p38 MAPK in the wild typeafter stimulation (Figure 4C). ERK signaling on theother hand seemed normal (Figure 4C).TH2 skewing in Shb knockout T cells after stimulationAnother important factor governing T cell proliferationis IL-2, a potent T cell mitogen [38]. To test whetheraltered cytokine production was also a part of theincreased proliferation seen in Shb knockout TH cells,cytokine levels were monitored every 24 hours for up toFigure 4 Peripheral T cell signaling and proliferation. (A) The number of splenocytes was estimated by counting cells in a Bürker chamber (n 10, mean SEM). (B) Splenocytes were separated into CD4 and CD8 cells and stimulated for 96 hours with CD3- and CD28 antibodies.Radioactively labeled thymidine was added for the last 4 hours to estimate proliferative activity. The proliferation data is presented as apercentage of the highest value in each experiment that for CD4 cells corresponds to 264326 41432 and for CD8 cells to 191290 49852DPM (n 10, mean SEM, * denotes p 0,05 by paired Students t-test). (C) CD4 splenocytes were stimulated for 2 minutes with CD3antibody and subsequently analyzed by Western blot. The samples were probed with phosphotyrosine,- phospho- p38-, phospho-ERK- and ERKantibodies.
Gustafsson et al. BMC Immunology 2011, 12:3http://www.biomedcentral.com/1471-2172/12/3 Relative cytokine levels Relative cytokine levels Relative cytokine levels5 days. Shb knockout T cells were found not to producemore IL-2 than their wild type counterparts but ratherless, although this difference failed to reach statisticalsignificance (Figure 5A). IFN-g and IL-4 productionwe
The generation of Shb knockout mice has been described previously [27]. The animals were bred on a . Naïve CD4 cells were cultured under t