Transcription
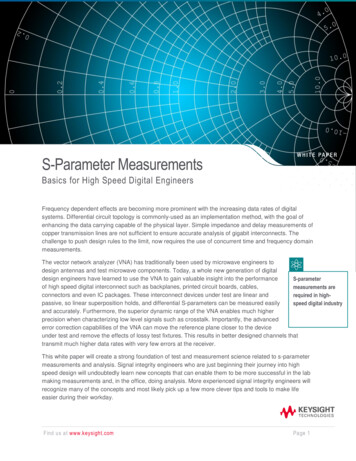
S-Parameter MeasurementsBasics for High Speed Digital EngineersFrequency dependent effects are becoming more prominent with the increasing data rates of digitalsystems. Differential circuit topology is commonly-used as an implementation method, with the goal ofenhancing the data carrying capable of the physical layer. Simple impedance and delay measurements ofcopper transmission lines are not sufficient to ensure accurate analysis of gigabit interconnects. Thechallenge to push design rules to the limit, now requires the use of concurrent time and frequency domainmeasurements.The vector network analyzer (VNA) has traditionally been used by microwave engineers todesign antennas and test microwave components. Today, a whole new generation of digitaldesign engineers have learned to use the VNA to gain valuable insight into the performanceS-parameterof high speed digital interconnect such as backplanes, printed circuit boards, cables,measurements areconnectors and even IC packages. These interconnect devices under test are linear andrequired in highpassive, so linear superposition holds, and differential S-parameters can be measured easilyspeed digital industryand accurately. Furthermore, the superior dynamic range of the VNA enables much higherprecision when characterizing low level signals such as crosstalk. Importantly, the advancederror correction capabilities of the VNA can move the reference plane closer to the deviceunder test and remove the effects of lossy test fixtures. This results in better designed channels thattransmit much higher data rates with very few errors at the receiver.This white paper will create a strong foundation of test and measurement science related to s-parametermeasurements and analysis. Signal integrity engineers who are just beginning their journey into highspeed design will undoubtedly learn new concepts that can enable them to be more successful in the labmaking measurements and, in the office, doing analysis. More experienced signal integrity engineers willrecognize many of the concepts and most likely pick up a few more clever tips and tools to make lifeeasier during their workday.Find us at www.keysight.comPage 1Pag
Table of ContentsWhy Use S-Parameters? . 3Digital signal Transitions in Channels . 4Digital signals vs. Analog signals . 5Transfer function of sine waves – What is the output? . 6What are S-parameters? . 7What are S-parameters? - Expressions . 8What are S-parameters? Lightwave Analogy . 9Mode conversion on a differential pair . 10Balanced devices . 114-port Differential S-parameters . 12S-parameter measurements basics – Vector Network Analyzer (VNA) . 13Frequency domain Time domain . 14S-parameter & TDR/TDT measurements . 15Time domain Frequency domain . 16TDR (Sampling) scopes . 17VNA vs. TDR Scopes – Advantage of VNA . 18Importance of calibration – With or without the cal. . 19Importance of calibration – Error types . 20Importance of calibration – Systematic error . 21Importance of calibration – Calibration kits . 22How do we use S-parameters? – On scopes . 23How do we use S-parameters? – With simulation SW . 24Why use S-parameters? . 25Summary . 26Keysight High-Speed Digital & Signal Integrity Solutions . 27Who Uses Time Domain Reflectometry? . 28What is PNA/ENA Option TDR? . 28ENA Option TDR Compliance Test Solution. 29Additional Resources . 35Find us at www.keysight.comPage 2Pag
Why Use S-Parameters?This is a sample of a typical transmitter device consisting of a chip, a package, and a card. A channel(transmission lines/traces) must match the characteristic impedance for a controlled impedance environmentwithin the channel (50Ω as shown in the top-right figure). However, the output signal/waveform at the outputconnector (bottom-right eye diagram) is degraded/distorted compared to the input signal/waveform (top-left eyediagram). Why is the waveform at the connector output degraded? Is it not enough measuring the characteristicimpedance?Transmission line matches the characteristicsimpedance (50Ω). Why is the waveform @ Connector outputdegraded? Is it not enough measuring the characteristicsimpedance?Find us at www.keysight.comPage 3Pag
Digital signal Transitions in ChannelsFast edges of digital signal transitions from logic level zero to logic level one become degraded into slowedges as they transmit through the copper channel.Test point 1 (TP1)Test point 2 (TP2)Needs analog signal handling on high speeddigital signalsFind us at www.keysight.comComparing waveformsbefore and aftertransmitting the channelfor 1Gbps and 10Gbps,the 10Gbps waveform isdramatically distorted.It’s far from an idealdigital signal. The higherthe bitrate, the more weneed to observe/managethe digital signal sameas an analog signal.Page 4Pag
Digital signals vs. Analog signals100MHz square waveLet’s see 100MHz square wave for instance. With digital interpretation, it’s a 10101 200Mbps bitpattern.On the other hand, with analog interpretation, it’s a composite(synthesized) waveform consisting of sinewaves, 100MHz fundamental and harmonics.Digital interpretation200Mbps 10101 . bit patternAnalog interpretation100MHz square wave whichconsists of sine wavesDigital Signals Analog Signals (consists of sine waves)Find us at www.keysight.comPage 5Pag
Transfer function of sine waves – What is the output?Devices that behave linearly only impose magnitude and phase changes on input signals. Any sinusoidappearing at the input will also appear at the output at the same frequency. No new signals arecreated.This is an example of a sine wave applied to a linear device which has the Output/Input and Phasecharacteristics shown below. The device imposes a non-uniform amplitude and phase change to eachfrequency component. At the frequency point 1, we can see the output signal same as the input signal(dotted line in the bottom-left figure). At 2, amplitude is decreased as half and phase is delayed as -90degree (solid line in the bottom-left figure). At 3, no signal can be detected from output.When a single sinusoid is passed through a linear network, amplitude and phase changes are not to beconsidered as distortion. However, when a complex time-varying signal is passed through a linearnetwork, the amplitude and phase shifts can dramatically distort the time-domain waveform. Thereforeboth amplitude and phase information in frequency domain are important. Then, S-parameters are theparameter which supports both information and has many advantages for high frequency devicecharacterization.?Linear device Output freq. equals to Input freq.Signal amplitude/phase are changed depending on frequency:Information on amplitude and/or phase characteristics in frequencydomain S-parametersFind us at www.keysight.comPage 6Pag
What are S-parameters?S-parameters are complex matrix that show Reflection/Transmission characteristics (Amplitude/Phase) infrequency domain. This type of test equipment is called “Stimulus/Response” and applies to both VectorNetwork Analyzers (VNA) and Time Domain Reflectometers (TDR).A two-port device has four S-parameters. The numbering convention for S-parameters is that the firstnumber following the “S” is the port where the signal emerges, and the second number is the port where thesignal is applied. So S21 is a measure of the signal coming out port 2 relative to the RF stimulus enteringport 1. When the numbers are the same (e.g., S11), in indicates a reflection measurement, as the input andoutput ports are the same.Reflection/Input Reflection coefficient S ,S1122Transmission/Input Transmission coefficient S ,S2112S-parameters are complex matrix that show Reflection/Transmissioncharacteristics (Amplitude/Phase) in frequency domain.Find us at www.keysight.comPage 7Pag
What are S-parameters? - ExpressionsWith amplitude and phase information, we can quantify the reflection and transmission characteristics ofdevices. Some of the common measured terms are scalar in nature (the phase part is ignored or notmeasured), while others are vector (both magnitude and phase are measured). For example, return loss is ascalar measurement of reflection, while impedance results from a vector reflection measurement. Some, likegroup delay, are purely phase-related measurements.Reflection, S11/S22: Reflections (Return loss), Impedance, Admittance, VSWR. Smith chart is one of displaymethods for complex reflection coefficient.Transmission, S21/S12: Gain/Loss (Insertion loss), Phase, Group delay (Delay time).Find us at www.keysight.comPage 8Pag
What are S-parameters? Lightwave AnalogyDifferential signalingIn today’s high-speed digital applications, differential signaling (differential circuit topology) iswidely and commonly used. Let’s review pros and cons of differential signaling.A method of transmitting information electrically with twocomplementary signals sent on a differential pair.Pros1. High noise immunity: Common-mode rejection2. High margin for signal attenuation: Receiver takes double voltage3. Low voltage operation: Low power consumption, low di/dt (EMI suppression)4. EMI reduction: Cancel out a magnetic field (complementary current)Cons:1. Large foot print: double traces, more area neededFind us at www.keysight.comPage 9Pag
Mode conversion on a differential pairHowever, non-ideal differential transmission lines do not exhibit benefits (pros) described in theprevious slide. A differential transmission line with even a small amount of asymmetry, will produce acommon signal that propagates through the device. This asymmetry can be caused by any physicalfeature that is on one line of the differential pair and not the other line, including solder pads, jags,bends and digs. This mode conversion is a source of EM interference (emission/radiation). Most newproduct development must pass the EMC compliance testing near the end of the design cycle. Veryoften the test results show that the design exhibits EM interference or susceptibility (immunity).However, there is usually very little insight as to what physical characteristic is causing the problem.Mode conversion analysis provides the designer with that insight so that EM problems can be resolvedearly in the design stage.Unexpected mode converison will be occurred on a non-idealdifferential device. Non-ideal means anything on one line of thedifferential pair not on the other line (asymmetry).Find us at www.keysight.comPage 10Pag
Balanced devicesStandard Single-ended devices generally have one input port and one output port. Signals onthe input and output ports are referenced to ground. On the other hand, balanced devices havetwo pins on either the input, the output, or both. The signal of interest is the difference andaverage of the two input or output lines, not referenced to ground.Differential mode responses can be obtained by balanced measurements and are representedby Differential S-parameters. The format of the parameter notation “Sxyab”, where “S” standsfor S-parameter, “x” is the response mode (differential or common), “y” is the stimulus mode(differential or common), “a” is the response port number and “b” is the stimulus port number.This is typical nomenclature for frequency domain S-parameters.Differential mode responses are represented by Differential SparametersFind us at www.keysight.comPage 11Pag
4-port Differential S-parametersThe sixteen S-parameters that are obtained by fully characterizing a differential interconnect can be categorizedinto 4 stimulus/response quadrants.In order to interpret the large amount of data in the differential parameter matrix, it is helpful to analyze onequadrant at a time. The first quadrant is defined as the upper left 4 parameters describing the differential stimulusand differential response characteristics of the device under test. This is the actual mode of operation for mosthigh-speed differential interconnects, so it is typically the most useful quadrant that is analyzed first. It includesinput differential return loss (Sdd11), input differential insertion loss (Sdd21), output differential return loss(Sdd22) and output differential insertion loss (Sdd12).The second and third quadrants are the upper right and lower left 4 parameters, respectively. These are alsoreferred to as the Differential quadrants. This is because they fully characterize any mode conversion occurring inthe device under test, whether it is common-to-differential conversion (EMI susceptibility, immunity) or differentialto-common conversion (EMI interference, emission/radiation). Understanding the magnitude and location of modeconversion is very helpful when trying to optimize the design of interconnects for gigabit data throughput.The fourth quadrant is the lower right 4 parameters and describes the performance characteristics of the commonsignal propagating through the device under test. If the device is designed properly, there should be minimalmode conversion and the fourth quadrant data is of little concern. However, if any mode conversion is presentdue to design flaws, then the fourth quadrant will describe how this common signal behaves.Find us at www.keysight.comPage 12Pag
S-parameter measurements basics – Vector Network Analyzer (VNA)For two-port VNA (e.g., Keysight E5071C ENA Series Network Analyzer or N5225B PNA Series NetworkAnalyzer)S11 ( A/R1) and S21 ( B/R1) are determined by measuring the magnitude and phase of the incident (R1),reflected (A) and transmitted (B) voltage signals when the output is terminated in a perfect Zo (a load thatequals the characteristic impedance of the test system). This condition guarantees that R2 is zero, sincethere is no reflection from an ideal load. S11 is equivalent to the input complex reflection coefficient orimpedance of the DUT, and S21 is the forward complex transmission coefficient. Likewise, by placing thesource at port 2 and terminating port 1 in a perfect load (making R1 zero), S22 ( B/R2) and S12 ( A/R2)measurements can be made. S22 is equivalent to the output complex reflection coefficient or outputimpedance of the DUT, and S12 is the reverse complex transmission coefficient.Note that 4-port VNA is required for fully characterizing a 2-port differential device.Block diagram (2-port VNA)Note: Balanced measurements require 4-port VNAMeasure amplitude & phase of components by using sine wavefrequency sweepFind us at www.keysight.comPage 13Pag
Frequency domain Time domainS-parameters (frequency response) can be transformed into the time domain parameters (impulse response step response) by performing an inverse Fast Fourier transform (IFFT).The matrix representing the time domain will have similar notation, except the “S” is replaced by a “T” (i.e.Tdd11).Using Inverse Fast Fourier Transform techniques, the frequencydomain response can be mathematically transformed into thetime domain responseFind us at www.keysight.comPage 14Pag
S-parameter & TDR/TDT measurementsBoth, time and frequency domain data help us understand device characteristics. Just four differentialparameters are shown in this slide, but other parameters such as mode conversions are often required toevaluate a device thoroughly.Both time and frequency domains analysis are valid and feasibleFind us at www.keysight.comPage 15Pag
Time domain Frequency domainIt’s also possible that the time domain parameters (step response impulse response) can be transformedinto S-parameters (frequency response) by performing a fourier transform (FT).Which is the best solution?Find us at www.keysight.comPage 16Pag
TDR (Sampling) scopesLet’s review the measurement principle of TDR scopes. The TDR instrument accomplishes this task witha fast step (step generator) with little overshoot in concert with a wideband receiver (sampler) to measurestep response.N1000AInput step signal and derive impedance/loss fromreflection/transmission measurementsFind us at www.keysight.comPage 17Pag
VNA vs. TDR Scopes – Advantage of VNAThe VNA uses a precise sine wave and sweeps frequency as a narrow band receiver tracks the swept inputresponse. This narrow band receiver achieves low noise and high dynamic range of the VNA. Whether thedata acquisition hardware is time domain based or fr
Jun 18, 2019 · Network Analyzers (VNA) and Time Domain Reflectometers (TDR). A two-port device has four S-parameters. The numbering convention for S-parameters is that the first number following the “S” is the port where the signal emerges, and t