Transcription
Levelized Cost of Electricity Calculator:A User GuideStephen D. Comello Stanford Graduate School of Business,Gunther GlenkTUM School of Management, Technical University of MunichandStefan ReichelsteinStanford Graduate School of BusinessMarch 2017 Contact information: scomello@stanford.edu; gunther.glenk@tum.de; reichelstein@stanford.edu(c) 2017, Stanford Graduate School of Business. All rights reserved.1
1DescriptionThe economics of electricity generating facilities is determined by range of parameters including, including upfront investment, operating expenses and capacity factors. The LevelizedCost of Electricity (LCOE) is a metric commonly used to compare the cost competitiveness of alternative electricity generating platforms. Our LCOE calculator seeks to providea simple, flexible and transparent tool that enables users to quickly determine the LCOEfor different generation technologies, segments and geographic locations within the UnitedStates.The generation technologies assessed in this tool include renewable energy sources, in particular solar photovoltaic (PV) and wind power, in addition to fossil fuel power plants includingnatural gas combined cycle (NGCC) and pulverized coal. For solar PV, our LCOE tool alsodifferentiates segments according to utility scale, commercial and residential installations.The LCOE for each technology-segment combination is determined for a specific U.S. state,where currently the user can choose one from a list of eleven.1 For each technology-segmentcombination in a given U.S. state, the default input values for the fourteen components ofthe LCOE are displayed. The input variables considered are: Useful Life Tax Depreciation Method System Price (Cost of Capacity) Investment Tax Credit Production Tax Credit Capacity Factor System Degradation Factor Fixed Operation and Maintenance Cost Variable Operation and Maintenance Cost Fuel Cost1Arizona, California, Florida, Georgia, Iowa, Massachusetts, New Jersey, North Carolina, Oklahoma, Texasand Wyoming.1(c) 2017, Stanford Graduate School of Business. All rights reserved.1
Carbon Dioxide Emission Charges (Allowance Cost) Emissions Performance (Carbon Intensity) Cost of Capital (Discount Rate) Effective Corporate Tax RateThe tool allows each input value to be freely adjusted to recalculate the LCOE, so as toperform a sensitivity analysis relative to the default values.The remainder of this user document is organized as follows. Section 2 provides instructionon how to use the LCOE tool. Section 3 outlines the data sources that provide the inputsto the default component values. The analytical background and relevant equations areprovided in Section 4.Preferred Citation:Comello, S., Glenk, G. and S. Reichelstein (2017). Levelized Cost of Electricity Calculator.URL: http://stanford.edu/dept/gsb circle/sustainable-energy/lcoe.2(c) 2017, Stanford Graduate School of Business. All rights reserved.2
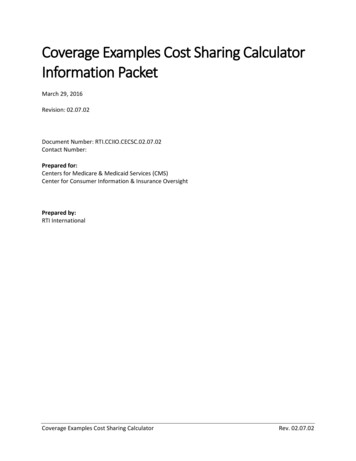
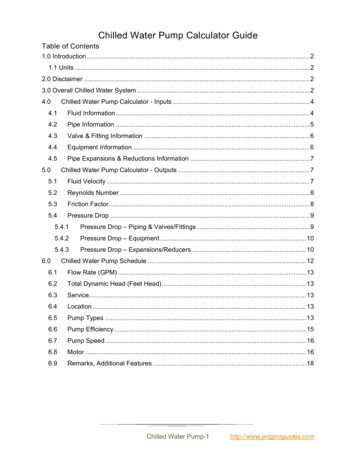
2User ManualThe LCOE Calculator is available at:http://stanford.edu/dept/gsb circle/sustainable-energy/lcoe/When you load the website of the LCOE Calculator, you see the following page:Figure 1: Start page of the LCOE Calculator.To calculate the LCOE of an energy source, choose a state, technology and segment andclick on ‘select’. Example: Select ‘California’, ‘Solar’ and ‘Commercial’.3(c) 2017, Stanford Graduate School of Business. All rights reserved.3
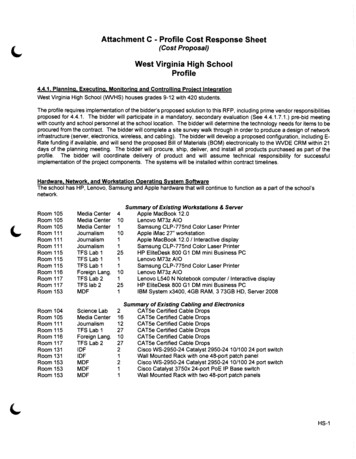
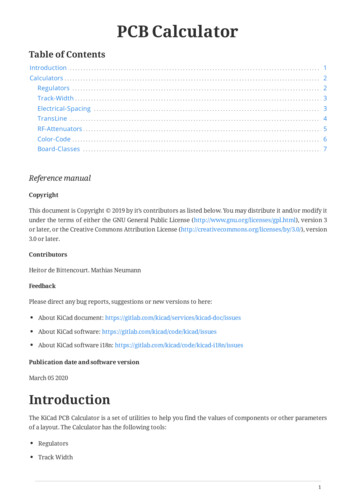
The LCOE Calculator returns the results of the LCOE calculation with all the parametersand cost components. You see the following page:Figure 2: Result and parameter page of the LCOE Calculator.The page has three distinct areas:1. the top bar shows the initial selections,2. the left column shows the adjustable input parameters and the LCOE, and3. the right column shows the default input parameters and the LCOE.4(c) 2017, Stanford Graduate School of Business. All rights reserved.4
The collection of input parameters is listed in Section 1. To test the sensitivity of theLCOE value to a particular parameter, simply edit its value by clicking into the field andentering a new value. Then click ‘Compute LCOE’ to recalculate the results of the leftcolumn. The right column allows for a direct comparison of the results.To choose a different state, technology or segment, reload the website or click ‘Start Over’.5(c) 2017, Stanford Graduate School of Business. All rights reserved.5
3Data SourcesThis section provides details about the data sources used for each of the parameters used inthe LCOE calculation.Useful LifeGenerally assumed value across all generation technologies.Tax Depreciation MethodRefer to IRS Publication 946 (2016), “How to Depreciate Property”.2System PriceFor NGCC, wind and utility scale solar, the average of actual system prices is used basedon 2015 vintage facilities. Data provided by ABB Velocity Suite Subscription Service.3Since no pulverized coal facilities were constructed in 2015, cost of capacity estimates arefrom U.S. Department of Energy National Energy Technology Laboratory (NETL) report,titled “Cost and Performance Baseline for Fossil Energy Plants Volume 1a: Bituminous Coal(PC) and Natural Gas to Electricity Revision 3” (DOE/NETL-2015/1723).4For commercial and residential scale solar PV, the reported cost of capacity, by segment,for 2015 vintage installations is used. Data provided by GTM Research report titled “U.S.Solar PV Price Brief H1 2016: System Pricing, Breakdowns and Forecasts”.5 Given thatvalues in the GTM Research report are national averages, state differentiation is determinedby adjusting cost of capacity using the averaged city cost indexes for a given state, providedby RSMeans Construction Cost Indexes.6Investment Tax CreditIn accordance with IRS rules.7Production Tax CreditIn accordance with IRS is/search-publications/vuedetails?id tricity-production-tax-credit-ptc.36(c) 2017, Stanford Graduate School of Business. All rights reserved.6
Capacity FactorFor utility scale systems (NGCC, coal, wind and utility scale solar), data are provided byan average of actual capacity factors for facilities characterized as “operational” for the fullyear 2015, as denoted in ABB Velocity Suite Subscription Service.For commercial and residential scale solar, the annual insolation of a given state is used, asdetermined by the average of point-estimates of cities provided by PV Watts.9This averagevalue is then reduced by incorporating system losses (86%), inverter efficiency (96%) andtemperature losses (97%). The result is then divided by 8,760 to arrive at state-specificresidential and commercial capacity factors.System Degradation FactorFor all solar installations, degradation factor baseline values follow Jordan, Wohlgemuth,and Kurtz (2012). Wind degradation factors are derived from statistics provided in the U.S.Department of Energy Office of Energy Efficiency and Renewable Energy report titled: “2015Wind Technologies Market Report.”10 NGCC and coal facility degradation were providedthrough expert elicitations.Fixed Operation and Maintenance CostFor NGCC, wind and utility scale solar, we rely on an average of actual fixed operating andmaintenance costs for 2015 vintage facilities. Only those facilities that were in full operationfor 12 consecutive months are used. Data are provided by ABB Velocity Suite SubscriptionService.Since no pulverized coal facilities were constructed in 2015, fixed operating and maintenancecosts estimates are based on the National Energy Technology Laboratory (NETL) report,titled “Cost and Performance Baseline for Fossil Energy Plants Volume 1a: Bituminous Coal(PC) and Natural Gas to Electricity Revision 3” (DOE/NETL-2015/1723).For commercial and residential scale solar PV, the reported fixed operation and maintenancecosts are based on 2015 vintage installations. Data have been provided by GTM Researchreport titled “U.S. Solar PV Price Brief H1 2016: System Pricing, Breakdowns and Forecasts”. The values in the GTM Research report are national averages. Therefore statedifferentiation is achieved by adjusting system prices by the state-averaged city cost indexprovided by RSMeans Construction Cost es-Market-Report-08162016.pdf.107(c) 2017, Stanford Graduate School of Business. All rights reserved.7
Variable Operating and Maintenance CostsFor utility NGCC, wind and utility scale solar, the calculator relies on an average of actualvariable operation and maintenance costs for 2015 vintage facilities is used. Only thosefacilities which were in full operation for 12 consecutive months were included. Data inputsare based on the ABB Velocity Suite Subscription Service.Since no pulverized coal facilities were constructed in 2015, variable operating and maintenance costs estimates are obtained from the US. Department of Energy National EnergyTechnology Laboratory (NETL) report, titled “Cost and Performance Baseline for FossilEnergy Plants Volume 1a: Bituminous Coal (PC) and Natural Gas to Electricity Revision3” (DOE/NETL-2015/1723).For commercial and residential scale solar PV, the calculations rely on the reported variable operating and maintenance costs for 2015 vintage installations. Data are providedby the GTM Research report titled “U.S. Solar PV Price Brief H1 2016: System Pricing,Breakdowns and Forecasts.” Since values in the GTM Research report are national averages, differentiation by state is achieved by adjusting these costs according to the RSMeansConstruction Cost Index.Fuel CostFor NGCC and coal facilities, the average fuel costs is obtained from facilities that were characterized as “operational” for full year 2015, as reported in ABB Velocity Suite SubscriptionService.Carbon Dioxide Emission ChargesThe California charge is based on the AB 32 California Cap and Trade Program, withthe allowance cost for carbon dioxide provided by California Carbon Dashboard.11 TheMassachusetts charges are provided by the Regional Greenhouse Gas Initiative (RGGI).12Emissions Performance (Carbon Intensity)Carbon intensity estimates were provided by the National Energy Technology Laboratory(NETL) report, titled “Cost and Performance Baseline for Fossil Energy Plants Volume 1a:Bituminous Coal (PC) and Natural Gas to Electricity Revision 3” (DOE/NETL-2015/1723).Cost of Capital (Discount i.org/.8(c) 2017, Stanford Graduate School of Business. All rights reserved.8
The default calculations assume an identical value across all generation technologies. Thecost capital is to be interpreted as a weighted average between the cost of equity and debt.Effective Corporate Tax RateThe effective corporate tax rate for each state is the sum of the federal tax rate of 35% andthe state specific corporate tax rate, as reported by the Tax porate-income-tax-rates-and-brackets-2016/.9(c) 2017, Stanford Graduate School of Business. All rights reserved.9
4Analytical BackgroundThe LCOE is a life-cycle cost concept that includes all physical assets and resources requiredto deliver one kilowatt hour (kWh) of electricity. It reflects the break-even price that must beachieved as average revenue to yield a zero-net-present value (NPV) for equity investors.14The concept assumes that capacity and fixed operating costs scale proportionally with thesize of the facility. Thus investments in power capacity are normalized to 1 kilowatt (kW).Following the notation in Reichelstein and Yorston (2013), the LCOE of a 1 kW facility isgiven by:LCOE w f c · ,(1)with w as the time-averaged variable cost per kWh, f as the levelized fixed operating costper kWh and c as the levelized capacity cost of the facility per kWh. is a tax factor thatcovers the impact of income taxes, the depreciation tax shield and investment tax credits.The cost components are determined by the following parameters: SP : system price, the acquisition cost of the generation capacity (in /kW), Wi : variable operating cost in year i of the generation facility (in /kWh),15 Fi : fixed operating cost in year i of the generation facility (in /kW), γ: discount factor based on the cost of capital r: γ 1(1 r)(scalar), T : useful lifetime of the output generating facility (in years), CF : capacity factor of the generation capacity (scalar), xi 1 : system degradation factor in year i (scalar), m: number of hours per year: m 8, 760.Since the LCOE represents a break-even price, standard corporate finance theory suggeststhat if the firm’s leverage ratio (debt over total assets) remains constant, the appropriatediscount rate is the Weighted Average Cost of Capital (WACC). The capacity factor ofthe LCOE is the average capacity factor of the generation capacity ignoring intertemporal1415C.f. MIT (2007).The variable operating cost include all costs that depend on the output quantity, such as variable maintenance cost, fuel cost and carbon dioxide emissions cost.10(c) 2017, Stanford Graduate School of Business. All rights reserved.10
variations. It is a unitless scalar in the range of [0, 1], reflecting environmental or technological factors. The system degradation factor xi 1 covers the potential change of outputof the generation capacity over time. It is a unitless scalar quantifying the fraction of theinitial capacity that is still operational in year i. For notational compactness, denote bym 24 · 365 8, 760 the total number of hours in a year.To obtain the levelized capacity cost per kWh, the initial capital expenditure (system price)is ’levelized’ across all future hours of energy output that can be obtained from the facility.Specifically, the system price per kW is divided by all hours of production discounted overthe useful lifetime:c SP.TPm · CF ·xi 1 · γ i(2)i 1The denominator represents the lifetime aggregate output per kW of installed capacity. Thelevelized operating costs per kWh for fixed and variable operating costs are given as thepresent value of all costs divided by the aggregate output:TPFi · γ ii 1f m · CF ·TP,xi 1·(3)γii 1andTPw TPWi · xi 1 · γ i · m · CFi 1m · CF ·TP xi 1·γii 1Wi · xi 1 · γ ii 1TP.xi 1·(4)γii 1The last component of the LCOE is the tax factor that quantifies the financial effect ofincome taxes, the depreciation tax shield and investment tax credits. While depreciation andinterest on debt reduce a firm’s taxable earnings, the debt tax shield is already included. ifthe cost capital is interpreted as the WACC. The depreciation tax shield is determined bythe effective corporate income tax rate and the allowable depreciation schedule. The U.S.tax code currently grants an investment tax credit (ITC) for some renewable energy sources.It reflects a dollar-for-dollar subsidy that is deducted from the income taxes an investorotherwise owes.16 The tax factor incoporates the following parameters: ITC: investment tax credit (in %),16C.f. U.S. Department of Energy (2016a), Comello and Reichelstein (2016).11(c) 2017, Stanford Graduate School of Business. All rights reserved.11
α: effective corporate income tax rate (in %), di : allowable tax depreciation rate in year i (in %), δ: capitalization discount for depreciation purposes.17The assumed useful life for tax purposes is usually shorter than the economic lifetime. Therefore, the tax depreciation rate is zero (di 0)) in those years. Following the notation inComello and Reichelstein (2016), the tax factor is given by:1 IT C α · (1 IT C · δ) ·TPdi · γ ii 1 1 α.(5)The tax factor is increasing and convex in the tax rate α. Without an ITC, it is greater than1 and bound above by 1/(1 α). Furthermore, an accelerated tax depreciation schedulereduces due to the time value of money. Specifically, if the tax code were to allow for afull depreciation in the first year (d0 1 and di 0 for i 0), the tax factor would equal 1.With tax credits, can fall below 1.For wind power, the U.S. tax code currently grants the production tax credit (PTC). Italso reflects a dollar-for-dollar subsidy in terms of a fixed premium per kWh of producedelectricity that is deducted from the income taxes otherwise owed by the investor.18 Sincethe PTC is commonly granted for less than the useful life of the asset for tax purposes, wedenote by T 0 as the duration of the PTC. We denote by o the tax impact of the PTC. Itcan be derived from the NPV as follows:T0P o γii 1TP(1 α) ·.(6)xi 1 · γ ii 1To integrate the PTC into the LCOE calculation, it can be shown that an investor willbreak-even in terms of discounted cash flows if the average sales revenue per kWh is exactlyequal to the following LCOE measure:LCOE w f c · P T C · 0 .(7)17The current tax code of the U.S. states that an investor claiming a 30% ITC can only capitalize 85%( 1 0.3 · 0.5) of the system price for depreciation purposes.18C.f. U.S. Department of Energy (2016b).12(c) 2017, Stanford Graduate School of Business. All rights reserved.12
Glossary Of TCPVWACCDescriptionLevelized cost of electricityInvestment tax creditkilo Wattkilo Watt hourNet present valueNatural gas combined cycleProduction tax creditPhotovoltaicWeighted average cost of capitalLCOE ParametersParameterGreekαδ 0γDescriptionUnitEffective corporate income tax rateCapitalization discount for depreciation purposesTax factor, overall effect of corporate income taxesTax impact of the production tax creditDiscount factor: γ 1/(1 r)LatincCFdifFiIT CLCOEmrPTCSPTT0wWixi 1Capacity cost of the generation facilityAverage capacity factor of the generation capacityAllowable tax depreciation in year iTime-averaged fixed operating costFixed operating cost in year iInvestment tax creditLevelized cost of electricityNumber of hours per yearInterest rate, weighted average cost of capital (WACC)Production tax creditSystem price, the acquisition cost of the generation capacityUseful life for economic purposesDuration of the production tax creditTime-averaged variable operating costVariable operating cost in year iSystem degradation factor in year i% /kWh% /kWh /kW% /kWhours% /kWh /kWyearsyears /kWh /kWh%13(c) 2017, Stanford Graduate School of Business. All rights reserved.13
ReferencesComello, S., and S. Reichelstein (2016), “The U.S. investment tax credit for solar energy:Alternatives to the anticipated 2017 step-down,” Renewable and Sustainable Energy Reviews, 55(2016), 591–602, doi:10.1016/j.rser.2015.10.108, URL n, D., J. Wohlgemuth, and S. Kurtz (2012), “Technology and Climate Trends in PVModule Degradation,” Tech. rep., National Renewable Energy Laboratory, nREL/CP5200-56485.MIT (2007), “The Future of Coal: Options for a Carbon-Constrained World.” Tech. Rep.ISBN 978-0-615-14092-6, Massachusetts Institute of Technology, Cambridge, MA.Reichelstein, S., and M. Yorston (2013), “The prospects for cost competitive solar PVpower,” Energy Policy, 55, 117–127, doi:10.1016/j.enpol.2012.11.003.U.S. Department of Energy (2016a), “Business Energy Investment Tax Credit (ITC),” city-production-tax-credit-ptc.14(c) 2017, Stanford Graduate School of Business. All rights reserved.14
Department of Energy O ce of Energy E ciency and Renewable Energy report titled: \2015 Wind Technologies Market Report."10 NGCC and coal facility degradation were provided through expert elicitations. Fixed Operation and Maintenance Cost For NGCC, wind and utility scale