Transcription
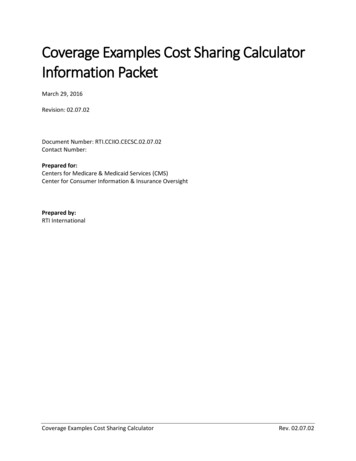
School FacilitiesCOST CALCULATORA Joint-Use Tool for Fair FeesUSER GUIDE — EXCEL VERSIONSTEPS1Enter BasicDistrict Data2Enter FacilitiesRelated CostsSPONSORSActive Living ResearchConvergence Partnership3Set Joint-UsePolicies4Apply FeeStructureDEVELOPERS21st Century School FundCenter for Cities & SchoolsFEBRUARY 2014
INTRODUCTIONThe joint use of public school facilities can create: Expanded educational programs and services; More integrated communities; Environmental benefits; and Fiscal savings and efficiencies.The School Facilities Cost Calculator, available both as a downloadableExcel file and online at www.bestfacilities.org/jointusecalc, enables schooldistricts to do the following:1) Determine the true cost of ownership of all of its facilities and grounds —including operating, administrative, and capital costs2) Develop a transparent fee structure for joint use of its facilities, based onthe real cost of ownership and district policies on joint useOPERATING COSTS ADMIN COSTS CAPITAL COSTS COST OF OWNERSHIPCOST OF OWNERSHIPJOINT-USE POLICYFEESThis user guide walks you through the four interconnected worksheets inthe Excel version of the calculator. Each worksheet generates calculationsbased on values that you enter: facility data, time and use estimates,district policy assumptions, and district costs. You enter these values in thefields highlighted in yellow. The data used in this guide are for illustrativepurposes only; we encourage you to tailor the Excel file to fit the uniquerealities in your district.See more resources on the joint use of public school facilities atwww.bestfacilties.org.1 — School Facilities Cost Calculator
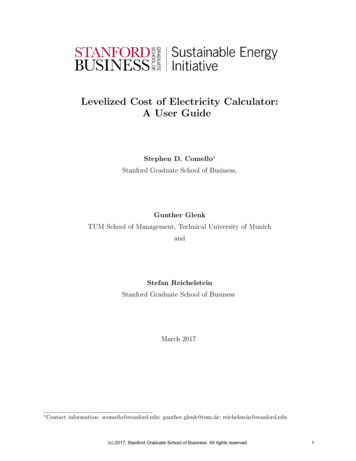
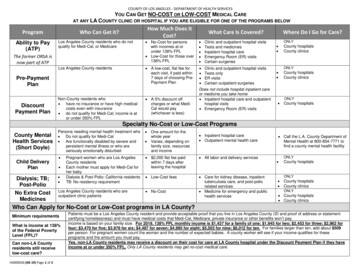
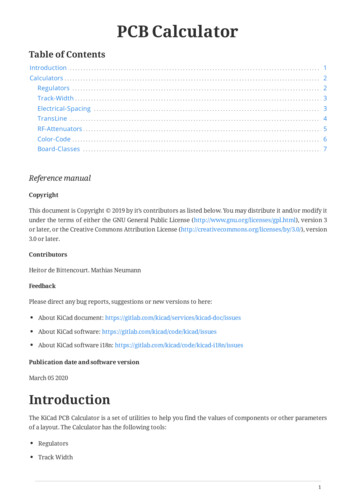
STEP 1: ENTER BASIC DISTRICT DATAThis tab collects the basic data, estimates, and assumptions that form the basis of thecalculator’s output. It also suggests the likely source for each indicator. It is importantto note that some indicators are somewhat subjective (e.g., Building DepreciationSchedule) or variable (e.g., Total Usable Hours per Year). Altering these factors willchange the final calculations.DistrictDataandPolicy- ‐- 62GSFActualSchooldistrict2Current- ‐YearBuildingReplacementValue 250 eFacilitydesignstandard1 Total Building Gross Square Footage (GSF) — The totalGSF of all buildings in the school district inventory, inthis example, 9,317,862. If the Cost of Ownership is to beanalyzed related to only one facility, then the GSF wouldbe of the one facility, but then all costs would need to berelated to just that one facility.2 Current-Year Building Replacement Value — The estimateof the current market cost on a per square foot basis toreplace the existing school facility or facilities — in thisexample, 250 per GSF. This varies depending on regionalconstruction and labor costs, as well as the quality ofdesign and construction. The market cost of a schoolfacility replacement value should include the “hard” costsfor construction, as well as the “soft” costs for design andproject management. It would not include site purchasecosts, but it would include site preparation costs.3 Building Depreciation Schedule — The determination,based on the quality of design, materials, andconstruction quality, of the average life expectancy ofmajor building systems, components, and structure — inthis example, 30 years. For example, if schools are builtof brick, with slate roofs, terrazo floors, and tile interiorwall hallways, they may be considered to have an 80-yearlife. If they are built with block, VCT floors, built-up roof,and sheet rock hallways, they would be considered tohave a 30-year life.4 Total Site Acres — The total land area encompassed bydistrict facilities, totaled in acres — in this example, 385acres.5 Total Usable Hours per Year — The total number of hoursthat the district operates a school facility so that it canbe occupied by administrative staff and/or teachers andstudents. In this example, if the school can be occupied 5days a week, 10 hours a day for 50 weeks, then the totalusable hours is 2,500.6 Core Space Factor — The estimate of the percentage ofthe building GSF that is hallways, stairways, elevators,bathrooms, and operational support spaces included inthe GSF of a building, but excluded from the net squarefootage of community-use space. In this example, that isan estimated average of 30%.SchoolFacilitiesCostCalculatorPage32 — School Facilities Cost CalculatorDevelopedby21
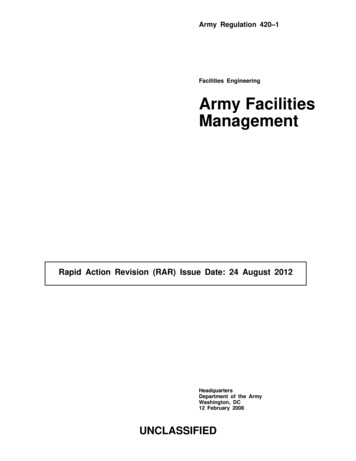
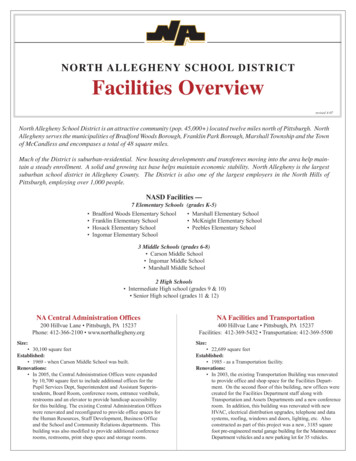
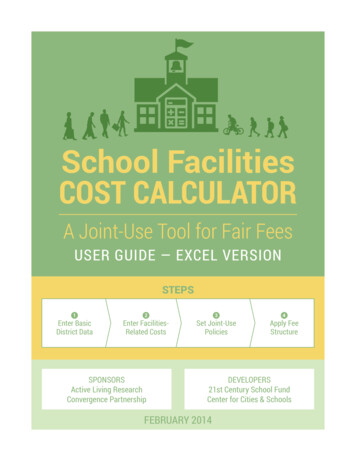
STEP 2: ENTER FACILITIES-RELATED COSTSThis tab calculates the total annual facilities-related expenditures in adistrict. The costs are organized into three main categories: operatingcosts, administrative costs, and capital costs. Enter the annual schooldistrict budget expenditures for fields highlighted in yellow. The expenditurecategories are typical, but you can customize them to your district byadding or changing categories.The operating expenditures are required to operate the facility safely and pay for utilities, custodial services, event setup,security,In thisexample,district’stotaldoperatingcosts are 5.65wpersquarefoot. areyellowCostoandfOovertime.wnership(SampleData)- ‐the- ‐ EnteryouristrictinformationherefieldsOPERATING ratingCosts(SampleData)- ‐- ‐ 6,600,000 13,027,519 26,386,387 6,238,555 410,220 52,662,681AnnualCost/SFCost/Hr/SF 0.71 1.40 2.83 0.67 0.04 5.65 0.00028 0.00056 0.00113 0.00027 0.00002 ctinformationwherefieldsareyellowShareAdmin- ‐RelatedFacilitiesCostsDedicatedto AC324,794ostdecisionfor dwiththeAnnual0.03 0.00001TheseareFacilitythe expendituresrequired to manage theand capital esCost/SFRealEstateOffice 495,269100% 495,269 0.05 of Cost/Hr/SF0.00002management, and oversight of school facilities. For some adminstrative cost categories, you will want to take afractionEnvironmentalHealthOffice 1,246,696100% 1,246,696 0.13 0.00005theSchool- ‐Leveltotal budgetamount—(Principal)forCexample,if the superintendent’soffice spends 10%of its time attending to ation 21,600,00010% 2,160,000 0.23 1 atedtoFacilitiescolumntocalculatecost. InHumanResourcesAdministration 3,728,83710%the real372,884thisMaintenanceacostsndORfficeepairs 13,027,519120,208 0.011.40 0.000010.00056administrativeare 63(Samplecents persquarefoot.Superintendent's 1,202,08010% Data)- ‐- ‐CustodialServices 26,386,387 2.83 0.00113Payroll 2,246,08910% 224,609 0.02 0.00001ShareSecurity0.67 0.000000.00027OfficeofEmergencyPlanning 190,05250% 6,238,55595,026 0.01Dedicatedto AnnualizedCostfor AnnualCustodialandSecurityOvertime410,2200.04 0.0000040.00002PurchasingDepartment 2,056,3285% 102,816 ating- ‐ Cost/Hr/SF0.00226District'sInsuranceCostCosts Facilities52,662,681 Cost/SF5.65- ‐ADMIN COSTSPensions&BFacilitiesenefits Operating 7,616,92010% 761,692 0.08 0.00003Admin- ce 324,794100% 324,794 0.03 Utilities 5,903,994 0.630.71 0.000250.00028RealEstateOffice 495,269100% 13,027,5190.05 0.000560.00002MaintenanceandRepairs495,269 1.40EnvironmentalHealthOffice 1,246,696100% 26,386,3870.13 0.001130.00005CustodialServices1,246,696 2.83School- ‐LevelAdministration(Principal) 21,600,00010% 6,238,5552,160,000 0.670.23 HumanResourcesAdministration 3,728,83710% 410,220372,884 0.040.04 0.000020.00002Superintendent'sOfficeCosts 1,202,08010% 52,662,6810.01 0.002260.00001TotalFacilitiesOperating120,208 5.65Payroll 2,246,08910% 224,609 0.02 0.00001FacilitiesCostsOfficeofEAdmin- ‐RelatedmergencyPlanning 190,05250% 95,026 0.01 0.00000DistrictFacilityOffice 324,794100%0.00001PurchasingDepartment 2,056,3285% 324,794102,816 0.030.01 0.000004RealEstateOffice 495,269100% 495,269 0.05 0.00002District'sInsuranceCost - ‐ - ‐EnvironmentalHealthOffice 1,246,696100% 1,246,696 0.13 0.00005Pensions&Benefits 7,616,92010% 761,692 0.08 0.00003School- ‐LevelAdministration(Principal) 21,600,00010% 2,160,000 0.23 0.00009TotalFacilitiesAdministrativeCosts 5,903,994 0.63 0.00025HumanResourcesAdministration 3,728,83710% 372,884 0.04 0.00002Superintendent'sffice 1,202,080Page510% by21stCentury120,208 Fundandt0.01 elopedSchoolheCenterandSchoolsPayroll facilitiesin2,246,08910% arebased224,6090.02 0.00001Theseare the annual capital costs needed to keepa state of good repair.Theyon the estimatedcurrentOfficeofEmergencyPlanning 190,05250% 95,026 0.01 0.00000replacementvalue and the number of years estimatedfor the building’s full depreciation.In this example, the annual capitalPurchasingDepartment 2,056,3285% 102,816 0.01 0.000004costsare 9.61persquarefoot.(SampleData)- ‐- ‐District'sInsuranceCost - ‐ - ‐Share10% 761,692 0.08 0.00003Pensions&Benefits 7,616,920Dedicatedto 994Costfor Annual0.63 0.00025CostofOwnershipCAPITAL sTotalDistrictCost 2,329,465,500Page5FacilitiesCost/SFCost/Hr/SF 77,648,850 8.33 0.00333 1,324,426 0.14 0.00006 by21st10,607,109CenturySchool Fundandt1.14 forCities0.00046DevelopedheCenterandSchools 89,580,385 9.61 0.003853 — School Facilities Cost Calculator
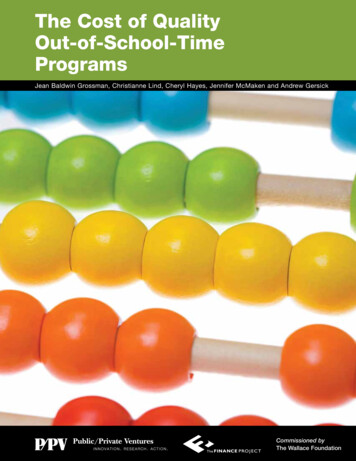
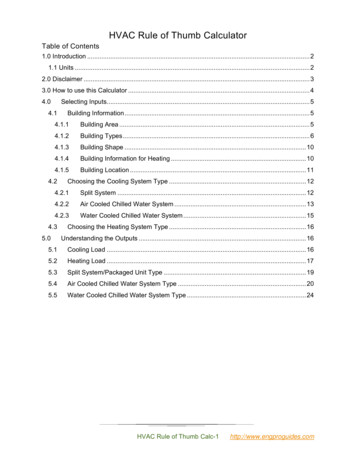
COST OF OWNERSHIPOnce you have entered values for all of the facilities-related budget items, thecalculator divides the Total Costs by the Total Square Footage and Total UsableHours per Year to determine the Annual Cost per Square Foot (column E in theExcel file) and the Cost per Usable Hour per Square Foot (column F).ADDOPERATING COSTS 52,662,681 ADMIN COSTS 5,903,994 CAPITAL COSTS 89,580,385 TOTAL COSTS 148,147,060Cost of Ownership by Square FootTOTAL COSTSDIVIDED BY 148,147,060SQUARE FEET (SEE P. 2)9,317,862ANNUAL COST PER SQUARE FOOT 15.90Cost of Ownership by Square Foot Per HourTOTAL COSTSDIVIDED BY USABLE HOURS (SEE P. 2)COST PER USABLE HOURPER SQUARE FOOT4 — School Facilities Cost Calculator 148,147,0602,500 0.00636
STEP 3: SET JOINT-USE POLICIESThis tab helps you develop a joint-use fee policy and structure. The worksheetincludes five categories of users, each of which is charged a particular percentageof the costs associated with their use of the district’s facilities.SetJoint- ‐UsePolicies- ‐- icyDecisioPrivateUsers2200%Level5PolicyDecisioYou can customize the categories of users and the percentages charged to them inthe fields highlighted in yellow.Level 1: Civic Users — These are organizations or individuals from the local community who use the schoolfacilities for civic purposes, such as voting, community meetings, informal recreation, and shelter in anemergency. The policy in the example above would give them free use of the building as a public benefit.Level 2: Program Partners — These are nonprofit organizations or other public agencies that use the schoolfacilities and whose primary purpose is to provide programs and/or services that are designed and operated toadvance the academic success of the children in the school. The example above charges them only 25% of thecost.Level 3: Community Users — These are nonprofit organizations or other public agencies that use the schoolfacilities and whose primary purpose is to provide programs and/or services that serve the local neighborhoodor community, but are not explicitly designed and operated to advance the academic success of the children inthe school. The example above charges them only 50% of the cost.Level 4: Private Users 1 — These are organizations, for profit or nonprofit, that are using the facility to raiserevenue. The example above charges them 100% of the cost.Level 5: Private Users 2 — These are for-profit organizations that are using a facility for business purposes. Theexample above charges them 200% of the cost.A transparent fee and subsidy structure is only one part of policy needed to supportjoint use. See www.bestfacilities.org to learn more about policy frameworks thatsupport the joint use of public schools.5 — School Facilities Cost Calculator
STEP 4: APPLY FEE STRUCTUREThis tab allows you to enter the Net Square Footage for different types of spaces,such as classrooms, cafeterias/multipurpose rooms, and gymnasiums. Thecalculator will help you determine the fees to charge for different types of spaces.Then, based on the policies established in Step 3, you can decide the percentage offacilities costs that you want to recover — in this example, from 0% to 200%.ApplyFeeStructure(SampleData)- ‐- yFeeStructure(SampleData)- ‐- ‐EnterdistrictinformationJoint- ‐UseSpace wherefieldsareyelloTypeofSpaceTypeofSpaceJoint- CoreSpaceFactorFootageFootageJ
replace the existing school facility or facilities — in this example, 250 per GSF. This varies depending on regional construction and labor costs, as well as the quality of design and construction. The market cost of a school facility replacement value should include the “hard” costs for construction, as well as the “soft” costs for design and project management. It would not .