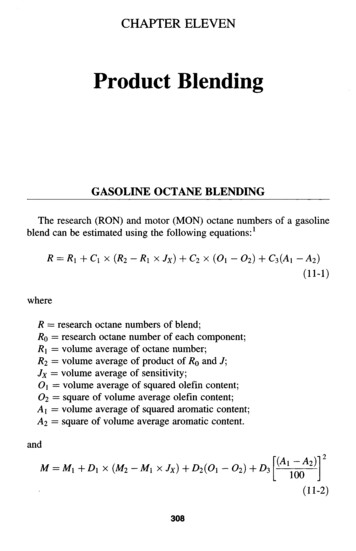
Transcription
7 Steps to Data Blendingfor Predictive AnalyticsCRG Solutions Pvt n
Evolution of AnalyticsJust as the volume and variety of data has grown significantly in recentyears, so too has the expectations for analytics. No longer is a standarddashboard depicting what happened last month acceptable fordecision-makers.To get ahead of the competition and improve their company’s bottom line,data analysts need to understand what is likely to happen in the future sothe organization can be more prepared to make impactful changes.Predictive analytics allows organizations to gain an edge by analyzingcurrent and historical data to better understand and predict the likelihoodof future events.The most challenging aspect of predictive analytics is getting the right dataready for analysis. This is where data blending can help.7 Steps to Data Blending for Predictive Analytics
What is Data Blending?What started out as a means to an end for a data analystwho dealt with a single source of data has led to the needto combine multiple sources of data.Throughout this evolution, data blending has empoweredthose analysts in the line of business with the ability toaccess and combine data from multiple sources to revealdeeper intelligence that drives better businessdecision-making.Analysts use data blending to build an analytic datasetto answer a specific business question or take advantageof opportunities, with insight into customer preferences,marketing campaign results, financial operations, site andmerchandising optimization, and much more.Traditional DataEnrichment DataDemographicEmerging DataCloud AppsFirmographicCRMIndustry-specificAmazon RedshiftData WarehouseSpatialGoogle AnalyticsMarketoExcelTwitterMarketing Data MartNew Business OpportunitiesCustomer AnalyticsFinancial & Statistical AnalysisPredictive AnalyticsSpatial Analysis7 Steps to Data Blending for Predictive Analytics
What is Data Blending forPredictive Analytics?In order to improve predictive analysis/models/outcomes, you need to makesure you are working with the right data. But there are more sources andformats of data than ever before that you need to incorporate to make themost informed decisions.Data blending for predictive analytics helps analysts like you spend more timeon model creation, evaluation, and deployment and less time on preparingdata for analysis.Analysts trying to do predictive analytics struggle with:Relying on data scientists or ITto prepare your data can be timeconsuming and delay your outcomesMany analysts don’t have the righttools to blend data or performpredictive analytics Accessing the right types and systems of data Preparing and cleansing data Joining multiple datasets Delivering a repeatable process for future analysis Relying on others to create the dataset they needAnalysts have to remember andrepeat the same tedious stepswhenever data changes7 Steps to Data Blending for Predictive Analytics
Recipe for faster data blendingIngredients you needGet access to all of the data you need A copy of Alteryxalteryx.com/download2Understand your data A list of the data sources youwant to blend3Prepare and cleanse data4Transform and restructure data5Join the data for analysis6Incorporate predictive analytics7Output to existing predictive models1 Access to each database orsource you are going to use A rough specification of thedataset you needSee demo videos on DataBlending at utions/data-blending7 Steps to Data Blending for Predictive Analytics
1Get access to all of the datayou needRecipe foranalytic greatnessAnyone can make decisions based on data, but in order to makeaccurate decisions about things that can have a long-term effect onyour company, the more data you have to work with the better. Work with IT to ensure youhave the right credentials toaccess your data sourcesGetting the data you need for predictive analysis used to be achallenge. Alteryx gives you the ability to access data of any typefrom any source: Analyze all data typeswithout data size limitations(survey data, log files, mobiledata, XML) Use an Input tool to access data directly from a relationaldatabase or directly from your desktop in formats such as Excel,SAS, SPSS, ERSI, MapInfo, and more Use direct connectors to access social media data, such asTwitter and Foursquare Use cloud connectors to access Salesforce.com, Marketo, GoogleAnalytics, Amazon S3, and moreInput toolTwitter toolSalesforce.com Input tool Alteryx provides third-partydata from Experian, Dun &Bradstreet, and TomTom toenrich your current datasets You can even connect toSPSS (.sav) or SAS (.sas7bdat)files to incorporate data fromexisting predictive models7 Steps to Data Blending for Predictive Analytics
2Understand your dataOnce you gain access to your data, data investigation can help youunderstand the important details of your data.Alteryx has a wide range of tools to help you investigate your data: Understand counts and percentages of your data with aFrequency Table See combinations of field values and/or percentages with aContingency Table View descriptive statistics for all of your selected variables withother tools, such as the Field Summary toolRecipe foranalytic greatness Interactive visualizations inAlteryx Analytics allow youto better understand andexplore your data Take advantage of miningtechniques, such asAssociation Analysis, to findout what fields are relatedDRIFrequency TableDRInput tool: Connect toCustomer DatabaseIContingency Table7 Steps to Data Blending for Predictive Analytics
3Prepare and cleanse dataAs an analyst, you probably wish you could spend more timeanalyzing data than preparing it for analysis. Alteryx helps cutdata preparation time by up to 30%, giving you more time to testhypotheses and evaluate models.Alteryx includes a variety of tools to ease the data preparation andcleansing process: Pick the Auto Field tool to automatically set the field type foreach string field Use the Select tool to change field types or names Select the Filter tool to isolate a subset of the data in which youare interestedRecipe foranalytic greatness Make product names,categories, and user IDsconsistent as you bringmultiple datasets together Read CSV or XML files in asstrings or text fields Utilize parsing tools, such asRegular Expression and XMLParse, to convert, match, andreplace dataTTInput tool: Connect toCustomer DatabaseFilter tool: Isolatea subset of dataInput tool: Connectto Product SalesAuto Field tool: Automaticallychange field typesSelect tool: Changefield names7 Steps to Data Blending for Predictive Analytics
4Transform and restructure dataData comes in all shapes and forms, so getting the data in a formatyou need for analysis can oftentimes require transforming orrestructuring it to fit your needs.Alteryx delivers capabilities to simplify this process: Use the Summarize tool to aggregate data; e.g., calculate TotalSpend and Number of Transactions by Customer ID. (Note: TheSummarize tool does the work that pivot tables do in Excel) Select the Transpose tool or Crosstabs tool to rearrange fields inyour data Utilize the Formula tool to create expressions, which are similarto formulas you can create in ExcelSummarize tool: Count the number oftransactions, and add the value of the transactionsRecipe foranalytic greatness Group and countrecords passing througha data stream Determine min and maxvalues, plus keep arunning total Crosstab and transposeon a full dataset ratherthan working in separatespreadsheetsTranspose tool: Move data fromcolumns to rows (or vice versa)Formula tool: Create a new fieldbased on IF THEN statements7 Steps to Data Blending for Predictive Analytics
5Join the data for analysisOnce you have cleansed and shaped multiple sources of data,bringing that data together to create one dataset that can be usedfor predictive analytics is the next critical step.Alteryx can join data in many ways: Combine two or more data streams with similar structures into asingle stream using the Union tool Use the Join tool to combine multiplefields without having to pre-process andconcatenate key fields together Perform inner and outer joins withoutthe multiple VLOOKUP expressions thatmake combining data in Microsoft Excelhazardous Incorporate Fuzzy Matching to handlenon-exact matching of customer namesor addresses (e.g., John, Jon, Johnny, orJonathan)LRecipe foranalytic greatness Bring together fields thatdon’t match exactly using theFuzzy Match tool Create a macro that bringsin all spreadsheet tabs in asingle clickLJRRJoin tool: Combine datastreams on common fieldsUnion tool: Combine each datasource into a single stream7 Steps to Data Blending for Predictive Analytics
6Incorporate predictive analyticsIncorporating predictive analytics in Alteryx is as easy as dragging atool onto the same canvas used for data blending. Alteryx removesthe complexity of predictive analytics by eliminating the need forcoding, yet it is also flexible enough for more advanced users.Alteryx has over 30 drag-and-drop tools for modeling, grouping, andtime series, all built on the R programming language: Use the Logistic Regression tool to determine if someone willrespond to an ad or campaign Utilize the Boosted Model tool to understand the importance ofpredictor fieldsRecipe foranalytic greatness Improve forecasting withTime Series tools Easily access the R codebehind the Alteryx tools tobetter understand it or evenmake alterationsOutput tool: Export data inthe format you need Incorporate your owncustom R models utilizingthe R tool Cluster or group members quickly by using a K-CentroidAnalysis tool Use the R tool to allow Rprogrammers to bring in theirown code or scriptsLogistic Regression toolBoosted Model toolK-Centroids Analysis toolR tool7 Steps to Data Blending for Predictive Analytics
7Output to existingpredictive modelsMany organizations, and the analysts within them, spend asignificant number of hours at an exorbitant cost to build predictivemodels and deploy them throughout their organization. Alteryxdoesn’t force you to replace everything you have built, but insteadenables you to take advantage of these existing models. Incorporate your own pre-built R models utilizing the R tool Output to SPSS (.sav) or SAS (.sas7bdat) files to take advantageof models already in place in an organization“Over the past five yearswe developed over a dozenmodels, but had outgrownthe current architecture wewere using. Primarily mostof our bottlenecking wasin the data preparation anddata processing stage of themodeling.I downloaded a trial of Alteryxand a process that would havetaken 25 minutes to do underour old architecture took lessthan 5 seconds in Alteryx, and Ifigured I was onto something.”– Michael BaronePredictive Modeling Analyst, Paychex7 Steps to Data Blending for Predictive Analytics
7Output to existingpredictive models#11T23T#2FLLJRCustomers withtransactions.savR45F Use the R tool to write your own R script or bringin a pre-built R model into an Alteryx workflowCustomers withtransactions.sas7bdat Output to SPSS or SAS and take advantage ofexisting models within your organization7 Steps to Data Blending for Predictive Analytics
Output Predictive Analytics toVisualizationsPredictive outcomes can often be best explained throughinteractive visualizations. Alteryx works with the top twovisualization technologies in the market to help users understandtheir data through visualizations. Alteryx can output directly to the Tableau TDE file format or theQlik QVX file format, providing performance gains by compilingcomputations prior to rendering your visualizationsRecipe foranalytic greatness Use Alteryx Server on ascheduled basis to provideincremental updates toTableau or Qlik, ensuringyour visualizations arealways up-to-date Alteryx can also launch Tableau workbooks, updating theunderlying data but displaying the results in your dashboards Data from Alteryx can update and launch dashboards in bothQlikView and Qlik SenseTableau Workbook Tool:Immediately launch your results inyour favorite Tableau WorkbookQlikView Worksheet Tool:Immediately launch your resultsinto QlikView or Qlik Sense7 Steps to Data Blending for Predictive Analytics
Bonus! Predictive Analytics forDecision- MakersThe Alteryx Analytics Gallery removes the need for decisionmakers to build analytic workflows, giving them an engagingexperience and the results they need to make betterbusiness decisions. Save and automate your workflow to run the same processeswith updated data and eliminate the potential for error Package your workflow into an analytic application that can runin a browser-based environmentRecipe foranalytic greatness Create a workflow once andreuse it for future processesor outputs Create a macro to easerepeatable processes Set permissions onworkflows and macros soonly the correct people canaccess them Give decision-makers the ability to customize and run analyticapplications without having to build workflows7 Steps to Data Blending for Predictive Analytics
Predictive Analytics in AlteryxEnables Reduced Marketing SpendTo optimize its marketing efforts, Southern States Cooperative reliesheavily on the predictive analytics tools within Alteryx.Deeper InsightsThe company was able to access and blend all relevant marketing andcustomer data from multiple sources, as well as perform predictive andspatial analytics to identify high-potential customers for targeted mailings.Hours vs. WeeksBy reducing time-to-insight from weeks to mere hours and increasing thevolume of insights gathered, the company was able to improve campaignresponse rates on an average by approximately 200 percent.Intuitive WorkflowDozens of analytic applications were deployed across the company—alldeveloped without any coding—performing tasks like data extraction,cleansing, exploration, and modeling in a single workflow.“Previously, to do statisticalanalysis or predictivemodeling, I would have toexport the data into anothersoftware solution. WithAlteryx, I am able to keep allof the analysis as part of thesame workflow. In fact, I cando all of my data extraction,cleansing, exploration, andmodeling in one module—seamlessly.”– Greg BuckoManager of Customer Insights7 Steps to Data Blending for Predictive Analytics
Alteryx Delivers on the three things analysts need mostEmpowered analysts who can access all the data they need,when they need itSingle intuitive workflow for a complete data blending& advanced analytics processDeeper business insight that can be achievedwithout relying on others7 Steps to Data Blending for Predictive Analytics
Next StepsTry data blending in Alteryxalteryx.com/downloadDownload the data blending kitbit.ly/datablendingkitView Customer videosalteryx.com/customers7 Steps to Data Blending for Predictive Analytics
Data Blending for Predictive AnalyticsThousands of data analysts worldwide rely on Alteryx daily.alteryx.com/solutions/data-blending
Analyze all data types without data size limitations (survey data, log files, mobile data, XML) Alteryx provides third-party data from Experian, Dun & Bradstreet, and TomTom to enrich your current datasets You c
