Transcription
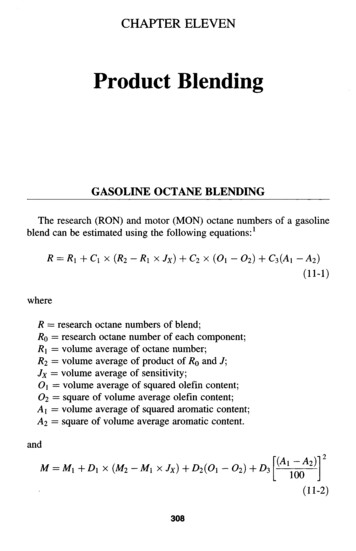
CHAPTER ELEVENProduct BlendingGASOLINE OCTANE BLENDINGThe research (RON) and motor (MON) octane numbers of a gasolineblend can be estimated using the following equations:1R R1 Cx x (R2 - Ri x Jx) C2X (Oi - O2) C3(Ai - A2)(11-1)whereR research octane numbers of blend;R0 research octane number of each component;R1 volume average of octane number;R2 volume average of product of R0 and /;Jx volume average of sensitivity;O\ volume average of squared olefin content;02 square of volume average olefin content;Ai volume average of squared aromatic content;A2 square of volume average aromatic content.andM M D1X(M2-M1XJx) D2(O1 - O2) D3 [ " j(11-2)
whereM motor octane of the blend;Mo motor octane of each component;Mi volume average motor octane;M2 volume average of product of M0 and J.These equations represent straight-line blending with three correctionterms added to account for the blending deviations normally experiencedwith gasoline blends. The first term (sensitivity function) is a correctionfor the blending deviation arising because octane numbers are determinedat compression ratio different from those at which the blends are rated.The second (function of olefin content) and third terms (function ofaromatic content) are corrections that reflect the influence of chemicalinteraction of the components in the blend.The coefficients to be used in octane blending follow. The RONequation coefficients areC1 0.04307C2 0.00061C3 - -0.00046The MON equation coefficients areD1 0.04450D2 0.00081D 3 -0.00645These coefficients are derived from the regression analysis of RON andMON data of actual laboratory blends.E X A M P L E 11-1Determination of the RON and MON of a gasoline blend are done withthe help of a spreadsheet program, assuming the RON, MON, aromatic,and olefin content of all blend components are available. Sample data onthe properties of gasoline blend components such as the RON, MON,
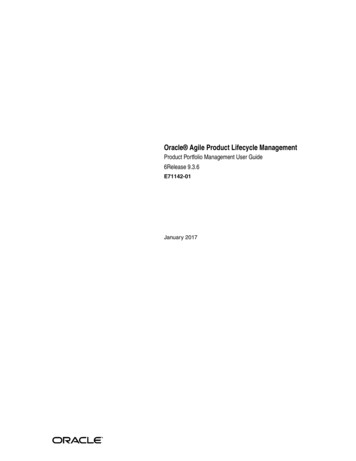
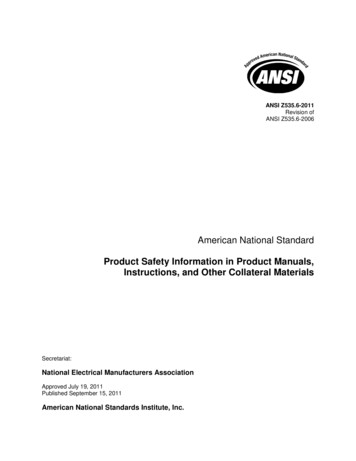
aromatic, and olefin content of the blend components and calculationsfor computing the RON and MON of the blend by equations (11-1) and(11-2) are shown in Tables 11-1 and 11-2.GASOLINE BLENDING BY THE INTERACTIONCOEFFICIENT METHOD2In a given refinery, where the maximum number of gasoline blendcomponents and their properties are known, it is possible to develop anaccurate blending spreadsheet program, using the individual blendstockproperties and the binary blend interaction coefficients. The only additional laboratory work required is the determination of the properties:RON, MON, and ASTM distillation of all possible binary blends for agiven number of blend components.Interaction coefficients are determined for all binary blends and usedin the model to accurately predict the properties of any gasoline blend ofthese components.BLENDING ALGORITHMA study of the gasoline blending data has shown that nonlinear gasolineblending behavior can be described by an equation of the following type:PcALC PyOL /(1,2) X Xi X X2 /(1,3) 1 X X3 /(8,9) XX 8 XX 9where CALC calculated property;/3VOL volumetric weighted average property;/(1,2) /(8,9) the component interaction coefficients;X\. .Xg volume fraction of each component.The interaction coefficient for a binary blend can be calculated asfollows:(11-4)
Table 11-1Research Octane BlendingOLEFINAROMATICSENSITIVITY,2VOL % RON, R MON VOL % OLEF2VOL % AROMCOMPONENT(2)(3)(4)(6)(5)(7)(8)(1)LSRREF 90REF 95REF 97LCNMCNVBU 0600.1500.0400.000VOL 186.68415.0310.39NOTES:BLEND MON 90.72COLUMNS ARE IN PARENTHESES2 RON OF BLEND COMPONENTS.3 MOTOR OCTANE OF BLEND COMPONENTS.5 SQUARE OF OLEFIN CONTENT (4).7 SQUARE OF AROMATIC CONTENT (6).8 SENSITIVITY (RON - MON) OF COMPONENTS9-COL 8 x COL 1.10 COL 9 x COL 468.9495.2613.69213.537.440.00R*J947.60
Table 11-2Motor Octane BlendingOLEFINAROMATICSENSITIVITY,VOL %, RON, MON, M,VOL %, OLEF2, VOL %, AROM 2 ,COMPONENT(2)(3)(5)(6)(8)(4)(7)(1)LSRREF 90REF 95REF 97LCNMCNVBU 0600.1500.0400.000VOL 186.68415.0310.39NOTES:BLEND MON 80.07COLUMNS ARE IN PARENTHESES2 RON OF BLEND COMPONENTS.3 MOTOR OCTANE OF BLEND COMPONENTS.5 SQUARE OF OLEFIN CONTENT (4).7 SQUARE OF AROMATIC CONTENT (6).8 SENSITIVITY (RON - MON) OF COMPONENTS9 COL 8 x COL 3.10 COL 9 x COL 0404.8886.0712.92181.557.280.00R*J,827.99
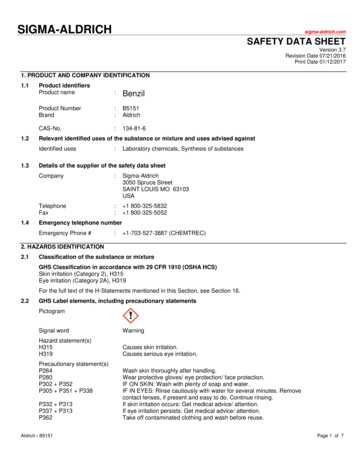
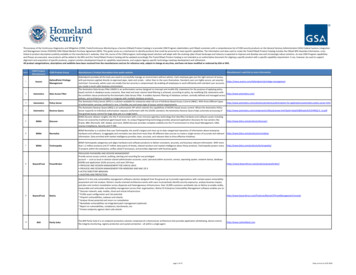
where1(A1B) — interaction coefficient of components A and B\ ACTUAL property of the blend, as determined in the laboratory;P VOL volumetric weighted average property of the blend;VA j VB volume fractions of components A and B.In this model, the concept of a blending interactions coefficient is considered and a spreadsheet model developed to predict the octane andvolatility of the multicomponent blend.EXAMPLE 11-2An example of the interaction coefficient method spreadsheet for amulticomponent blend follows. We want to determine the RON, MON,and ASTM distillation of a blend of these components:FCC light naphtha (LCN)FCC medium naphtha (MCN)Light straight run (LSR)Polymer gasoline (POLY)Reformate 95 RON (REF 95)Reformate 97 RON (REF 97)The following properties are determined in the laboratory for each ofthe blend components and for all possible binary blends: RON, MON, andASTM distillation; percent evaporated at 150 , 195 , 250 , and 375 F.The number of binary blend components determines how many binaryblends are possible. Hence, for a six-component blend, 15 binary blends arepossible. All the 15 binary blends are made in the laboratory and theirproperties determined for computing the interaction coefficient for eachbinary blend. Once the binary interaction coefficients are known, the properties for any blend composition can be determined by means of the blendingequation. The calculations are facilitated by means of a spreadsheet program.The properties of the pure components and all binary blends interaction coefficients are shown in Tables 11-3 to 11-6. To calculatethe properties (RON, MON, distillation) of the blend, the blend composition is entered in Table 11-6 and the blend properties are read fromTable 11-7.
Table 11-3Blend Component PropertiesCOMPONENTLCN MCN LSR POLY REF 97 BUTANEDENSITYVAP. PRESSUREpsiaASTM DISTILLATIONVOL% EVAPORATED0IBPC0@ 60 C@ 65 C@ 800C@120 C@190 CFBP, CFIA ANALYSISSATURATESVoI %OLEFINSVoI %AROMATICSVoI %SULFUR%W/WOCTANE NUMBERRONMON0.709.10.752.637.0 53.024.50.032.50.551.04.088.0 55.0100.0 100.0158.0 55.097.582.997.287.187.187.0ASTM DISTILLATION BLENDINGTwo methods are available for estimating the ASTM distillation ofa blend: Edmister's method and empirical correlation.EDMISTER'S METHODASTM distillation is converted to the true boiling point (TBP) distillation using Edmister's correlation. The blend TBP can be determinedsimply by adding together the volumes contributed by all the componentsat a chosen temperature, dividing by the total volume, and plotting atemperature vs. percent distillation chart. The TBP distillation vs. temperature graph can be converted back into ASTM distillation again, byusing Edmister's correlation in the reverse.This procedure is not very accurate and the blend can be off by asmuch as 8-100C. The inaccuracy can be attributed to the inadequacy of
Table 11-4Quality of Binary Blends and Interaction CoefficientsCOMPONENTPAIRCOMPONENT A, VOL%COMPONENT B, VOL%VAPOR PRESSURE barASTM DISTILVOL% EVAPORATED@ 600C@ 65 C@ 800C@ 120 C@ 1900CLCNMCN0)LCNLSR(2)LCNPOLY(3)LCNREF F 97(8)MCNBUTANEO)LSRPOLY(10)LSRREF 97(11)LSRBUTANE(12)POLYREF 97(13)POLYBUTANE(14)REF 1.555.5100.0RONRON @ 0.40 TELRON @ 0.84 97.8101.6102.792.8100.8103.596.8102.1104.5MONMON @ 0.40 TELMON @ 0.84 788.589.485.087.288.086.694.197.0COEFHCIENTSVAPOR PRESSURE, psiaASTM DISTL.VOL% EVAPORATED@ 600C@ 65 C@ 80 C@ 120 C@ 00-3.000-2.000-1.00013.600 .000-5.0001.000-6.0003.00010.00011.90517.38122.381 6714.0002.66711.333-2.533NOTE: COLUMN NUMBERS ARE IN PARENTHESES.
Table 11-5Weighted URE0ASTM 60 C -0.750065 -0.780080 -0.0600120 0.1800190 0.0000RON0.1440MON0.4800LCNLSR(2)LCNPOLY(3)LCNREF 97(4)LCNBUTANE(5)MCNLSR(6)MCNPOLY(7)MCNREF 97(8)MCNIBUTANE(9)LSRPOLY(10)LSRREF 97(11)LSRBUTANE(12)POLYREF 97(13)POLYBUTANE(14)TOTALVOL.REF 97 INTERACTION AVG ESTIMATEDBUTANE COEFFICIENT QUALITY 18.021229.537861.940599.161593.329784.3749
Table 11-6Blend CompositionBLENDVOL%LCNMCNLSRPOLYREF 97BUTANE0.300.100.050.120.400.03TOTAL1.00Table 11-7Blend Results by InteractionCoefficient MethodVAPOR PRESSUREASTMDISTILLATION60 65 80 120 190 RON CLEARMON 's correlation, particularly in converting ASTM distillation toTBP distillation.GRAPHICAL SUMMATION METHODAn empirical method is described for estimating ASTM distillation ofa blend from its composition and ASTM distillation temperature of blendcomponents. This method is used for the following calculations: estimateof the initial boiling point (IBP), 10%, 20-90% points and the estimationof the ASTM end point.Determination of ASTM IBP, 10%, 20-90% Points of BlendThis method is applicable to blends containing distillate stocks havingan ASTM initial boiling point higher than 85 F and an ASTM end point
lower than 7000F. It is based on the observation that a straight summationline can be drawn through an ASTM distillation point of a blend.The slope of this line is such that the sum of the proportions of eachblend component corresponds to its intersection with ASTM distillationcurve. For TBP distillation, the summation lines are parallel to volumepercent axis on an ASTM distillation plot. ASTM summation lines slopedue to poor fractionation of ASTM distillation, and the slope variesaccording to distillation end point. The slope to be used E OFSUMMATION LINE, F-180 0 F PER 100% DISTILLED-180 0 F PER 100% DISTILLED-100 F PER 100% DISTILLED-80 0 F PER 100% DISTILLED-50 F PER 70% DISTILLED-20 F PER 70% DISTILLEDASTM 10-90% PointsASTM distillation curves are drawn for each blend component, withthe temperature on the vertical axis and the volume percent distilled onthe horizontal axis. Distillation must be on a consistent basis for allcomponents; that is, either percent evaporated or percent recovered.A guess is made on the temperature at which a given proportion of theblend is distilled, and the corresponding point is marked on the graph. Asummation line of specified slope is drawn through the point. The vol%distilled is read off vertically below the intercept of the summation lineand ASTM distillation curve of the each component (Figure 11-1). Thesums for all blen
the blend components and for all possible binary blends: RON, MON, and ASTM distillation; percent evaporated at 150 , 195 , 250 , and 375 F. The number of binary blend components determines how many binary blends are possible. Hence, for a six-component blend, 15 binary blends are possible. All the 15 binary blends are made in the laboratory and theirFile Size: 1MBPage Count: 33