Transcription
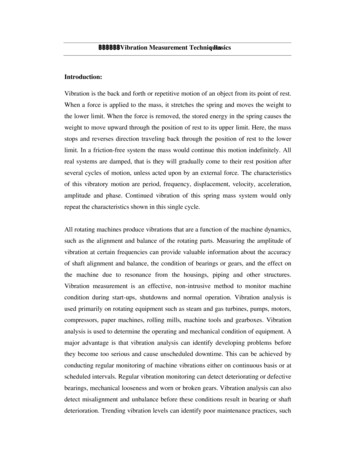
Vibration Measurement Technology for ConditionMonitoring B&R
Agenda – Application part – Day 1 Physical basics Impact SoundResonance frequencySensor position Vibration Analysis – Signal Processing Basics Frequency domainSignal processing block diagram overviewEnvelope calculationTime signal bufferFrequency spectrum calculation (using FFT)Signal processing block diagram discussion Vibration Analysis – Signal Processing Basics - Exercises
Agenda – Application part – Day 2 Functionality X20CM4810 Characteristic values of the channelConfigurable frequency bandsAnalog InputsBuffer Upload AsVib Library / Driver solution Workshop – Measurement of unbalance Parameterization X20CM4810 Workshop – Measurement of periodic hits
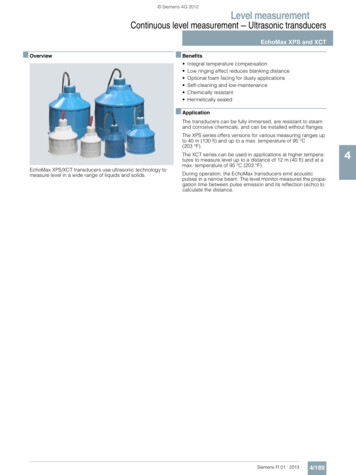
Agenda – Application part – Day 2 Workshop – Measurement of damaged bearings Analyze frequency bands, characteristic values Vibration Analysis – Signal Processing Basics - Dynamic VelocityChanges Application examples Summary
Physical basics
Impact Sound Stimulated in in solid medias Different to air or water sound Additional frequencies are stimulated Fundamental wavecarrier wave as air or impact soundResonance frequencies Frequency independent of the fundamental wave Amplitude strongly depended on the fundamental wave
Resonance frequency Amplitude depended on the fundamental wave Up to a resonance catastrophic
Sensor position Sound propagation of mechanical faults Radial to the shaft- - Amplitude depending of The distance to the SourceThe damping between source and sensor
Sensor position Optimum position Not reachable every time and in many cases not necessarySource: Wago If you use sensitive sensors and hardware with high resolution (and lessnoise) and if you use trend analysis the number of sensors are reducible In many cases optimum position isn‟t necessary
Sensor mounting How you mount is sometimes more important than where The best will be a screwing mounting on a plane surface With screwing mounting Silicon grease decrease the frequency dampinginsignificantly Attention if you're using magnet mounting Shock on a Sensor With strong vibrations it‟s getting easily detached Faulty signals
Shock on a Sensor
Vibration Analysis – Signal ProcessingBasics
Time domain, frequency domainamplitude Idea: Addition of sine waves to generate signals00.511.5time [s]22.5310.5 40.50.60.70.80.9110.5 010.5 010.5 0amplitude 10-110-100.511.5time [s]22.53
Time domain, frequency domainamplitude 10-1amplitude Idea: Addition of sine waves to generate signals10-10.511.5time [s]22.5300.511.5time [s]22.5310.5 .70.80.9100.10.20.30.40.50.60.70.80.9110.5 010.5 0amplitude 010-100.511.5time [s]22.53
Time domain, frequency domainamplitude amplitude 10-110-1amplitude Idea: Addition of sine waves to generate signals10-10.511.5time [s]22.5300.511.5time [s]22.5300.511.5time [s]22.5310.5 .70.80.9110.5 0amplitude 010-100.511.5time [s]22.53
Time domain, frequency domainamplitude amplitude 10-1amplitude 10-110-1amplitude Idea: Addition of sine waves to generate signals10-10.511.5time [s]22.5300.511.5time [s]22.5300.511.5time [s]22.5300.511.5time [s]22.5310.5 0amplitude 000.10.20.30.40.50.60.70.80.9110-100.511.5time [s]22.53
Time domain, frequency domainamplitude amplitude amplitude 10-1amplitude 10-110-1amplitude 10-110-1amplitude Idea: Addition of sine waves to generate signals10-100.511.5time [s]22.5300.511.5time [s]22.5300.511.5time [s]22.5300.511.5time [s]22.5300.511.5time [s]22.5300.511.5time [s]22.53
Time domain, frequency domain00.50.51111.5time [s]1.5time [s]1.5time [s]1.5time 1.5time [s]2amplitudeamplitude10-100.511.5time litude10-10Frequency domain1.510.50amplitudeamplitude10-1amplitudeTime domain1.510.500246frequency [Hz]8100246frequency [Hz]8100246frequency [Hz]8100246frequency [Hz]8100246frequency [Hz]8100246frequency [Hz]810
Time domain, frequency domain Every signal can be created by adding sine waves Vice versa Every signal can be disassembled into sinewavesDiscrete Fourier-Transformation,Fast Fourier-Transformation (FFT)
Signal Processing X20CM4810
Signal processing block diagramAccelerationsignal 100 mV/g(19,4us update)EnvelopeBuffer of timebased signal(300ms update)Buffer of frequencyspectrum(300ms encybands(300ms update)X2XLinkX2XLink
Envelope calculationAccelerationsignal 100 mV/g(19,4us update)EnvelopeBuffer of timebased signal(300ms update)Buffer of frequencyspectrum(300ms encybands(300ms update)X2XLinkX2XLink
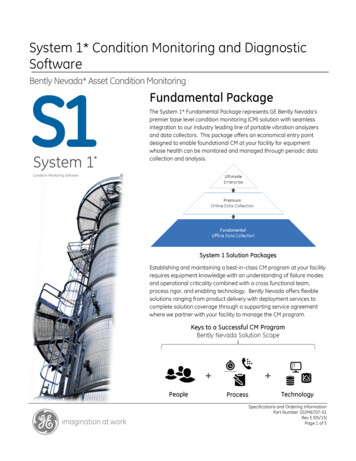
Envelope calculation1086amplitude [g]420-2-4-6-80.040.060.080.10.12time [s]0.140.160.18
Envelope calculation10original signalenvelope signal86amplitude [g]420-2-4-6-80.040.060.080.10.12time [s]0.140.160.18
Time based signal bufferAccelerationsignal 100 mV/g(19,4us update)EnvelopeBuffer of timebased signal(300ms update)Buffer of frequencyspectrum(300ms lc.Frequencybands(300ms update)X2XLinkX2XLink
Time based signal buffer1.51 Not all incoming values are stored inthe buffer! Fixed number of values: 8192amplitude Ringbuffer0.50-0.5-1-1.5 Variable timespan: 318ms (eachsecond value) to 15,9s (each00.51Buffer1.5selectedvalueshundredth value) indirectly set by the user A copy of the ring buffer is passed tothe FFT block every 300msCopy allentries2time
Frequency spectrum calculation (using FFT)Accelerationsignal 100 mV/g(19,4us update)EnvelopeBuffer of timebased signal(300ms update)Buffer of frequencyspectrum(300ms encybands(300ms update)X2XLinkX2XLink
FFT overview Buffered values of the time based signal Frequency spectrum with spectral linesFFTChannel 04 Spectrum Acceleration500Amplitude [mg]4003002001000050010001500Frequency [Hz]20002500
FFT frequency resolutionbuffer time [s]FFTChannel 04 Spectrum AccelerationChannel 04 Spectrum Acceleration500500frequency resolution [Hz] 400300200Zoom1000Amplitude [mg]Amplitude [mg]4001 / buffer time [s]300200100050010001500Frequency [Hz]2000250001520Frequency [Hz]25
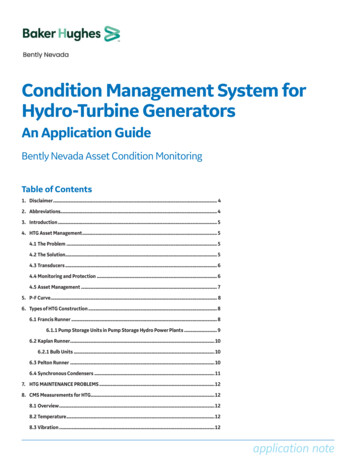
FFT number of spectral lines Buffered time based values X20CM4810-Module 8192 MesswerteChannel 04 Acceleration Raw AmplitudeAmplitude [mg]15001000500000.511.5Time [sec]Channel 04 Spectrum Acceleration Amplitude [mg]0.4 lines X20CM4810-Module SpectraldataFreqBand274096 ( 8192 / 2) spectral lines0.30.20.10050010001500Frequency [Hz]20002500
FFT time based signal Module configuration “max. frequency”max. frequency10000 Hz5000 Hz2000 Hz1000 Hz500 Hz200 Hzsample frequency25781 Hz12891 Hz5156 Hz2578 Hz1289 Hz516 Hzbuffer requency resolution3.147 Hz1.5736 Hz0.6294 Hz0.3147 Hz0.1574 Hz0.0629 HzChannel 04 Acceleration Raw AmplitudeAmplitude [mg]15001000500000.51Time [sec]buffer time [s] 1,5888s1.5
FFT time based signal Module configuration “max. frequency”max. frequency10000 Hz5000 Hz2000 Hz1000 Hz500 Hz200 Hzsample frequency25781 Hz12891 Hz5156 Hz2578 Hz1289 Hz516 Hzbuffer requency resolution3.147 Hz1.5736 Hz0.6294 Hz0.3147 Hz0.1574 Hz0.0629 HzChannel 04 Acceleration Raw AmplitudeAmplitude [mg]100X: 0.5756Y: 24.570-100X: 0.5754Y: -88.47-2000.5720.5730.5740.575Time [sec]0.5760.5770.578sample time [s] 1 / 5156 HZ 193us
FFT frequency spectrum Module configuration “max. frequency”max. frequency10000 Hz5000 Hz2000 Hz1000 Hz500 Hz200 Hzsample frequency25781 Hz12891 Hz5156 Hz2578 Hz1289 Hz516 Hzbuffer requency resolution3.147 Hz1.5736 Hz0.6294 Hz0.3147 Hz0.1574 Hz0.0629 HzChannel 04 Spectrum AccelerationdataFreqBand27Amplitude [mg]0.40.30.20.10050010001500Frequency [Hz]max. frequency 2000Hz20002500sample frequency / 2 2578 Hz
FFT frequency spectrum Module configuration “max. frequency”max. frequency10000 Hz5000 Hz2000 Hz1000 Hz500 Hz200 Hzsample frequency25781 Hz12891 Hz5156 Hz2578 Hz1289 Hz516 Hzbuffer requency resolution3.147 Hz1.5736 Hz0.6294 Hz0.3147 Hz0.1574 Hz0.0629 HzChannel 04 Spectrum AccelerationAmplitude [mg]0.50.40.30.20.10258260262264Frequency [Hz]266268270frequency resolution [Hz] 0,6294 Hz
Frequency band calculationAccelerationsignal 100 mV/g(19,4us update)EnvelopeBuffer of timebased signal(300ms update)Buffer of frequencyspectrum(300ms encybands(300ms update)X2XLinkX2XLink
Frequency band calculation 32 frequency bands Defined start and end frequencyDefined bandwidth and rotational axis velocity Calculation of the RMS-value
Block Diagram Discussion
Signal processing block diagramAccelerationsignal 100 mV/g(19,4us update)EnvelopeBuffer of timebased signal(300ms update)Buffer of frequencyspectrum(300ms encybands(300ms update)X2XLinkX2XLink
Vibration Analysis – Signal ProcessingBasics - Exercises
Automation StudioSample Project
Automation Studio sample project
Accessible informationAccelerationsignal 100 mV/g(19,4us update)EnvelopeBuffer of timebased signal(300ms update)Buffer of frequencyspectrum(300ms encybands(300ms update)X2XLinkX2XLink
VibrationDiagnosisTool.exe
Vibration Diagnosis Tool
Exercise “Unbalance” Sinusoidal vibration signal
Measurement of unbalanced shaftsSetup: Rotational velocity of the shaft 3600rpm 60Hz Simulation using a frequency generator 60Hz sinusoidal waveform Amplitude acceleration 500mg 353.5mg rms B&R acceleration sensor with 100mV/g resolutionSimulation using a frequency generator 100mV amplitudeMeasurement procedure:1. Set rotational velocity of the shaft2. Parameterize max. frequency of the raw signal3. Trigger spectra upload (cmdRun True)4. Transfer and visualize spectra using the VibrationDiagnosisTool.exe1.2.Raw time signal bufferRaw signal spectra
Measurement of unbalanced shafts Raw signal
Measurement of unbalanced shafts Spectra
Exercise “Rolling Bearing Damage” Periodic Shock Excitements
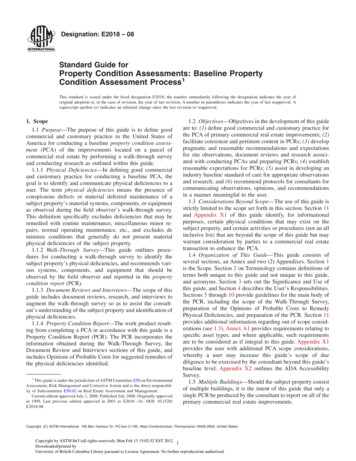
Measurement of rolling bearing defectsSetup: Rotational velocity of the shaft 3600rpm 60Hz Normalized damage frequency of the outer ring 3,383Hz Simulation using a frequency generator excitation at 203,0HzMeasurement procedure:1. Set rotational velocity of the shaft2. Parameterize normalized damage frequency of frequency band 033. Parameterize max. frequency of the envelope signal4. Trigger spectra upload (cmdRun True)5. Transfer and visualize spectra using the VibrationDiagnosisTool.exe1.2.Envelope time signal bufferRaw and envelope signal spectra
Measurement of rolling bearing defects Raw signal
Measurement of rolling bearing defects Envelope signal
Measurement of rolling bearing defects
Functionality X20CM4810
Your speakerKevin WeilpoltshammerResearch and development BU ControlsB&R Eggelsberg B&R
Characteristic values of the channel You get all 300 ms new values from the module for the followingparameters Characteristic values torRawSkewnessRawKurtosisRawIso10816Frequency bandsBroadband rms (root mean square) valueRms values coupled to rotation speedNoise
Characteristic values of the channel You get all 300 ms new values from the library / driver for the followingparameters (only available at function module “Standard” and “FastMaster”) Characteristic values ncy bandsBroadband rms valueRms values coupled to rotation speedNoise
Characteristic values of the channel You can read asynchronous from the module the following parameters(only available at function module “SlowMaster„ and“CANIOBusController„) Characteristic values 4SkewnessRaw01-04KurtosisRaw01-04Iso10816 01-04Frequency bands01-32Broadband rms valueRms values coupled to rotation speedNoise
Characteristic values of the channel You can read asynchronous from the module (for slow systems, or 3rdparty systems) for a monitoring without interrupts the followingparameters. Characteristic values -04Broadband rms valueRms values coupled to rotation speedNoise
Characteristic values of the channel You can read asynchronous from the module (for slow systems, or 3rdparty systems) for a monitoring without interrupts the followingparameters. Characteristic values -04Broadband rms valueRms values coupled to rotation speedNoise
Characteristic values of the channel PeakHighFrequency Maxim
Physical basics Impact Sound Resonance frequency Sensor position Vibration Analysis – Signal Processing Basics Frequency domain Signal processing block diagram overview Envelope calculation Time signal buffer Frequency spectrum calculation (using