Transcription
TABLEAU SOFTWAREColorado Statistical Analysis CenterKim English, Research DirectorLaurence Lucero, Analyst
Backgroundg BBecameaware off TTableaublas methodth d off presenting/interactingti /i tti withith ddatat Crime statistics web page Used BJS/SAC grant to provide training to SAC staff on Tableau First used Tableau with crime statistics, statewide and by county In 2015, General Assembly mandated studies AND analyses House Bill 15-1273—Law enforcement contacts on school grounds Requires disaggregation by crime type, law enforcement agency, schoolSenate Bill 15-185—Race/ethnicity and gender at major justice decision points Requires disaggregation by decision point, race/ethnicity, crime type
Basically .weyHAD to do something!g Laurence began learning Tableau andexperimenting with visuals, and working withthe Tableau Help Desk to get clarification andget them to fix bugs! We now use Tableau for: Crime statistics,, statewide and county,y, over time Community corrections (halfway house system)client profile by program, over time Length of stay in prison by crime type andgender over timegender, Recidivism of various justice populations overtime (TV, new crime), over time
What is Tableau?Tableau is a software tool whichproduces interactive data visualizationproductsd((graphs,h tables,blmaps etc.))focused on business intelligence
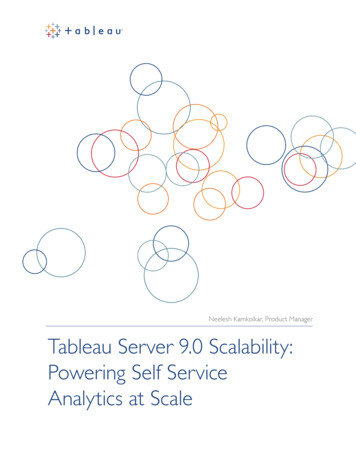
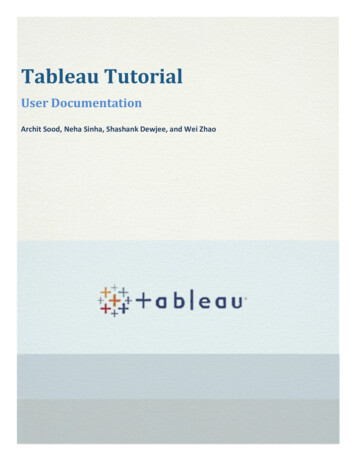
Tableau productsFree applicationenabling to open andview visualizationsFree Tableau Softwareto publish DashboardsEnterprise level. Publish andshare dashboards withinorganization with webweb-basedbasedserver.Installed on computersto create interactiveDashboards byconnecting to dataHosted version ofTableau server. Publishand share dashboardswith colleagues
Stepsp to Construct Visualization Format data to be compatible with Tableau (column variable).(Tableau Add-in available for Excel to format data for Tableau). Load data Build graphs in sheets Build dashboard including multiple sheets Publish dashboard onto the “Tableau Public”There is an option to allow or not the workbook and its data to bedownloaded by viewers. An url is generated Url embedded in website
Data EExcel,l Access,ATextT t filfile, JSON filfile, PDF filfile, SSpatialti l filfile, StStatisticalti ti l filfile etc.t Variables column Example:YearsCrime1997HomicideCO Number176CO RateUS NumberUS RateWhich4.5182086.8ViolentGroupYear19951999
Tableau Sheets and DashboardsLive Demonstration
Tableau Sheets and DashboardsLive Demonstration
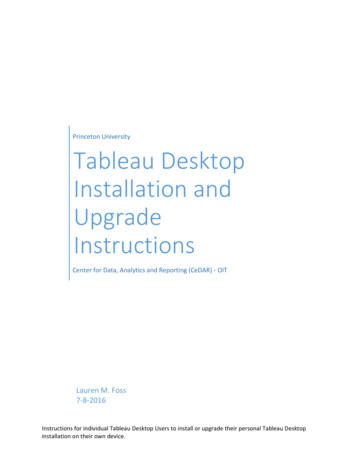
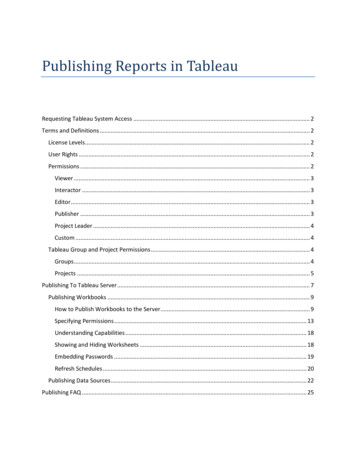
Tableau Maps Proportional symbol map Filled maps Flow MapsPoint Distribution MapSpiderpMapp
Some Highlightedg gFeatures D hbDashboardsd andd StoriesSt i Join multiple data sources Data: Discrete list of values. Continuous range of data. Dimensions/Measures:Dii/MDiDimensionsiare “T“Textual”l” iin nature andd cannot bbeaggregated; Measures are numeric values. Drag and drop: Measures and dimensions to create graphs/tables/maps and filters Marks: Details of the visualization (color(color, size of graphgraph, labellabel, tooltip).tooltip) Filters and Context – Can create a dependent filter from another numeric filter. Parameters: Dynamic values that can replace constant values in calculations,filters and reference lines. For example, create a calculated field that returnstrue if Variable than 50,000 and otherwise return false
Some Highlightedg gFeatures Geocoding: Tableau recognizes country names,names state/province names,names city namesand area codes for many countries. If location not recognized, ability to customgeocode the data and attribute geographic role. Mapping: Create views using maps to show data distributions by geographiclocations. Calculations: Powerful tool in Tableau. Ability to manipulate, calculate andmaneuver data quickly and easily. Calculation Types: - Calculated Fields: Custom calculations created usingg a Calculated Field editor Math operations across numbers, Logic Statements, Aggregating Data, ManipulatingStrings and Data formulas - Row and Column Totals - Table Calculations including Quick Table Calculations: Predefined calculationscreated locally in Tableau
Workingg within yourywebpagep g P bli h thePublishh ddashboardhb d iin “T“TableaublPPublic”bli ” Retrieve the url Embed the url into a webpage or direct link.
Thingsg to Know about Tableau Not always “intuitive” and training for users recommended – 1stbasic training (40-hour) is offered online Annual maintenance fee allows regular software updates ofproducts and technical assistance. Technical assistance is requested through a ticket system. Very active Community Forums – Good source for technical help
Examplespof Tableau dashboardsused at the Colorado SAC CiCrimeStStatisticsti ti Minority over-representation Correctional Population Community Corrections Profiles Length of Stay in Prison Recidivism Law Enforcement Contacts with Students Race and Ethnicity at Decision Points Marijuana (upcoming)
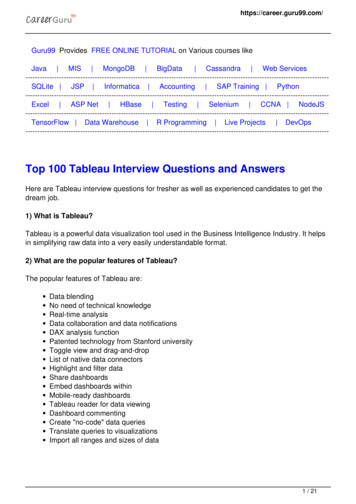
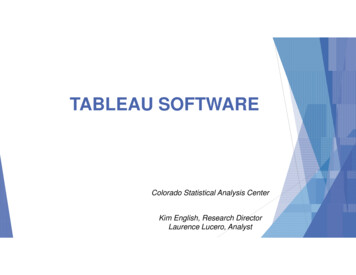
Some examples
Some examples
Some examplesp
Questions?https://www.colorado.gov/dcj-ors
Geocoding: Tableau recognizes country names Tableau recognizes country names, state/province namesstate/province names city names , city names and area codes for many countries. If location not recognized, ability to custom geocode the data and attribute geographic role.