Transcription
Controlled Dynamic Performance AnalysisSteven P. ReissDepartment of Computer ScienceBrown UniversityProvidence, RI. 02912spr@cs.brown.eduABSTRACTWe are interested in obtaining detailed performance informationon-the-fly from long-running systems without adversely affectingthe performance of the systems. We have developed amethodology consisting of a framework, DYPER, and a number ofspecialized agents called proflets each of which analyzes adifferent performance aspect. DYPER gathers performanceinformation with a guaranteed maximum overhead that isdynamically settable by the programmer using priorities set by theproflets. Moreover, the type of information that the system canprovide is generally only available for tools that generally have toomuch overhead to be usable in production or long-runningsystems. DYPER includes the ability to control and displayperformance data as the program is run.Categories and Subject Descriptorssoftware systems. Today’s systems are typically much morecomplex than previous ones and thus much harder tounderstand. They typically involve multiple threads that caninteract in non-obvious ways. They typically involvesignificantly more code, often millions of lines of source whenlibraries are considered. Moreover, they are often long runningsystems, often even servers that are designed to runcontinuously and forever.Traditional profiling tools are inadequate. They typicallyinvolve slowing the program down significantly, often by25%-100% or more, in order to get the necessaryinformation.They often provide only postmortem analysiswhich is not that helpful when one needs to consider a programthat never terminates or when one is interested in a particulartime slice of the execution rather than the overall execution.They are also generally limited in domain, concentrating onone aspect of performance or another, and not attempting toaddress all aspects simultaneously.B.8.2 [Performance and Reliability]: Performance Analysis andDesign Aids.Our goal has been to provide a performance analysis tool thatwill work with modern software systems. This led to severalrequirements:General Terms The tool must offer a guarantee on overhead. The toolshould let the programmer decide what the allowableoverhead for performance monitoring should be, be it 10%,1%, or even 0.1%, and the tool should ensure that it workswithin the given bound.Performance, ation.profiling,statisticalanalysis,1. INTRODUCTIONProgrammers often want to know about the dynamic behaviorof their program. They want to know about performanceanomalies and how they can eliminate them. They want toknow where the program is spending its time or what it isallocating or why they are not getting expected performanceout of multiple threads. They want to know the how long ittakes to respond to an event. They want to know aboutpotential bottlenecks and memory leaks.While a large number of tools have been developed to addressthese issues [51], most of these tools do not address modernPermission to make digital or hard copies of all or part of this work forpersonal or classroom use is granted without fee provided that copies arenot made or distributed for profit or commercial advantage and thatcopies bear this notice and the full citation on the first page. To copyotherwise, or republish, to post on servers or to redistribute to lists,requires prior specific permission and/or a fee.WOSP’08, June 24—26, 2008, Princeton, New Jersey, USA.Copyright 2008 ACM 978-1-59593-873-2/08/06. 5.00. The tool should provide on-the-fly analysis. Theprogrammer needs to know what the program is doing now. The tool should give the programmer control of theperformance analysis, allowing it to be reset and turned onand off either by programmer control or automatically basedon conditions in the program. The tool should consider multiple domains of performanceanalysis, addressing cpu usage, memory, thread behavior,etc. Moreover, new analyses, even ones specific to aparticular application, should be easy to incorporate. The tool should be flexible enough to be used to identifytransient performance issues. The tool should deal with multiple threads and multipleprocesses. The tool should be applicable to a wide range ofapplications. The tool should have a flexible interface that provides theprogrammer with an overview of what is happening, detailswhere they are important, as well as control of the analysis.In this paper we describe the DYPER framework we havecreated to meet these requirements. The framework treats
performance analysis as a resource allocation problem, doingthe necessary instrumentation at and for intervals that aredependent on the estimated priorities of the different analyses,on the allowable overhead, and on the costs associated with theanalysis. The framework provides multiple performanceanalysis agents we call proflets, handles multiple processes,and offers a web-based front end that gives the programmercontrol over the performance analysis tasks as well as on-linefeedback on what is currently happening.The next section goes over some of the related work andsimilar systems. Section 3 then describes the overallarchitecture of DYPER. Section 4 then describes the dynamiccontrol of the instrumentation based on resources. Thesubsequent section describes the current set of proflets.Section 6 describes the user interface. Finally, we concludewith a discussion of the tools effectiveness and our proposedfuture work.2. RELATED WORKPerformance analysis or profiling has been around for a longtime. Perhaps the best known tools are UNIX prof and gprof[20]. These use system facilities to sample the program counterperiodically (originally every 60th of a second, more recentlyevery 100th or 1000th of a second) to identify what routine iscurrently executing and instrument the start of every functionto get execution counts of either that function (prof) or of thatfunction and its caller (gprof). This approach, combiningstatistical sampling with some instrumentation is the basis ofmost of the performance analysis tools that have beenproduced.Prof and gprof are not perfect. They required separatecompilation to do the instrumenting and had a significantoverhead that was generally greater than 25%. Moreover, theyonly provided information about cpu utilization at the functionlevel, provide only postmortem information, and did not dealnicely with multiple threads. Most newer tools, ours included,are aimed at dealing with these deficiencies.Dealing with separate compilation involved developing toolsthat instrument the binary file directly. Pixie didinstrumentation at the basic block level on binary files [53].Tools such as EEL [26]provide a general framework that wasused for developing profiling tools [4]. Today there are avariety of instrumentation tools such as BCEL [16] andJikesBT [25] which we use for Java as well as Vulcan for .Net[52]. JRat provides an instrumentation framework for Javageared more toward profiling [50]. Alternative approaches isto use aspect-oriented programming tools such as Aspect/J todo the instrumentation [40], or provide a user-levelinstrumentation language [48].Dealing with the overhead has been more difficult. Sampling isrelatively inexpensive because it occurs relatively infrequentlyand can provide a lot of information [1,27]. However, some ofthe information a programmer wants for performance analysiscannot be obtained in this way. For example, it is very difficultto get counts, even approximate counts, of the number of timesa routine is called since sampling cannot distinguish one longcall from many smaller ones. However, sampling-only toolshave been used effectively for special purpose applicationssuch as providing the input needed to an optimizing compiler[59]. Our tools use samples to get as much of their informationas possible, and then, like the compilation tools, use this datato help dynamically determine performance issues andpriorities.Our current overhead measurements concentrate onCPU time, but a broader interpretation considering otherresources such as that of ROCC is possible [58].An alternative approach, used by JFluid [17] is to do selectiveinstrumentation of known performance bottlenecks,concentrating on cpu usage through dynamic call graphs.JFluid has the ability to dynamically instrument anduninstrument code so as to obtain statistical information aboutperformance with a relatively small overhead (1% to 2000%depending on the application and the percentage of time theprogram was instrumented). Our approach makes use ofsimilar techniques to achieve much of its performance.InsECTJ provides an alternative framework, letting the usercreate run time information that is then made available throughEclipse [49].Another approach is to do efficient instrumentation and to cutdown the amount of data that is collected. Techniques such aspath profiling [5], selectively instrumenting libraries [35], andrestricting the raw data by doing some initial analysis can allreduce the profiling overhead. Using additional availableprocessors, something that is becoming more common todaywith multicore architectures, is another approach [2]. Ourprevious work on visualizing dynamic program behavior madeuse of some of these techniques [44,45]. Another approachhere is that of Vetter and Reed where a variety of performancemetrics are gathered initially and then statistical techniques areused to limit instrumentation to those metrics that will be ofinterest [56].Another approach is illustrated by DTrace, Sun’s dynamictracing facility [12]. This uses a combination of hooks andbuffers inside the operating system, user-controlledinstrumentation that can be enabled and disabled dynamically,interactive displays, and programmable instrumentationfacilities to facilitate instrumenting production systems.DTrace is notable both for its flexibility and for the manymodules that incorporate it in Solaris. For example, there areDTrace hooks for most of the facilities of JVMTI available inJava 6 [31]. While we share many of the goals of DTrace andwe could build our system in part on top of its facilities, we gobeyond this by providing automatic control of theinstrumentation, the ability to trace across the Internet,specialized agents, and Internet-based displays.CA Wily’s Introscope uses agents that monitor interactionsamong web processes to identify bottlenecks and otherperformance problems in web applications with very lowoverhead [54]. It can identify problems at a high level, but notdelve into the internals of any component. KOJAK is anothermonitoring tool, this time specialized toward parallel programsusing hardware performance counter support within MPI [60].Dealing with on-the-fly statistics involves developing toolsthat can dynamically control and monitor the profiling. Thiswas done with gprof in FIELD [42] and in Sun Microsystemsprogramming tools [32]. More sophisticated techniques suchas allowing dynamic triggering of trace collection based onprogram events has also been tried, for example in JinSight[39].Prof and gprof relied on UNIX facilities to interrupt theprogram for profiling purposes at given intervals. Modernplatforms such as Java now offer a variety of facilities as abasis for profiling. For example, Java offers the JVMTI toolinterface [30] which superseded the original JVMPI profilinginterfaces [57]. JVMTI provides facilities for access stacks,
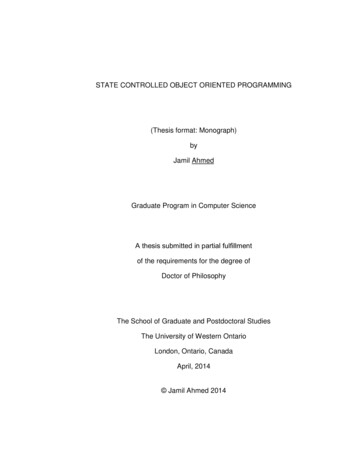
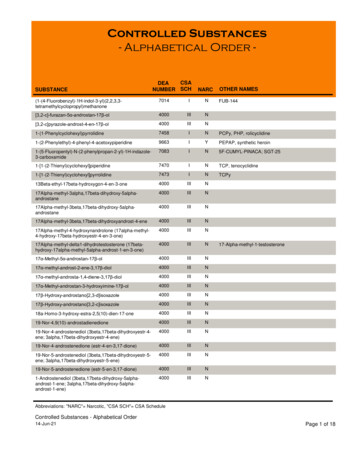
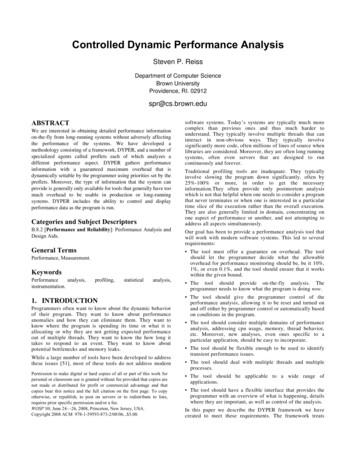
monitor thread states, analyzing the heap, looking at garbagecollection, monitoring locks, and trapping method entry andexit. It is the basis of most current profiling tools such as TPTPin Eclipse [18] and the OpenJDK package JConsole [14].However, when used extensively, JVMTI can introducesignificant overhead to an application, mainly due to Javatreating the JVMTI callbacks as native code. It is also nonselective; you can trap all method calls, but trapping onlyselected calls or allocations requires using debugging facilitiessuch as the setting and handling of breakpoints.More recently, in Java 5, Sun introduced the Java monitoringand management interfaces [15]. This interface provides ismore efficient, utilizing native Java hooks into the virtualmachine and offers some of the capabilities of the JVMTI withmuch less overhead. Its facilities include the ability to samplestacks, to monitor threads, to look at memory usage andgarbage collection, and to get timings for execution andblocking. Our tool makes use of this both JVMTI and themanagement interfaces, using the former for information notavailable from the latter such as a detailed analysis of the heap,and using the management interface to minimize overhead.Both JVMTI and the management interface also provide theability to dynamically instrument and modify Java binary files,a feature used earlier in tools such as CC4J [24] and which ourtool uses as well.Performance analysis tools offer a variety of differentanalyses. Memory analysis has been available separately inprofiling tools for some time [28,43,61]. The extensible Javaprofiler [55] also offers a programmatic interface forcontrolling profiling, but is geared more to obtaining preciseexecution time information. Jinsight provides a variety ofdifferent analyses through a visual framework, relying on tracedata collection and analysis [36-38]. J-SEAL2 usesperformance instrumentation to ensure that processes orthreads don’t overuse system resources, using byte codeinstrumentation to monitor memory and CPU utilization [7-9].The Komorium system uses instrumentation to count bytecodes executed as an alternative to time-based sampling [10]in order to provide more reproducible results from profiling.The system also is capable of dynamically tuning the samplingrate to trade-off accuracy and overhead. Our tools in part usesimilar tuning techniques to achieve a fixed overhead.Another approach is adaptive statistical sampling fromMicrosoft [13]. This approach builds on a tracinginfrastructure that instruments the code so that there is aprofiled version and an unprofiled version and the program canswitch between them on the fly [21]. Adaptive sampling tracescode at rates that are inversely proportional to their frequency.This is useful for using sampling for detecting programmingproblems where coverage is important but more detailedsampling of hot points is not. However, the approach doesyield useful information with small overhead, reportedly about5%. We use a similar approach but with very different tracingtechnology to accommodate production systems and usingadaptation to investigate different problems and to otherrelevant statistics.The effort that is closest to our work is Paradyn from U.Wisconsin and its extensions [33]. Paradyn, while specializedfor scientific applications, includes many of the features thatwe require in a performance architecture. It provides on-the-flyanalysis that can be controlled by the programmer; it providesinformation for multiple aspects of program performances,including CPU, locking, and I/O; it offers multiple interfacesincluding useful visualizations; and it allows the programmerto limit the overhead.One interesting aspect of Paradyn is that it uses an intelligentapproach to adding instrumentation, looking for routines thatuse significant CPU time and then recursively instrumentingthe routines they call. This minimizes the amount ofinstrumentation while providing accurate results [6,11].Crosswalk extends this approach to work being done in thekernel [34]. These ideas have been integrated into varioustools. STAT analyzes stack traces from large numbers ofprocesses to build a statistical model of what the processes aredoing and then cluster these according to their behavior,thereby reducing the problem space for performancedebugging [3]. Paradyn uses the callgraph-based search todetect CPU-based bottlenecks with independent bottlenecksearch agents that are part of the monitor [47]. These agentscan make use of historical performance data from previousruns [23]The approach we are taking, while similar in many respects tothat of Paradyn, differs in that we have a broader target domainof applications, that we are attempting to make it easier to addnew proflets to handle different types of performanceincluding being able to do application-specific performanceanalysis and analysis of transient problems, and in ourapproach to controlling the overhead. Paradyn doesn’t vary thesampling rate and maintains an ordered queue ofinstrumentation tasks and just ignores tasks that would exceedthe overhead limit, eventually getting to them if other tasksfind no problems and are thus eliminated [22]. A laterextension uses the same approach locally, but incorporates amore sophisticated scheduler to resolve global and localconflicts in distributed performance analysis [46]. Ourapproach lets agents set relative priorities and then computes aschedule for instrumentation based on those priorities and theoverhead. It does not discard or ignore requests, but insteadeither delays them or uses their priority to delay other requests.3. DYPER ARCHITECTUREOur goal is to create a flexible performance analysisenvironment that provides a variety of types of informationwithin a fixed overhead. To achieve this we use adaptivetechniques and dynamic control of that adaptation.The basic idea behind the architecture is that we want to usesampling techniques to get a coarse view of performance, andthen to use dynamic instrumentation to get finer levels ofdetail. In order to guarantee a fixed overhead, we vary the timebetween samples and do detailed instrumentation only forrelatively short periods of time. For example, if we want toestimate the number times a routine is called over the run, wewould create a patched version of the class containing theroutine that counted entries, swap this instrumented version infor ten seconds, and then project the counts we obtained to theoverall run. By changing the sampling interval and thefrequency and duration of the instrumentation appropriately,we can provide guaranteed limits on the overhead whileoffering statistically significant performance information.The framework we use consists of four separate componentsconnected using a messaging framework (MSG) based on thatof FIELD [41]. The framework allows arbitrary performancespecific agents we call proflets to be attached to the
HeapJVMTIDYPATCHUser’s Java ProgramDYPERMSGCPU HeapProflet ProfletDYMONUser InterfaceCPU HeapProflet ProfletFigure 1. The DYPER Architecture.components. This is illustrated in Figure 1 for the case wherethere are only two proflets.The main control is handled by the monitoring componentDYMON. Its jobs is to control the instrumentation, tocoordinate performance monitoring proflets, and tocommunicate with the user interface as necessary. DYMON isin charge of coordinating proflets and the user interface and ofmanaging the various timings involved in limiting theoverhead.The DYPATCH component handles byte code instrumentation,providing a facility that makes it easy for proflets to specifywhat to patch and how.The DYPER component consists of a Java Management profletthat is dynamically attached to the user process. Thiscomponent handles communication with DYMON and sets upa monitoring thread inside the process. At whatever intervalsDYMON determines, this component gets a snapshot of thestacks of all active threads and passes this to each of theproflets to do appropriate processing. When requested, itcreates a report containing sampling information as well asdata from each of the proflets. It also provides the facilitiesused by DYMON and DYPATCH to insert and removedynamic instrumentation.The system supports multiple performance analysis proflets.Each proflet consists of a class inside DYMON that is incharge of processing and analyzing the appropriate data.Proflets can also include an object that is dynamically loadedinto the user process and attached to DYPER. This ob
The tool must offer a guarantee on overhead. The tool should let the programmer decide what the allowable overhead for performance monitoring should be, be it 10%, 1%, or even 0.1%, and the tool should ensure that it works within the given bound. The