Transcription
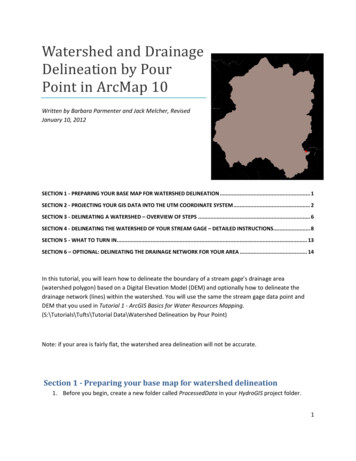
Watershed and DrainageDelineation by PourPoint in ArcMap 10Written by Barbara Parmenter and Jack Melcher, RevisedJanuary 10, 2012SECTION 1 - PREPARING YOUR BASE MAP FOR WATERSHED DELINEATION . 1SECTION 2 - PROJECTING YOUR GIS DATA INTO THE UTM COORDINATE SYSTEM . 2SECTION 3 - DELINEATING A WATERSHED – OVERVIEW OF STEPS . 6SECTION 4 - DELINEATING THE WATERSHED OF YOUR STREAM GAGE – DETAILED INSTRUCTIONS. 8SECTION 5 - WHAT TO TURN IN. 13SECTION 6 – OPTIONAL: DELINEATING THE DRAINAGE NETWORK FOR YOUR AREA . 14In this tutorial, you will learn how to delineate the boundary of a stream gage’s drainage area(watershed polygon) based on a Digital Elevation Model (DEM) and optionally how to delineate thedrainage network (lines) within the watershed. You will use the same the stream gage data point andDEM that you used in Tutorial 1 - ArcGIS Basics for Water Resources Mapping.(S:\Tutorials\Tufts\Tutorial Data\Watershed Delineation by Pour Point)Note: if your area is fairly flat, the watershed area delineation will not be accurate.Section 1 - Preparing your base map for watershed delineation1. Before you begin, create a new folder called ProcessedData in your HydroGIS project folder.1
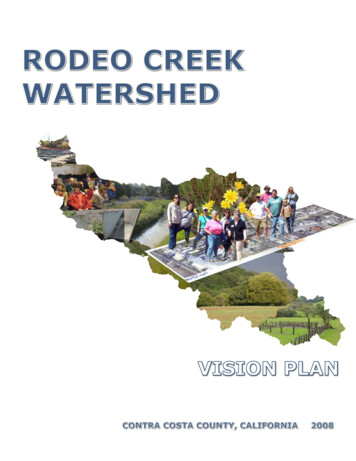
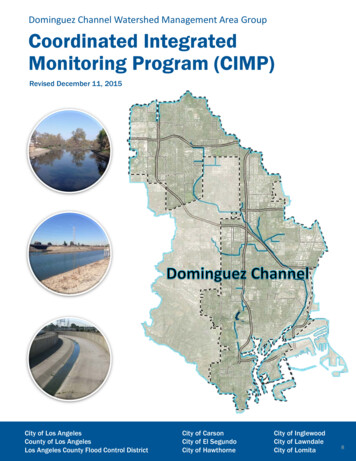
2. Start ArcMap with a new map.3. Start a new ArcMap session with the following layers:a. The flowlines upstream from your gaging station (HCDN tributaries.shp from Tutorial 1)b. Your stream gage point (Station xxxx.shp from Tutorial 1) – this will be your referencefor your pour pointc. NED xxxx (your DEM) for your subbasin (from Tutorial 1)4. It is also useful for context to add the Shaded Relief from ArcGIS Online (to do this, click on File –Add Data – Add Basemap – Terrain and then display the Shaded Relief layer).5. Save your map file (File-Save) to your project folder – call it Watershed Delineation BaseMap.mxdSection 2 - Projecting your GIS data into the UTM Coordinate SystemBefore proceeding with watershed delineation or any other kind of hydrological analysis, your datasets need to be in a projected coordinate system in which the horizontal units of the xy coordinatesare the same as the vertical elevation units of your DEM. Your DEM elevation values are in meters.But the horizontal units of your DEM are in spherical degrees, and the DEM data set is NOTprojected – it is still in spherical coordinates. So we need to project our DEM into a coordinatesystem in which the horizontal units of the xy coordinates are in meters, not degrees. Onecoordinate system that fits our needs is called UTM NAD 83 (for Universal Transverse Mercator,based on the North American Datum of 1983). The UTM system divides the world up into 60 zones,and you need to know which zone your stream gage is in. There are several ways to find this out –use ONE of the following: Look at the map of UTM Zones for the United States at the end of this tutorial. Use Google Earth2
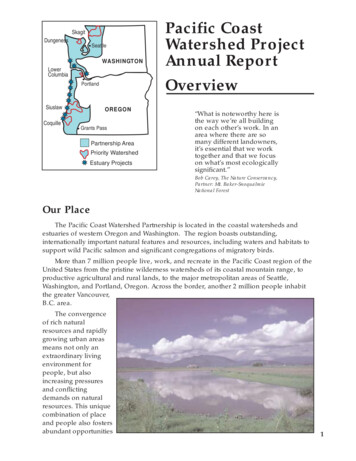
a. In Google Earth, Under Tools-Options go to the 3D View tab and set Show Lat/Longto Universal Transverse Mercator:b. In the Google Earth “Fly To” search box, enter the lat/long coordinates of yourstream gage (or just zoom into the area if you know where it is). At the bottom ofthe view you will see coordinate information – the first number (19 below) is theUTM Zone number: If you are in the Tufts GIS Lab, you can add the UTM Grid.lyr from theM:\World\ESRIDataMaps93\Vector\ folder. When the UTM Grid appears, you should seethe Zone Number labeled somewhere in the center of your map If you are working at a different Tufts computer lab, click on the Connect to Folder icon, andenter \\rstore2\gis \datasets. This will connect you with the M drive in the GIS lab. Add theUTM Grid.lyr as described above.3
6. Now that you know the UTM Zone number for your stream gage area, you are going to changethe coordinate system of your current map (called your Data Frame) to this UTM zone number –this DOES NOT change the coordinate systems of the individual data sets – just the DATA FRAMEcontaining those data sets:a. Click on View – Data Frame Propertiesb. Go to the Coordinate System Tab and under Select a Coordinate System, choosePredefined- Projected Coordinate Systems – UTM – NAD 1983 and from there click onyour stream gage’s UTM zone (e.g., 19N) and click OK (note that all UTM Zones NORTHof the equator are labeled N!):c. Click YES to proceed when warned about the coordinate system being different fromsome of your data layers – we’re going to fix that now!d. If you previously added UTM Grid layer, remove it now.e. Save your map file (File-Save)4
7. In order to reduce computing times and file sizes we are only going to project the portion of theDEM that we will be performing the watershed delineation on. Zoom to your HCDN tributarieslayer and then zoom out slightly so that you know you will be displaying the entire tributarywatershed in your view window.8. Right-click on the DEM data layer and choose Data – Export Data. Carefully follow the screenshot below for guidance. You want to export just the extent of the DEM that fills your DataFrame, and you want the spatial reference (coordinate system) to be the same as the DataFrame (UTM NAD83). The 1-arc second DEM you are using has square cells equal to 30 metersto a side. Use the folder icon () to set the save location to your project folder(ProcessedData), but don’t try to name the file through the Select Workspace dialog. Instead,use the Name field and name exported file DemClip. Finally, change the raster format to GRID –again, see the example below:9. Click Save10. Add the exported data file to the map when prompted5
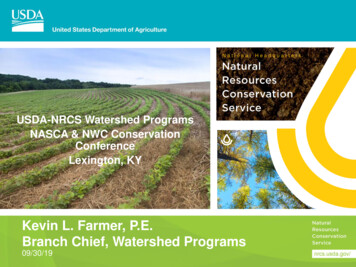
11. Save your mapfile (File-Save)Section 3 - Delineating a Watershed – Overview of StepsArcGIS can delineate the total area flowing into a given outlet, also called a pour point, based on adigital elevation model. In this analysis, the pour point will be your stream gage, and you will delineatethe watershed upstream of your stream gage. Recall that a digital elevation model is an array of evenlyspaced grid cells, and that the value of each cell is the estimated elevation of that cell. ArcGIS cancompute from the DEM the direction of flow down a slope and how many cells “flow into” each cell(called flow accumulation). Here is a quick overview of the steps for delineating a watershed in ArcGIS –we have detailed directions later. Note that you should carefully review the ArcGIS Help for this topic –you can find it in the software under Help – ArcGIS Desktop Help – Extensions – Spatial Analyst – AnalysisConcepts – Hydrologic Analysis, or online starting here (in both cases, each step has its own detailedsection): index.html#//009z0000005m000000.htmThe USGS Hydrosheds Project (http://hydrosheds.cr.usgs.gov/) is another good source for understandingthis process, and discusses more complex technical issues than we cover here.Conceptual overview of watershed delineation:1. Flow Direction: Based on your clipped DEM (DemClip) – this will compute for every cell thedirection that water would flow through it. The value of the cell is a number representing acardinal direction as shown here:The output data set is FlowDirxx2. Sink: This step uses your Flow Direction grid to identify sinks in your DEM. These are areassurrounded by higher areas, so that there is no external drainage. Sometimes sinks are real, butoften DEMs have erroneous sinks. Regardless of whether they are real or not, for the watershed6
delineation process to work, we need a “depressionless DEM,” i.e., a DEM with no sinks. TheOutput data set is Sink FlowDirxx.3. Fill: This step will fill the sinks of your DEM (DemClip). Note that doing this correctly requirescare and an iterative process which we don’t detail in this tutorial. Instead, we will do a basic Fillcommand. The result of this step will be a depressionless DEM (Fill Demxx) which will in turn bethe basis of the rest of the process4. A new Flow Direction based on the Filled (depressionless) DEM. The result will be FlowDir Fillxx5. Flow Accumulation based on your new corrected (filled) Flow Direction grid: This step calculatesfor each cell in your filled DEM array, the number of cells flowing into it). Areas of higher valuesare where water collects and drains. Areas of very high values are likely perennial streams orrivers, areas with lower values may be intermittent streams. The Flow Accumulation grid willallow the software to determine the area draining to any specified point on the DEM (i.e., yourstream gage). The output grid is FlowAccxx6. Snap Pour Point: Your stream gage point may not fall directly over the correct raster cell (all GISdata have inherent positional error). Since a stream gage is by definition next to a stream, weknow that the Pour Point representing the gage should be coincident with the stream. The SnapPour Point command snaps your stream gage point to the nearest area of high flowaccumulation within a distance you specify. Your output grid will be SnapPour7. Watershed: This command performs the watershed delineation based on your snapped streamgage pour point (SnapPour).7
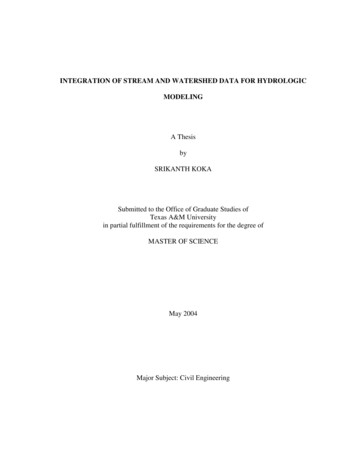
Section 4 - Delineating the Watershed of your Stream Gage – DetailedInstructionsFollow the process steps using tools in ArcToolbox – Spatial Analyst Tools – Hydrology DEMCLIP is yourinitial base:1. Initialize the Spatial Analyst Extension (Tools – Extensions – checkmark Spatial Analyst)2. Open ArcToolbox () to the Spatial Analyst Tools – Hydrology section3. You will go through the tools in turna. Flow Direction – for this initial process, set the Input Surface Raster to DemClip. ForOutput flow direction raster, navigate to your ProcessedData folder, and call the newraster FlowDir DemC1, then press OK, as show below:8
b. Sink – The flow direction grid is the input:Examine the Sinks raster you have created. In a more detailed analysis, you wouldconstrain the depth to which sinks are filled to eliminate small sinks due to errors in theDEM, but not actual basins. This process is iterative and very time consuming, and sowill not be covered in this tutorial, but you can read about it on the ESRI online help orthe USGS Hydrosheds Project (http://hydrosheds.cr.usgs.gov/).c. Filld. Flow Direction based on the filled DEM -9
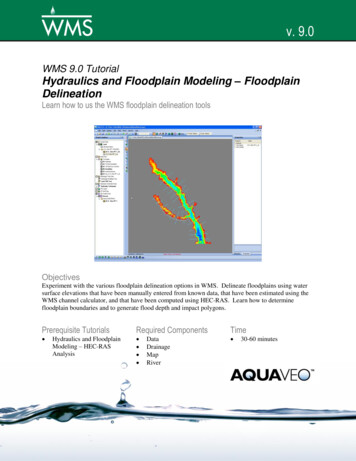
e. Flow Accumulation (may take a long time) -f.Snap Pour PointBefore proceeding, you need to measure how far your stream gage is from an area ofhigh accumulation on your Flow Accumulation grid. It is likely that your stream gage ison top of or near an area shaded white, indicating high flow accumulation.i. Zoom into your stream gage on ArcMap and click on the Measure Tool:ii. Measure the distance between your stream gage point and the center point ofthe nearest high value flow accumulation cell. In the example below, thedistance is about 40 meters to each of the nearest cells – round this up a bit tomake sure the Snap will work:iii. Activate the Snap Pour Point tool in ArcToolbox with specifications similar towhat you see below, using the distance you measured plus a little extra as yourSnap Distance. Make sure to call the output raster, SnapPour:10
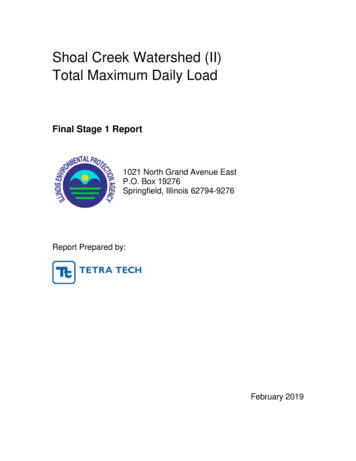
iv. Make sure the result is a single cell directly on top of a high accumulation area(colored white) and near your stream gage, as you see here:g. Watershed:11
Your results should look something like this:If you think your result is correct, you can convert this raster data set to a GIS vector polygon (shapefile)so that you can have it permanently for mapping. To do this:1. in ArcToolbox choose Conversion Tools – From Raster – Raster to Polygon2. Fill in the dialog box similar to what you see below (use your Watersh Flow data set):12
3. For mapping purposes, you may make the new polygon hollow (no fill) with a thicker outlineusing the Symbology propertiesDidn’t work properly?If your watershed delineation did not work properly (e.g., it did not cover the entire area of yourtributary streams), you may have re-do the Snap Pour Point command. If it still doesn’t work,examine your flow accumulation network to see where you think the most logical place is forsnapping your stream gage is, then place a graphic point at that location using the DrawToolbar:Then still with the Draw Toolbar, choose Drawing – Convert Graphics to Feature. This will createa new GIS data set (shape file) of this point. Use the Data Frame’s coordinate system and call theoutput shape file Adjusted Stream Gage. Then start at step F above, using this adjusted gagepoint as the input data set.How does the boundary of your delineated boundary compare with the upstream NHD flownetwork?This delineation process is not foolproof! Some watersheds have flat areas that are ambiguousto the flow direction calculator. In most cases you can assume that the NHD flow network hasbeen checked and is correct. Be sure to note on your submittal if this has occurred.Section 5 - What to turn inCreate a well-designed map in ArcMap showing the watershed area of your stream gage point withappropriate context information (towns, roads, water bodies).13
Section 6 – Optional: Delineating the drainage network for your areaThe following section is optional. You have been using the NHD flow lines for your stream network. TheNHD flow lines are based on 1:24,000 USGS maps. But sometimes it is useful to generate a moredetailed drainage network or you may be working in an area of the world for which there are not digitalstream GIS data files. In this section of the tutorial you will learn how to delineate a drainage networkfrom a DEM. Note that if your area is fairly flat, the drainage network delineation will not be accurate.Look at ArcGIS 10 Help - Spatial Analyst – Analysis Concepts – Hydrologic Analysis Identifying StreamNetworks - index.html#//009z0000005v000000.htmThis process requires your Flow Accumulation raster from Section 4. The basic conceptual process is toreclassify all cells that meet a certain accumulated flow threshhold to be 1, and all other cells to be nodata. To do this you can apply a conditional statement to your Flow Accumulation raster in which allcells with a value greater than a threshold number (e.g., 100) are reclassified to be 1, and all other cellsreceive a “no data” value.1. Go to Spatial Analyst Tools – Map Algebra – Raster Calculator.2. Use the Raster Calculator to create a conditional statementCon("FlowAcc Flow1" 100, 1)- Name the new data set that will be produced streamnet. Note: Pay attention to spaces whenwriting your expression.3. Zoom into it to see what it looks like – it is a detailed drainage network for the area covered byyour Flow Accumulation grid.Note that you can use a different threshold value. The value we used, 100, is arbitrary. MichaelWieczorek’s Flow-Based Method for Stream Generation in a .html) offers a more sound approach for specifying athreshold value using historical runoff data.If you re-do this step with a different threshold value, you must change the output raster name – e.g.,streamnet2, streamnet3, etc.To create a vector drainage line data set from this raster file, you can use the Stream to Feature toolunder ArcToolbox – Spatial Analyst – Hydrology Tools. Fill in the dialog box similar to what you see14
below (note we specified 100 in our data name to remind ourselves we used 100 as the accumulationthreshold):Online Resources:For an online USGS application to create watersheds for selected states and download them asshapefiles, try StreamStats http://streamstats.usgs.gov/ssonline.html15
Appendix - UTM Zone Map16
(called flow accumulation). Here is a quick overview of the steps for delineating a watershed in ArcGIS - we have detailed directions later. Note that you should carefully review the ArcGIS Help for this topic - you can find it in the software under Help - ArcGIS Desktop Help - Extensions - Spatial Analyst - Analysis