Transcription
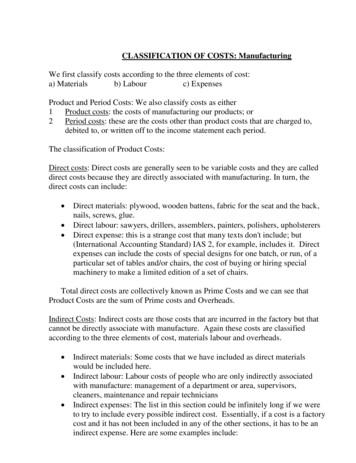
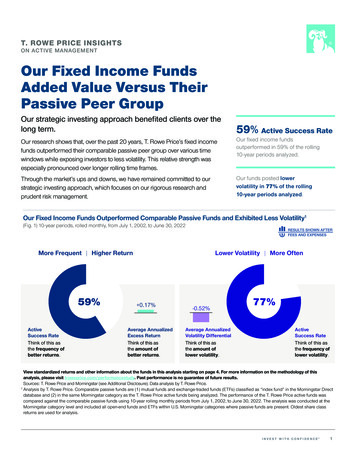
T. ROWE PRICE INSIGHTSON ACTIVE MANAGEMENTOur Fixed Income FundsAdded Value Versus TheirPassive Peer GroupOur strategic investing approach benefited clients over thelong term.59% Active Success RateOur research shows that, over the past 20 years, T. Rowe Price’s fixed incomefunds outperformed their comparable passive peer group over various timewindows while exposing investors to less volatility. This relative strength wasespecially pronounced over longer rolling time frames.Our fixed income fundsoutperformed in 59% of the rolling10-year periods analyzed.Through the market’s ups and downs, we have remained committed to ourstrategic investing approach, which focuses on our rigorous research andprudent risk management.Our funds posted lowervolatility in 77% of the rolling10-year periods analyzed.Our Fixed Income Funds Outperformed Comparable Passive Funds and Exhibited Less Volatility1(Fig. 1) 10-year periods, rolled monthly, from July 1, 2002, to June 30, 2022More Frequent Higher Return59%ActiveSuccess RateThink of this asthe frequency ofbetter returns.Lower Volatility More Often 0.17%Average AnnualizedExcess ReturnThink of this asthe amount ofbetter returns.-0.52%Average AnnualizedVolatility DifferentialThink of this asthe amount oflower volatility.77%ActiveSuccess RateThink of this asthe frequency oflower volatility.View standardized returns and other information about the funds in this analysis starting on page 4. For more information on the methodology of thisanalysis, please visit troweprice.com/performancestudy. Past performance is no guarantee of future results.Sources: T. Rowe Price and Morningstar (see Additional Disclosure). Data analysis by T. Rowe Price.1Analysis by T. Rowe Price. Comparable passive funds are (1) mutual funds and exchange-traded funds (ETFs) classified as “index fund” in the Morningstar Directdatabase and (2) in the same Morningstar category as the T. Rowe Price active funds being analyzed. The performance of the T. Rowe Price active funds wascompared against the comparable passive funds using 10-year rolling monthly periods from July 1, 2002, to June 30, 2022. The analysis was conducted at theMorningstar category level and included all open-end funds and ETFs within U.S. Morningstar categories where passive funds are present. Oldest share classreturns are used for analysis.1
Stronger Historical Returns With Less VolatilityTo provide a clear picture of our performance,we take fund fees and expenses into accountwhen we report returns and volatility.Active Success RatesThe active success rate records thepercentage of times an actively managedT. Rowe Price fund’s returns beat or exhibitedless volatility than its passive peer group, 1 netof fees and expenses, over a specified period.Fixed income funds play several important roles in client portfolios, includingdiversification from equities and income generation. Accordingly, the opportunityfor active managers to add relative value often hinges on their success in mitigatingthe risk of downside volatility. Figure 1 shows that, compared with their comparablepassive peer group, the T. Rowe Price fixed income funds in our study 1 deliveredstronger average returns and less volatility (see Historical Volatility sidebar) over rolling10-year periods. A lack of sufficient performance history for passive funds in someMorningstar categories meant that fewer T. Rowe Price funds could be evaluatedover the 10-year rolling time window as compared with the shorter time frames in ouranalysis. However, our fixed income funds’ relative strength and less volatile returnstream also extended to the rolling one-, three-, and five-year windows. 1Over 10-year rolling periods, the frequency with which our fixed income fundsoutperformed or exhibited less volatility than their passive peers stood out.(See Figure 1 and Active Success Rates sidebar.) T. Rowe Price’s fixed incomefunds also posted better average annualized returns or average historical volatilitythan their comparable passive peergroup in a majority of one-, three-, andfive-year time windows.0.17%Excess ReturnsFor each rolling period, the passive returnsaverage was subtracted from each T. Rowe Pricefund’s return, yielding an excess return.Historical VolatilityHistorical volatility (based on standard deviation)measures the dispersion of a fund’s returns.Funds that exhibited lower volatility experiencedless fluctuation in their returns.1The study spanned the 20 years up to the endof June 2022 for older funds, or since inceptionfor newer ones, and measured performanceand historical volatility net of fees and expenses.We used the oldest share class for each fund.Each T. Rowe Price fund’s performance wasmeasured against the equally weighted averageof the returns (passive returns average) andhistorical volatility (passive volatility average)posted by the oldest share class of the indexfunds in its Morningstar category. Thesecomparisons were made over 1-, 3-, 5-, and10-year horizons, rolled monthly.2As of June 30, 2022.3As of December 31, 2021. Investment staffincludes 137 portfolio managers, 24 associateportfolio managers, 204 investment analysts,71 associate analysts, 29 specialtyanalysts, 34 traders, 12 strategists, and22 senior managers.is the average annualized excess return(net of fees and expenses) posted byour fixed income funds across rolling10-year periods.Our Strategic Investing ApproachWe attribute this success to ourstrategic investing approach, whichinvolves careful security selection andrigorous credit research conducted byour long‑tenured investment team.Across asset classes, our skilled portfoliomanagers have deep experience—anaverage of 22 years in the industry and16 years with T. Rowe Price. 2 Thisdepth and breadth of expertise helpsus know what questions to ask and where to find the answers we need. More than525 of our professionals 3 meet regularly with management teams, issuers, experts,and policymakers to conduct due diligence on existing holdings and potentialinvestments. Their unique insights are shared and debated across our extensiveglobal team of investment professionals. We believe that this culture of collaborationacross regions and asset classes—coupled with our expanded macroeconomic andquantitative capabilities—gives our investors a multifaceted view of potential risksand opportunities.Our funds averaged 0.52%less volatility, annualized, thancomparable passive peers.Our extensive study outlines how our strategic investing approach has added valuefor investors when compared with our passive peer group, especially over longertime horizons.Call 1‑800‑225‑5132 to request a prospectus or summary prospectus; eachincludes investment objectives, risks, fees, expenses, and other informationthat you should read and consider carefully before investing.Past performance is no guarantee of future results. All investments are subject torisk, including the possible loss of principal. Results from other time periods may differ.Active investing may have higher costs than passive investing and may underperformthe broad market or passive peers with similar objectives. Passive investing may lagthe performance of actively managed peers as holdings are not reallocated based onchanges in market conditions or outlooks on specific securities.2
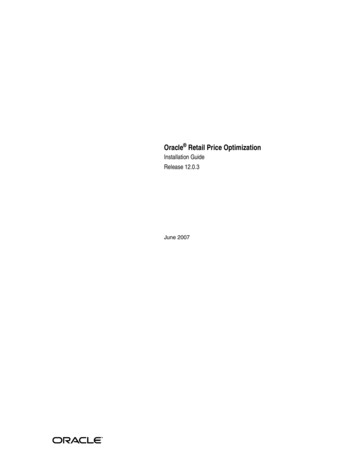
The Potential for Active Risk in Passive Fixed Income FundsTracking ErrorIn simple terms, tracking error refers to thedifference in a fund’s performance relative tothe returns posted by its benchmark.Actively managed funds deliberately seek apositive tracking error in an effort to generatereturns in excess of the benchmark.Passive mutual funds are designed to track theperformance of a benchmark, but for a varietyof reasons, there can be discrepancies.Passive funds have become increasingly popular over the past two decades. A bigpart of their appeal typically lies in the prospect of generating a market-like return, oftenat a lower cost than actively managed strategies. Given the liquidity in the equity market,passive funds in this asset class usually exhibit little tracking error (volatility in a fund’sreturns relative to those generated by its benchmark).However, compared with passive equity funds, tracking error can be more pronouncedfor passive fixed income funds. (See Figure 2.) What is the source of this tracking error?The nuances of the bond and credit markets can mean that passive fixed income fundsmay struggle to mirror the composition of the conventional bond index they track. Thesedifferences can lead to variations in performance, possibly contributing to a passivefixed income fund’s overall volatility.Passive Fixed Income Funds Exhibited Higher Tracking Error ThanEquity Peers1(Fig. 2) Average annualized tracking error for five largest passive funds in fixedincome and equity categories with the most passive assets2Fixed Income0.30%Average AnnualizedTracking Error.compared withpassive equityfunds, trackingerror can be morepronounced forpassive fixedincome 2%Trailing 1 Year0.03%Trailing 3 Years0.02%Trailing 5 YearsAs of June 30, 2022.We define a passive fund as one identified as an “index fund” in the Morningstar Direct database.Sources: T. Rowe Price and Morningstar. All data analysis by T. Rowe Price.1Tracking error calculations are relative to the prospectus benchmark for each passive fund.2As of June 30, 2022, Morningstar’s large blend category had the highest level of passive assets, amountingto about 48% of all passive equity assets. The 5 biggest large blend index funds by market capitalizationmade up 70% of passive assets in the category. Morningstar’s intermediate core bond category had thehighest level of passive assets, amounting to about 39% of all passive fixed income assets. The 5 largestintermediate core bond index funds made up 90% of passive assets in the category. 2022 Morningstar, Inc. All rights reserved. The information contained herein: (1) is proprietary toMorningstar and/or its content providers; (2) may not be copied or distributed; and (3) is not warranted to beaccurate, complete, or timely. Neither Morningstar nor its content providers are responsible for any damagesor losses arising from any use of this information. Past performance is no guarantee of future results.Specific bond issues may be unavailable in the desired size, and each substitution involvessome difference in quality, duration, 4 and other risk factors. Conventional bond benchmarksalso tend to experience significantly higher turnover than equity indexes, driven by issuancelevels, maturities, early redemptions, credit rating changes, and other factors.The potential differences in composition between a passive fixed income fund and itstarget index, along with transaction costs and cash flow disparities, might lead to volatilityin the fund’s returns relative to those generated by its benchmark.We believe that potential tracking error is an important factor for investors considering apassive fixed income fund, especially investors expecting a market-like return.4Duration measures a bond’s sensitivity tochanges in interest rates.3
Standardized Performance: T. Rowe Price Fixed Income FundsAnnualized total returns for periods ended June 30, 2022FundInception DateGrossExpenseRatio120 Yearsor Since10 Years Inception1 Year3 Years5 Years-9.46%-0.44%1.23%2.57%3.75%California Tax-Free Bond Fund(09/15/1986)0.53%Corporate Income Fund(10/31/1995)0.51-15.56-1.620.602.354.50Credit Opportunities Fund(04/29/2014)1.14-10.380.712.42—2.20Dynamic Credit Fund(01/10/2019)1.25-4.862.57——3.29Dynamic Global Bond Fund(01/22/2015)0.703.914.743.05—2.96Emerging Markets Bond ng Markets Corporate Bond g Markets Local Currency Bond ting Rate Fund(07/29/2011)0.76-3.191.332.253.103.10Global High Income Bond Fund(01/22/2015)0.87-15.17-1.011.50—3.55Global Multi-Sector Bond Fund(12/15/2008)0.64-10.640.091.943.085.17GNMA Fund(11/26/1985)0.50-8.97-1.65-0.100.662.83High Yield on Protected Bond onal Emerging Markets Bond utional Floating Rate onal High Yield tional Long Duration Credit iate Tax-Free High Yield nal Bond national Bond Fund (USD Hedged)(09/12/2017)0.61-8.91-1.07——1.27Limited Duration Inflation Focused Bond Fund(09/29/2006)0.48-0.073.412.971.492.27New Income Fund(08/31/1973)0.41-10.91-1.390.561.453.60New York Tax-Free Bond Fund(08/28/1986)0.53-9.75-0.590.982.183.50QM U.S. Bond Index Fund(11/30/2000)0.23-10.44-0.780.951.603.54Short Duration Income Fund(12/08/2020)1.32-5.10———-2.47Short-Term Bond ce data quoted represent past performance and do not guarantee future results. Investment return andprincipal value will fluctuate so that an investor’s shares, when redeemed, may be worth more or less than their originalcost. Current performance may be lower or higher than the performance data quoted. To obtain the most recentmonth-end performance, visit troweprice.com.4
Standardized Performance: T. Rowe Price Fixed Income Funds (Cont.)Annualized total returns for periods ended June 30, 2022FundInception DateGrossExpenseRatio1Spectrum Income Fund(06/29/1990)0.62%Summit Municipal Income Fund(10/29/1993)0.5220 Yearsor Since10 Years Inception1 Year3 Years5 9.82Summit Municipal Intermediate Fund(10/29/1993)0.50-7.78-0.281.141.963.29Tax-Free High Yield e Income Fund(10/26/1976)0.53-9.35-0.271.342.353.72Tax-Free Short-Intermediate Fund(12/23/1983)0.47-4.080.120.770.972.17Total Return Fund(11/15/2016)0.60-12.15-0.591.35—1.68U.S. High Yield Fund–I Class(04/30/2013)*0.65-15.75-0.391.63—4.05*Ultra Short-Term Bond e data quoted represent past performance and do not guarantee future results. Investment return andprincipal value will fluctuate so that an investor’s shares, when redeemed, may be worth more or less than their originalcost. Current performance may be lower or higher than the performance data quoted. To obtain the most recentmonth-end performance, visit troweprice.com.As of the most recent prospectus.*The fund commenced operations on May 19, 2017. Performance prior to that date reflects the performance of the Class A of the predecessor fund. Predecessorfund performance reflects its actual operating expense at the time and was not adjusted to reflect the impact of the fund’s current fees. Since-inception returnsare shown from the inception date of the predecessor fund, April 30, 2013.The standardized performance table omits the Institutional Credit Opportunities Fund, the Institutional Global Multi-Sector Bond Fund, the Institutional International BondFund, the Summit GNMA Fund, and the Tax‑Free Intermediate Bond Fund, each of which either liquidated or merged into another fund prior to June 30, 2022.15
T. Rowe Price focuses on delivering investment managementexcellence that investors can rely on—now and over the long term.Additional Disclosure 2022 Morningstar, Inc. All rights reserved. The information contained herein: (1) is proprietary to Morningstar and/or its content providers; (2) may notbe copied or distributed; and (3) is not warranted to be accurate, complete, or timely. Neither Morningstar nor its content providers are responsible for anydamages or losses arising from any use of this information. Past performance is no guarantee of future results.Important InformationCall 1‑800‑225‑5132 to request a prospectus or summary prospectus; each includes investment objectives, risks, fees, expenses,and other information you should read and consider carefully before investing.This material is provided for informational purposes only and is not intended to be investment advice or a recommendation to take any particular investment action.The views contained herein are those of the authors as of June 2022 and are subject to change without notice; these views may differ from those of otherT. Rowe Price associates.Risks: Active investing may have higher costs than passive investing and may underperform the broad market or passive peers with similar objectives. Passiveinvesting may lag the performance of actively managed peers as holdings are not reallocated based on changes in market conditions or outlooks on specificsecurities. All investments are subject to risk, including the possible loss of principal. Bond yield and share price will vary with interest rate changes. If interestrates rise significantly from current levels, bond fund total returns will decline and may even turn negative in the short term. International investments can be riskierthan U.S. investments due to the adverse effects of currency exchange rates, differences in market structure and liquidity, as well as specific country, regional, andeconomic developments. These risks are generally greater for investments in emerging markets.This information is not intended to reflect a current or past recommendation concerning investments, investment strategies, or account types; advice of any kind;or a solicitation of an offer to buy or sell any securities or investment services. The opinions and commentary provided do not take into account the investmentobjectives or financial situation of any particular investor or class of investor. Please consider your own circumstances before making an investment decision.Information contained herein is based upon sources we consider to be reliable; we do not, however, guarantee its accuracy.Past performance is not a reliable indicator of future performance. All investments are subject to market risk, including the possible loss of principal. All chartsand tables are shown for illustrative purposes only.T. Rowe Price Investment Services, Inc. 2022 T. Rowe Price. All Rights Reserved. T. Rowe Price, INVEST WITH CONFIDENCE, and the Bighorn Sheep design are, collectively and/or apart, trademarksor registered trademarks of T. Rowe Price Group, Inc.ID0005307 (08/2022)202206‑22562376
The Potential for Active Risk in Passive Fixed Income Funds Passive funds have become increasingly popular over the past two decades. A big part of their appeal typically lies in the prospect of generating a market-like return, often at a lower cost than actively managed strategies. Given the liquidity in the equity market,