Transcription
RURAL COMMODITIES WRAPSEPTEMBER 2017Author Phin Ziebell, Agribusiness Economist@PhinZiebellCover photo Sunrise in the Barossa, August 2017
Photo Mai ThaiKEY POINTSThis month, the NAB Rural Commodities Index fell to a 15 month low, slipping 7.6% (the biggestmonthly fall since the expanded index began in 2010) amid a stubbornly high Australian dollar,retreating grain prices and weakness in cattle. Only four of the 28 commodities that make up theindex rose in the month. Seasonal conditions are mixed to poor. While most of southernAustralia (below a line stretching roughly from Western Australia’s Shark Bay to Canberra) sawabove average rainfall last month, north of the line it remains very dry indeed. Frosts in NewSouth Wales and Queensland have caused potentially considerable damage to winter crops.Over the coming months, we will be closely watching two areas, the performance of which willbe key for the agricultural sector: Seasonal conditions remain a major consideration. While spring rain is probably too late formuch of the crop in northern New South Wales and Queensland, improved conditions couldallow some opportunities for summer crops. Likewise, better seasonal conditions would likelystem some of the recent falls in cattle prices. The Australian dollar remains in the high 70s, approaching an uncomfortable level foragriculture. In August NAB changed its forecast for the AUD from 70 cents by year end to 75cents. We will be watching for signs of strength in the USD that are necessary for adepreciation in the AUD to occur.
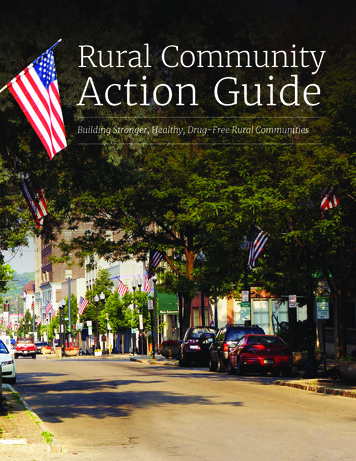
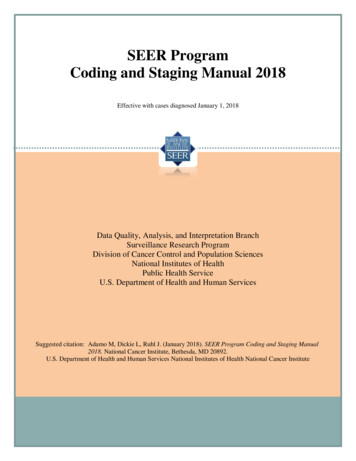
PRICE UPDATECONTENTS3 Price update4 Regional price indicators5 Seasonal conditions6 Price and production outlook7 Exchange and interest rates8 Farm input prices9 Wheat11 Other broadacre crops12 Beef13 Lamb, pork and poultry14 Dairy15 Horticulture16 FibresThe NAB Rural Commodities Index plummeted7.6% in August, the biggest monthly drop for theexpanded index (with data going back to 2010)and a 15 month low. The fall reflected thestrength of the Australian dollar combined withlower global grain and domestic cattle prices.Dairy also fell following lacklustre auctions and ahigher AUD. Meanwhile cotton and sugar werealso lower.MONTHLY AUD PRICE CHANGESOn a state basis, previous outperformerQueensland (with its large cattle industry) tookthe biggest hit to fall 8.3%, while New SouthWales was off 6.7%. Dairy heavy Victoria andTasmania fell 6.4% and 6.8% respectively, whilegrain dependent Western Australia fell 8.0%and South Australia fell 7.0%.The index tracks 28 commodities weighted bythe relative size of each commodity in theAustralian agricultural sector.NAB RURAL COMMODITIES INDEXMonthly average price changeJanuary 2010 100JuneJulyAugustWheat 8.2% 10.8% 13.0%Beef 1.1% 6.3% 7.3%Dairy 5.5% 4.2% 3.8%Lamb 2.5% 9.1% 1.6%Wool 1.5% 1.5% 2.5%Sugar 15.0% 1.1% 3.7%Cotton 5.8% 3.8% 0090201020112012201320142015Source: NAB Group Economics, ABARES, Meat and Livestock Australia, Australian Pork, Ausmarket Consultants, Australian Bureau of Statistics, Bloomberg and Profarmer.3Rural Commodities Wrap20162017
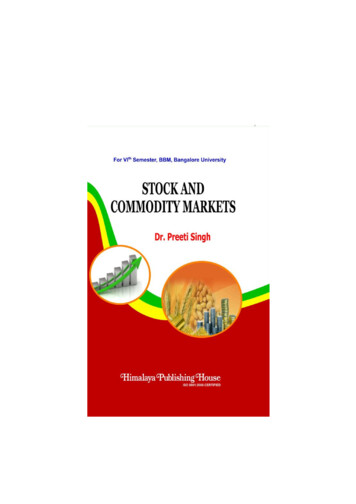
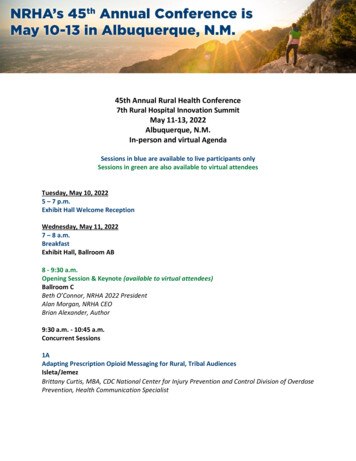
REGIONAL PRICE INDICATORSMONTH ON MONTHJuly to August 2017- more than 5%- 4-5%- 3-4%- 2-3%- 1-2%- 0-1%no data 0-1% 1-2% 2-3% 3-4% 4-5% more than 5%YEAR ON YEARAugust 2016 to August 2017- more than 20%- 15-20%- 10-15%- 5-10%- 0-5%no data 0-5% 5-10% 10-15% 15-20% more than 20%Monthly regional price indicator data shows a negative pictureacross the country for August. All regions were lower and only 10fell by less than 5%. The combination of lower cattle and grainprices was reflected in steep falls across most of the country.On a year on year basis, some regions are still ahead (mostly thosewith a broadacre cropping focus) but cattle country acrossQueensland and the Northern Territory has seen steep falls withprices well below their level at the same time in 2016.Dairy export prices fell, although this should be read with somecaution as farmgate prices have been quite steady recently.Farmgate opening prices have been released and both MurrayGoulburn and Fonerra have issued upward revisions. For moreinformation on dairy see page 13.This is the fifth month of NAB’s new regional price indicators – ineffect a separate NAB Rural Commodities Index for every region inAustralia. The data is based on state natural resource managementregions (rather than ABS SA4 regions) to match agricultural regionsas well as possible. Our maps are based on 2011 region boundaries.When the ABS releases production data based on updatedboundaries, these boundaries will change.Source: NAB Group Economics, ABARES, Meat and Livestock Australia, Australian Pork, Ausmarket Consultants, Australian Bureau of Statistics, Bloomberg and Profarmer.4Rural Commodities Wrap
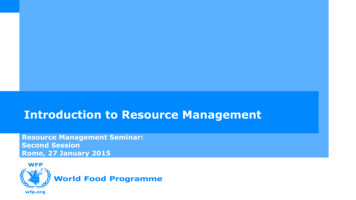
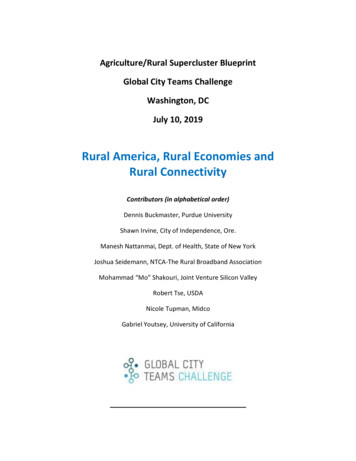
SEASONAL CONDITIONSTHREE MONTH RAINFALL OUTLOOKRAINFALL ANOMALY – AUGUSTThe Bureau of Meteorology’s latest three month climate outlook forspring points to average to above average rainfall across New SouthWales, Victoria, South Australia and Tasmania, mostly average toabove average rainfall for Queensland (although Cape York isexpected to see below average falls), while most of WesternAustralia and parts of the Northern Territory are expected to seedrier conditions.Rainfall saw a very strong north-south pattern in August, with a linefrom roughly Shark Bay to Canberra dividing generally aboveaverage rainfall to the south and average to below average rainfallto the north. Tasmania was patchy, with the south west seeing muchmore rain compared to average.September to November 2017While improved rainfall is certainly welcome in the eastern states,grain growers faced a string of late frosts and a wet finish may be ahindrance.Source: Bureau of Meteorology5Rural Commodities WrapmmWhile this rain was certainly very welcome, data for the last threemonths shows very serious deficiencies across most of Australia’sagricultural regions. The northern wheatbelt of Western Australia,the Eyre Peninsula, Gippsland and parts of New South Wales sawespecially bad conditions in early winter and we expect these areasto see among the worst yield deficiencies come harvest.
OUTLOOK FOR PRICES AND PRODUCTIONPricesProductionThe outlook for the coming year is highly dependent on the course ofthe Australian dollar which remains stubbornly in the high 70s rangehaving briefly touched above 80 US cents. We now see the AUD at 75cents at the end of 2017 and 73 cents for much of next year. This hasseen us revise down our forecasts for most agricultural commodities.Rainfall (or more accurately the distinct lack of it), is the major issuefor production this year and while August saw southern producersreceive a boost, frost activity has been above average and someparts of New South Wales and Queensland saw abnormally hotweather. Our latest estimate for national wheat production is 20.1million tonnes, although a poor finish could see production dropinto the high teens, especially given very challenging conditions inNew South Wales.Weather will continue to be a major driver of livestock prices. Drierweather has already had a major impact on cattle and sheep prices. Ifthese conditions continue we expect to see further downside forlivestock, although the Bureau of Meteorology now expects averageto wetter than average spring conditions across eastern Australia.INDEX OF PRICE FORECASTS FOR RURAL COMMODITIESAUD index value, December quarter 2016 100Conversely, dry conditions have already seen an uptick in cattleslaughter. If it remains dry, production is likely to be higher forsome months before declining again.PRODUCTION OUTLOOK (ABARES JUNE 2017 EXCEPT WHEAT)Financial year production estimates, Australia130Wheat12011010035.120.1 42.8%CanolaBeef (kt)2,0352,114 3.9%WoolDairy (milk, ML)8,9109,250 3.8%Lamb and mutton (kt)669668 0.1%Wool431442 2.6%LambSugar (kt)4,8044,821 0.4%Weighted dairyCotton (lint, kt)9601,083 12.8%Beef7060Dec-16Mar-17Jun-17Sep-17% changeWheat (million urce: NAB Group Economics, ABARES, Meat and Livestock Australia, Australian Pork, Ausmarket Consultants, Australian Bureau of Statistics, Bloomberg and Profarmer6Rural Commodities Wrap
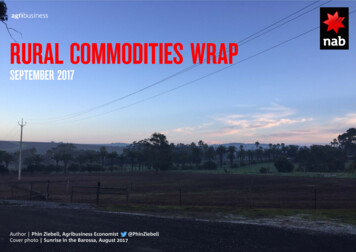
EXCHANGE RATES AND INTEREST RATESEXCHANGE AND INTEREST RATES INC. QUARTERLY FORECASTS1.20AUD/USD8RBA cash rate (RHS)71.0060.80540.6030.4020.20100.00NAB FX STRATEGY USD1.191.171.181.20USD/CNY6.656.676.646.64AUD TWI65.964.263.462.3Source: NAB7Rural Commodities WrapFor the USD an almost non-stop run of negative news has seen the bigUSD fall 8% in broad trade-weighted index terms this year. While thispartly represents a reversal of the 5% November-December 2016 risefollowing Trump’s election victory as the White House proves unableto pass any meaningful legislation, the addition of prospective policyreversals at the ECB and other developed economy central banksalongside a burgeoning Trump discount factor, now sees the USDplumbing key long-term supports.At 0.7965, the AUD/USD is little changed in the past fortnight. A moveabove 80c remains elusive, however our fair value model estimate hascontinued to edge higher. At the start of August, our model wassuggesting fair value for the AUD/USD was around 0.7710. Now fiveweeks later, fair value sits at 0.7920 and the fair value range is 0.7650- 0.8180. On this basis, today the AUD/USD can comfortably moveabove the 80c mark without necessarily being seen as overvalued.AUD/USD is likely to remain contained in a 0.78 to 0.8050 range nearterm. Short term valuation is not stretched, suggesting scope to grindhigher on ‘no news’ but AUD is still very sensitive to bad news (eitherdomestic data or global risk sentiment). Ultimately we forecast theAUD to fall to 0.75 by the end of 2017 and spend most of 2018 aroundthe 0.73 mark.We do not envisage any cash rate hikes until 2019, although there issome risk of an earlier hike if current strength in the labour market issustained beyond 2017. That said, there is now little possibility of acut, despite the higher AUD complicating the outlook. Somereacceleration of detached house prices, despite measures to coolinvestor and foreign demand, will not sit comfortably at the RBA.
FARM INPUT PRICESNAB FERTILISER INDEXNATIONAL AVERAGE FUEL PRICESAUD ol1002010 2011 2012 2013 2014 2015 2016 2017Diesel02010 2011 2012 2013 2014 2015 2016 2017NAB WEIGHTED FEED GRAIN PRICE INDEXAUD/tonne300While we expect little upturn in global pricesover the coming months the combination of i)the risk of below average grain yields thisseason and ii) a possible shortage of oldseason crop remaining on farm, could seedomestic feed prices continuing to attract apremium.Fertiliser prices were up in August, reflectinghigher DAP and urea prices, although theelevated AUD lessened this impact somewhat.Overall, the index was up 3.8% for the month.20010002010201120122013Source: Bloomberg, Profarmer and NAB Group Economics8Feed prices fell 9.8% to 212/tonne in August,as the sharp global grains rally of June-July fellaway. Nonetheless, prices remained somewhathigher than global benchmarks on account ofdry seasonal conditions in New South Walesand Queensland. There have been numerousreports of livestock producers scrambling tosecure old season crop for stock feed as dryweather bites.Rural Commodities Wrap2014201520162017With oil still mired in the low 50s and the AUDback up to the high 70s range, it comes assomething of a surprise to see fuel pricesincreasing. Latest national data shows petrolprices at 128.5 cents/litre and diesel at 126.8cents/litre. Petrol is up around 8 cents/litrefor the month although diesel has beenmore stable.
WHEATASX MILLING WHEAT FUTUREEastern Australia, AUD/tonneCBOT SOFT RED WINTER WHEATUSD/tonne40040030030020020010010002010 2011 2012 2013 2014 2015 2016 2017LOWEST MINIMUM TEMPERATUREAugust 201702010 2011 2012 2013 2014 2015 2016 2017RAINFALL – LAST SIX MONTHSAnomaly mmPricesThe last few months have seen substantialvolatility in wheat prices, with easternAustralian futures briefly surging above 300/tonne (topping out at 317/tonne), anextraordinary result given prices had beenmired in the mid-240s range for months. Thisprice spike, caused by US crop concerns, is nowwell and truly over and wheat is back in themid-200s range in AUD terms. Meanwhile,global indicators have fallen even further,underling something of a premium fordomestic wheat in the coming months aslivestock producers scramble for feed.Nonetheless we expect wheat prices to remainsubdued on global markets.ProductionAugust brought mixed to bad news for ourwheat production model, with above averagerainfall Victoria, South Australia and WesternAustralia but continuing dry weather in NewSouth Wales and Queensland. Elevated frostactivity and heat waves add further uncertaintyto the outlook.Source: Bloomberg, Profarmer, USDA, Bureau of Meteorology, ABARES,Australian Bureau of Statistics and NAB Group Economics9Rural Commodities WrapOur central case estimate for the 2017-18Australian wheat crop is now 20.1 milliontonnes (down from 22.7 million tonnes lastestimate), based on rainfall to date andadjusted for frost activity. It is possiblethat this estimate will fall further nextmonth.
WHEAT CONTINUED: AVERAGE RAINFALL IN WHEAT REGIONSLong run average 1900-01 to 2013-142017 YTDSource: Bureau of Meteorology and NAB Group Mar150Feb200JanMayJanSOUTH RN AUSTRALIA2016QUEENSLANDFebVICTORIAJanNEW SOUTH WALESLa Nina years
OTHER BROADACRE CROPSSELECTED COARSE GRAINSCANOLA, NEWCASTLE y (feed)Barley (malting, Geelong)Sorghum (Newcastle)Rice (US rough)Oats (feed, Albany)10002010 2011 2012 2013 2014 2015 2016 2017SELECTED PULSESChick peas10002010 2011 2012 2013 2014 2015 2016 2017ICE NO.11 SUGARAUD/tonne1,400200AUD/tonneField 2010 2011 2012 2013 2014 2015 2016 2017Source: Bloomberg, Profarmer and NAB Group Economics11Rural Commodities Wrap02010 2011 2012 2013 2014 2015 2016 2017Prices for most coarse grains mostly saw a bigjump (reflecting wheat) followed by a steadyretreat. Rice and sorghum (with their differentproduction systems – rice being irrigated andsorghum a summer crop) have both remainedhigher however. Canola remains a stand-out,with prices holding up much better, althoughobtaining seed was a major challenge forplanting and anecdotal evidence points to lateflowering, frost damage and patchy yieldsacross many areas.Chick pea prices are back in the mid-700srange in AUD terms, a drop from the 1,200/tonne peaks of last year but still asubstantial premium compared to alternativecrops. Most of Australia’s chick peas are grownin northern New South Wales and Queenslandand have suffered from generally poorseasonal conditions, including low rainfall andlate frosts. We expect yields to be well downon last year.Sugar prices had shown some tentative signsof stabilisation after a big tumble this yearwhich wiped off all of the previous rally andfell close to 2015 lows in AUD terms. Howeverprices fell 3.7% in AUD terms in August, nothelped by the unexpected strength of the AUD.
BEEFEASTERN YOUNG CATTLE INDICATOR AND US CATTLE FUTURESThe concerted downward run in young cattleprices, which began in early May when theEYCI was in the mid-600s, looks to have stalledfor now in the mid-500s range. Dry weathercontinues to bite in Australia’s biggest cattlestate Queensland as well as New South Wales.Furthermore, beef export prices to the key USmarket have drifted lower over the past threemonths (although with restocker interest thekey driver of domestic prices over the last year,Australian prices had not followed US cattlefutures for some time). The EYCI is now belowits level at the same time in 2015.AUc/kg800EYCI700US live cattle future60050040030020010002000200520102015MONTHLY AUSTRALIAN BEEF EXPORTSTonnes swt140,000OtherIndonesiaChinaSouth 020102011201220132014Source: Meat and Livestock Australia and NAB Group Economics12Rural Commodities Wrap201520162017Beef export data reflects the uptick inslaughter in Queensland in particular, withAustralian beef export volumes up 22% yearon year in August. With winter drynesspotentially persisting into spring, it is likelythat there will be further turnoff and increasedpressure on saleyard prices. Elevated feedprices had been a concern for some producers,although the retreat of the global grain markethas eased much of this pressure.We see the EYCI falling to 500c/kg either latethis year or early next. While this represents asharp fall, prices should remain well abovepre-boom levels.
LAMB, PORK AND POULTRYNATIONAL TRADE LAMB INDICATORAUc/kg800MONTHLY LAMB EXPORTS BY DESTINATION Lamb prices felt the pressure of a dry start toTonnes arJordanUAEChinaUS10,0002005,00010002010 2011 2012 2013 2014 2015 2016 201702010 2011 2012 2013 2014 2015 2016 2017AUSTRALIAN PORK PRICE INDICATORABS POULTRY PRICE INDEX4504003503002502001501005002010 2011 2012 2013 2014 2015 2016 2017120AUc/kgAUD index115110105100959085802010 2011 2012 2013 2014 2015 2016 2017Source: Meat and Livestock Australia, Australian Pork, Australian Bureau of Statistics and NAB Group Economics13PNGRural Commodities Wrapwinter but have bounced back in the lastmonth, likely reflecting the improved seasonalconditions in key southern lamb regions. TheNational Trade Lamb Indicator gained 1.6% inAugust, one of the few commodities in ourindex to appreciate. While price falls are likelyin line with the usual spring flush, Thetrajectory for the industry remains positive.Export markets for lamb are reasonablydiversified, with the US and China accountingfor a substantial volume (around 41% byweight 2017 YTD). This compares to almost54% for the top two markets for Australianbeef. The Middle East also remains a veryimportant market, particularly for mutton andlive sheep.The severe drop in Australian pork prices looksto have stalled, with prices (measured as anaverage of buyer and seller prices for easternseaboard 60.1-75kg animals) down only 0.7%in August. Nonetheless, pork is off more than27% year on year. Competition from cheapimports (particularly with the AUD havingrisen) will remain a key challenge for theindustry over the coming year.
DAIRYNAB WEIGHTED DAIRY EXPORT PRICE INDICATOR /tonne (export price, LHS), AUD/kg milk solids (farm gate price RHS)AUD Index (LHS)USD index (LHS)Murray Goulburn milk price (RHS)60008NAB forecast640004200020020082009201020112012FARMGATE PRICESOpening54.705.202015201620172015-16 to 2016-17Revised5.30 5.502014SEASONAL MILK PRODUCTION CHANGE2017-18 4-8.0%QLD31.0%Western VIC2Northern -25%-4.9%-15%-5%5%Source: Australian Bureau of Statistics, Global Dairy Trade, Dairy Australia, processors, ABC and NAB Group EconomicsNote: chart shows Murray Goulburn farmgate prices except 2008-09 which shows Dairy Australia’s reported Victorianaverage value14Rural Commodities WrapGlobal Dairy Trade auction results in Augustwere again lower (despite expectations of flatto increasing prices) and the NAB weighteddairy export price indicator fell 3.8% for themonth in AUD terms.While recent auctions have perhapsunderperformed, the move in farmgate pricesfor the 2017-18 season has been much moreclosely watched domestically. MurrayGoulburn opened at 4.70/kgms, well belowBega and Warrnambool Cheese and Butter(both on 5.50/kgms) and Fonterra( 5.30/kgms). Seeking to maintain milk flow,Murray Goulburn revised its opening pricesubstantially higher to 5.20/kgms. Fonterrahas now announced a step-up to 5.5o/kgms,leaving Murray Goulburn again somewhat offthe pace.Milk flow last season was well down – off 6.9%nationally. The worst falls were in the majorexport states of Victoria, South Australia andTasmania. Northern Victoria saw particularlysteep declines, reflecting poor prices combinedwith a very wet 2016 spring. This season,seasonal conditions are looking much betteracross northern and western Victoria andSouth Australia, although very dry conditionsin Gippsland are a concern.
HORTICULTUREWHOLESALE FRUIT PRICESWHOLESALE VEGETABLE PRICESAUD index, Sydney and MelbourneAUD index, Sydney and 02003001502001001005002010 2011 2012 2013 2014 2015 2016 201702010 2011 2012 2013 2014 2015 2016 2017WINE AUSTRALIA WEIGHTED WINE GRAPE PRICESAUD/tonne1000Cabernet SauvignonChardonnay750GrenacheMerlotPinot Gris500Pinot NoirRiesling250Sauvignon ce: Ausmarket Consultants, Wine Australia and NAB Group Economics15Rural Commodities Wrap2017ShirazWe produce wholesale price indices for fruitand vegetables, based on data from theMelbourne and Sydney wholesale markets.Wholesale fruit and vegetable prices againdisplayed characteristic volatility in August,although both were lower. Fruit was down17.6%, largely reflecting seasonal factors,including lower orange and strawberry prices.In August the index stood at 132.4 index points(January 2010 100). Vegetables again fellsharply, down 14.7% to 104.3 index points.This drop reflects the end of an extraordinaryrally in tomato prices brought on partly by theeffects of Cyclone Debbie this year.Wine Australia’s 2017 National Vintage Reportshows prices rose once again this year, withthe average of all wine grapes up 7% on avolume weighted basis. An AUD at moresustainable levels in 2016 likely explains someof the increase, although the higher currencymore recently is some concern. Overall theindustry looks to be on a more sustainablefooting following years of glut and poor exportconditions. Among the best performers wereRiesling (up 13%), Shiraz (up 12%), and PinotGris (up 9%).
FIBRESWOOL – EASTERN MARKET 000WOOL PRICES BY MICRONSouthern OK A INDEXAUD/tonneAUSTRALIAN COTTON AND BASIN INFLOWProduction and MDB system inflows6,00014005,0001200lint production (kt) LHSMDB inflows (GL) RHS10004,0006002,0004001,00020002010 2011 2012 2013 2014 2015 2016 20170197519851995Source: Bloomberg, ABARES, Murray Darling Basin Authority and NAB Group EconomicsRural Commodities WrapThe Eastern Market Indicator rose 2.5% inAugust. With prices at these levels, ABARES30000 projects that wool production will increase inthe coming year, arresting (at least25000 temporarily) a long decline in production.200008003,000162130The wool market roared back from the winterrecess with gains across the micron range andthe EMI topping 1600c/kg. This comes despitethe sharp rally in the Australian dollar, towhich the wool industry is usually verysensitive. With yet another rally in the market,the question is whether prices are sustainableat their current levels. While we see goodsigns in the form of very strong Chinesedemand, the rally across the board (rather thanat the premium end) gives us some pause. It islikely that prices will come back from theirpeak over coming months.2005Cotton prices fell 7.1% in AUD terms in August.While the Australian cotton industry has15000expanded rapidly over the past three decades,10000 it remains dependent on irrigation water, witharound three-quarters of Australian cotton5000acreage irrigated. With low northern basininflows amid dry conditions, there is an0emerging risk to production for the coming2015season.
CONTACTSPhin ZiebellAgribusiness Economist 61 (0) 475 940 662Important NoticeAlan OsterChief Economist 61 3 8634 2927Riki PolygenisH-O Australian Economics 61 3 8697 9534Khan HorneGeneral ManagerNAB AgribusinessJustine DimondSenior Consultant 61 (0) 455 085 137This document has been prepared by National Australia Bank Limited ABN 12 004 044 937 AFSL 230686 ("NAB"). Any advice contained in this document has been prepared without taking into account your objectives,financial situation or needs. Before acting on any advice in this document, NAB recommends that you consider whether the advice is appropriate for your circumstances.NAB recommends that you obtain and consider the relevant Product Disclosure Statement or other disclosure document, before making any decision about a product including whether to acquire or to continue tohold it. Please click here to view our disclaimer and terms of use.Photo Mai Thai
Wool 1.5% 1.5% 2.5% : Sugar 15.0% 1.1% 3.7% : Cotton 5.8% 3.8% 7.1% : MONTHLY AUD PRICE CHANGES NAB RURAL COMMODITIES INDEX . Monthly average price change January 2010 100 . CONTENTS . 3 Price update 4 Regional price indicators 5 Seasonal conditions 6 Price and production outlook