Transcription
FY 2017 Results Rocket Internet Group & Selected Companies13 APRIL 2018
DisclaimerThis document is being presented solely for informational purposes and should not be treated as giving investment advice. It is not intended to be(and should not be used as) the sole basis of any analysis or other evaluation. All and any evaluations or assessments stated herein represent ourpersonal opinions. We advise you that some of the information is based on statements by third persons, and that no representation or warranty,expressed or implied, is made as to, and no reliance should be place on, the fairness, accuracy, completeness or correctness of this information oropinions contained herein.This presentation contains certain forward-looking statements relating to the business, financial performance and results of Rocket Internet SE, itssubsidiaries and its participations (collectively, “Rocket”) and/or the industry in which Rocket operates. Forward-looking statements concern futurecircumstances and results and other statements that are not historical facts, sometimes identified by the words “believes”, “expects”, “predicts”,“intends”, “projects”, “plans”, “estimates”, “aims”, “foresees”, “anticipates”, “targets” and similar expressions. The forward-looking statementscontained in this presentation, including assumptions, opinions and views of Rocket or cited from third party sources, are solely opinions andforecasts which are uncertain and subject to risks. Actual events may differ significantly from any anticipated development due to a number offactors, including without limitation, changes in general economic conditions, in particular economic conditions in the markets in which Rocketoperates, changes affecting interest rate levels, changes in competition levels, changes in laws and regulations, environmental damages, thepotential impact of legal proceedings and actions and Rocket’s ability to achieve operational synergies from acquisitions. Rocket does notguarantee that the assumptions underlying the forward-looking statements in this presentation are free from errors nor does it accept anyresponsibility for the future accuracy of the opinions expressed in this presentation or any obligation to update the statements in this presentation toreflect subsequent events. The forward-looking statements in this presentation are made only as of the date hereof. Neither the delivery of thispresentation nor any further discussions of Rocket with any of the recipients thereof shall, under any circumstances, create any implication thatthere has been no change in the affairs of Rocket since such date. Consequently, Rocket does not undertake any obligation to review, update orconfirm recipients’ expectations or estimates or to release publicly any revisions to any forward-looking statements to reflect events that occur orcircumstances that arise in relation to the content of the presentation.Neither Rocket Internet SE nor any other person shall assume any liability whatsoever (in negligence or otherwise) for any loss howsoever arisingfrom any use of this presentation or the statements contained herein as to unverified third person statements, any statements of futureexpectations and other forward-looking statements, or the fairness, accuracy, completeness or correctness of statements contained herein, orotherwise arising in connection with this presentation.2
AgendaTopicPresenterFY 2017 Results for Rocket Internet & Selected CompaniesPeter KimpelCFOSummary RemarksOliver SamwerFounder and CEO3
Rocket Internet’s Selected Companies at a GlanceFY eAggregateAdj. EBITDAMargin(2,3)FY 2017Improvement3.26YoY Growth: 31%2.642.06YoY Growth: 28%(%)(15.4)(10.3)YoY Improvement: 5.0pp(EURb)AggregateAdj. EBITDA(3)YoY Reduction: EUR 44m(0.36)(0.31)Aggregate financials include: HelloFresh, Jumia, Westwing, Home24 and GFG (consolidated figures excluding Jabong and Namshi).Source: Unaudited consolidated financial information based on IFRS and management reports of HelloFresh, Jumia, Westwing, Home24 and GFG. Please refer to the appendix for detailedinformation.Note(s): Despite not having control over the network companies shown above, the aggregate financial information is shown on a 100% basis (i.e. 100% of GMV, Revenue and adj. EBITDA). The actuallegal and economic interest of the group in the network companies shown above ranges between 20% (GFG) and 44% (HelloFresh).(1) For HelloFresh: GMV same as Revenue; for GFG: NMV instead of GMV; for Home24: GOV instead of GMV.(2) For Jumia: margin on GMV.(3) Adjusted for share-based compensation; HelloFresh and GFG also adjusted for certain non-recurring items.4
Continued Increase in Revenue Across Selected CompaniesEURm800700600500400YoY Growth(Q4 2017 / Q4 2016) 27%3000Q1 2015Q2 2015Q3 2015Q4 2015Q1 2016Q2 2016Q3 2016Q4 2016Q1 2017Q2 2017Q3 2017Q4 2017Aggregate financials include: HelloFresh, Jumia, Westwing, Home24 and GFG (excluding Jabong and Namshi).Source: Unaudited consolidated financial information based on IFRS and management reports of HelloFresh, GFG, Jumia, Westwing and Home24. Please refer to the appendix for detailedinformation.Note(s): Despite not having control over the network companies shown above, the aggregate financial information is shown on a 100% basis (i.e. 100% of Revenue). The actual legal and economicinterest of the group in the network companies shown above ranges between 20% (GFG) and 44% (HelloFresh).5
Continued Improvements in Adj. EBITDA AcrossSelected CompaniesEURmQ1 2015Q2 2015Q3 2015Q4 2015Q1 2016Q2 2016Q3 2016Q4 2016Q1 2017Q2 2017Q3 2017Q4 20170(50)(100)(150)(200)Aggregate financials include: HelloFresh, Jumia, Westwing, Home24 and GFG (excluding Jabong and Namshi).Source: Unaudited consolidated financial information based on IFRS and management reports of HelloFresh, GFG, Jumia, Westwing and Home24. Please refer to the appendix for detailedinformation.Note(s): Despite not having control over the network companies shown above, the aggregate financial information is shown on a 100% basis (i.e. 100% adj. EBITDA). The actual legal and economicinterest of the group in the network companies shown above ranges between 20% (GFG) and 44% (HelloFresh). EBITDA adjusted for share-based compensation; HelloFresh and GFG also adjustedfor certain non-recurring items.6
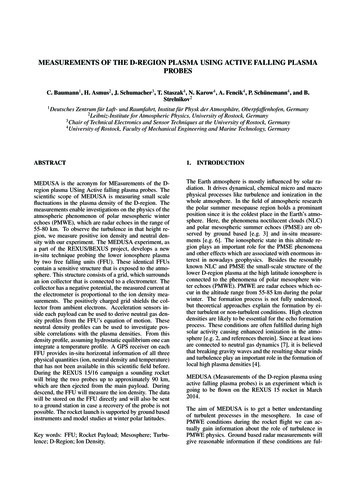
Continued Increase in 1,5001,2009006003000FY 2016Food & GroceriesFashion(1)General MerchandiseHome & LivingFY 2017Source: Unaudited consolidated financial information based on IFRS and management reports of HelloFresh, GFG, Jumia, Westwing and Home24. Please refer to the appendix for detailedinformation.Note(s): Despite not having control over the network companies shown above, the aggregate financial information is shown on a 100% basis (i.e. 100% of Revenue). The actual legal and economicinterest of the group in the network companies shown above ranges between 20% (GFG) and 44% (HelloFresh).(1) Including Lamoda, Dafiti and Zalora & The Iconic and excluding Namshi.7
Continued Topline GrowthTopline(1) Growth FY 2016 – FY 2017Regional businesses of GFG60%52%42%40%33%24%23%20%16%13%6%0%Food &GroceriesFashion(2)GeneralMerchandiseHome & LivingSource: Unaudited consolidated financial information based on IFRS and management reports of HelloFresh, GFG, Jumia, Westwing and Home24. Please refer to the appendix for detailed information.Note(s): Despite not having control over the network companies shown above, the aggregate financial information is shown on a 100% basis (i.e. 100% of GMV and Revenue). The actual legal andeconomic interest of the group in the network companies shown above ranges between 20% (GFG) and 44% (HelloFresh).(1) Revenue growth; for Jumia: GMV growth.(2) Lamoda, Dafiti and Zalora & The Iconic are regional businesses of GFG. Only Lamoda, Dafiti and Zalora & The Iconic are included in GFG’s group numbers (excluding Namshi).8
Adj. EBITDA Margins Improved Significantlyat Selected CompaniesMarginImprovement 6.1pp 5.8pp(1) 1.9pp(1) 3.6pp 8.5pp(2)Adj. .4%)(16%)(26%)Total(10.3%)(24%)Adj. EBITDAmargin improvement(FY 2017 / FY 2016)Adj. EBITDA Margin FY 2016Adj. EBITDA Margin FY 2017 5.0ppSource: Unaudited consolidated financial information based on IFRS and management reports of HelloFresh, GFG, Jumia, Westwing and Home24. Please refer to the appendix for detailedinformation.Note(s): Despite not having control over the network companies shown above, the aggregate financial information is shown on a 100% basis (i.e. 100% of GMV, Revenue and adj. EBITDA). Theactual legal and economic interest of the group in the network companies shown above ranges between 20% (GFG) and 44% (HelloFresh).(1) HelloFresh and GFG are also adjusted for certain non-recurring items. GFG excluding Namshi.(2) Adj. EBITDA margin on GMV.9
Losses Reduced as Companies )(131)(120)(315)Adj. EBITDA FY 2016 in EURmAdj. EBITDA FY 2017 in EURm(359)Source: Unaudited consolidated financial information based on IFRS and management reports of HelloFresh, GFG, Jumia, Westwing and Home24. Please refer to the appendix for detailedinformation.Note(s): Despite not having control over the network companies shown above, the aggregate financial information is shown on a 100% basis (i.e. 100% of adj. EBITDA). The actual legal andeconomic interest of the group in the network companies shown above ranges between 20% (GFG) and 44% (HelloFresh).(1) Also adjusted for certain non-recurring items.(2) Also adjusted for certain non-recurring items. GFG excluding Namshi.10
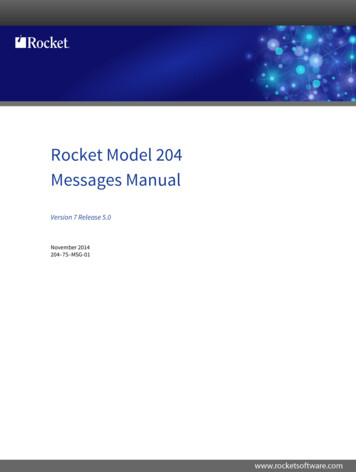
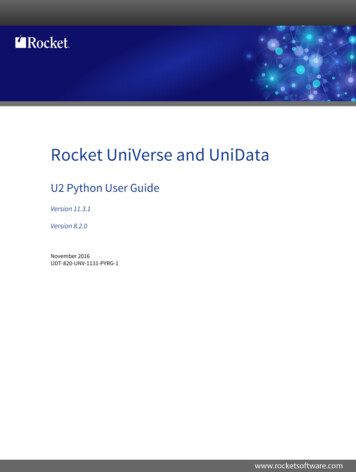
Value Crystallization with Two of Europe’s LargestInternet IPOs in 2017EUR 7.2bCurrent MarketCap(1) 54%Share PriceIncrease(1)EUR 2.1bSince IPOCurrent MarketCap(1) 30%Share Price Increase(1) Since IPO8%c. EUR 580m44%c. EUR 940mCurrent Rocket Stake(2)Market Value of Rocket Stake(1)Current Rocket Stake(2)Market Value of Rocket Stake(1)EURShare price since IPOShare price since IPOEUR 39.303814 13.283412(3)30 25.50 10.25(3)102622Adj. EBITDA Margin FY 2016Adj. EBITDA Margin FY 20178Nov-17Nov-17Dec-17Mar-18Dec-17 Jan-18Jan-18 Feb-18 Feb-18Mar-18Note(s):(1) Xetra closing price as of March 29, 2018.(2) Economic ownership.(3) IPO offering price.11
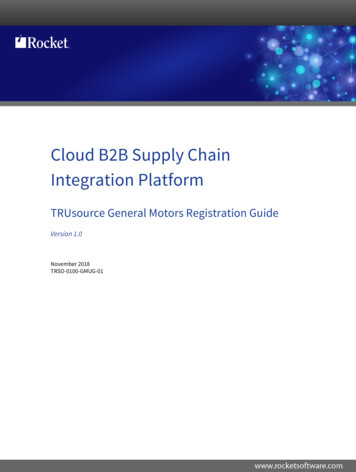
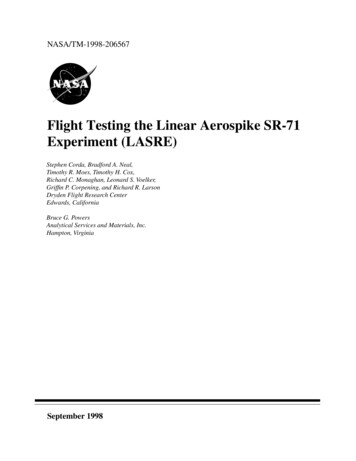
HelloFresh Continues to Grow While SignificantlyReducing LossesRevenue (EURm)Adjusted EBITDA (EURm)Number of Orders (m) 52% 13m 53%905FY 201619FY 201712597(70)FY 2016FY 2017(83)FY 2016FY 2017Source: HelloFresh annual report 2017.Note(s): Rocket Internet economic ownership as of reporting date: 44%.12
Global Fashion Group (GFG)FY 2017 3653243002001000Source: GFG’s consolidated financial information based on IFRS and management reports. Please refer to the appendix for detailed information.Note(s):(1) GFG’s consolidated Revenue excludes Namshi; differences relative to sum-of-the-parts are due to eliminations, holding and other.13
GFG Consolidated(excl. Jabong and 7(4)282.6328.0886.91,095.0% Growth YoY(FX neutral pro-forma)(1)22.7%19.9%% Growth YoY (EUR)16.1%23.5%Gross Profit119.7124.6361.4430.9% dj. EBITDA(2)% MarginCash Balance (pro-forma)(3)NMV288.4337.7% Growth YoY(FX neutral pro-forma)(1)23.7%21.1%% Growth YoY (EUR)17.1%25.3%Total Orders (m)% Growth YoYActive Customers (LTM, m)% Growth YoY6.88.123.019.1%Key Performance DriversFinancialRevenue/ NMV Continued Revenue growth of 23.5% (FY) and 16.1% (Q4). On a constant currency proforma basis, growth was 19.9% (FY) and 22.7% (Q4). NMV, which includes Marketplace sales, reached EUR 1,130.6m (FY) and 337.7m (Q4),growing 21.1% (FY) and 23.7% (Q4), on a constant currency pro-forma basis. Growth largely derived from order growth of the active customer base which isapproaching 10 million active customers per year end.Profitability Q4 Gross margin was impacted by the required price investments to trade effectivelyacross markets as well as product mix effects. This impact was more than compensated by path-to-profit initiatives and scale benefits,delivering YoY improvement in profitability by 3.5pp in Q4.Ownership Rocket Internet economic ownership: 20%(5)Operational26.7 GFG entered into a partnership in the Middle East with Emaar Malls acquiring 51% ofNamshi in August 2017 for a cash consideration of USD 151m. The partnership with Ayala, which acquired a 49% stake in Zalora Philippines through aprimary investment, was also successfully completed in August 2017.16.1%8.89.912.5%Source: GFG’s unaudited consolidated quarterly financial information and audited consolidated full year financial information based on IFRS and unaudited management reports. Please refer to theappendix for detailed information.Note(s):(1) Growth rate is shown on a constant currency basis and therefore excludes the effect of foreign currency movements. For the purpose of comparison, growth rates are shown on a pro-forma basis;Dafiti includes Kanui and Tricae and excludes Mexico; Zalora excludes Thailand and Vietnam; Jabong and Namshi are excluded.(2) Adjusted for share-based compensation expenses, impairment losses and non-recurring items.(3) Cash position is shown on a pro-forma basis including all outstanding proceeds from closed transactions where relevant.(4) Excluding discontinued operations of Jabong and Namshi (balance sheet items in FY 2016 include Namshi).(5) Economic ownership includes stakes held directly as well as indirectly, including beneficial interest through RICP (where applicable).14
1305.1405.1Key Performance DriversFinancialRevenue/ NMV% Growth YoY (FX neutral)(1)16.2%21.0% Lamoda’s Revenue increased to EUR 405.1m (FY) and EUR 122.1 (Q4), representing agrowth of 21.0% (FY) and 16.2% (Q4) on a constant currency basis. % Growth YoY (EUR)14.8%32.8%Likewise, NMV grew to EUR 388.9m (FY) and 116.1m (Q4), showing constant currencygrowth of 17.2% and 11.9%, respectively.ProfitabilityGross Profit43.647.1120.5151.0 Gross Profit margin reduced by 2.2pp to 37.3% (FY) or by 2.4pp to 38.6% (Q4) driven byinvestments in competitive pricing and product mix effects.% MarginNMV41.0%38.6%39.5%37.3%105.0116.1300.0388.9% Growth YoY (FX neutral)(1)11.9%17.2%% Growth YoY (EUR)10.6%29.6%Source: GFG’s unaudited consolidated quarterly financial information and audited consolidated full year financial information based on IFRS and unaudited management reports. Please refer to theappendix for detailed information.Note(s): Consolidated Lamoda financial information on EUR basis is derived from GFG’s unaudited consolidated quarterly financial information and audited consolidated full year financial informationbased on IFRS and unaudited management reports.(1) Growth rate is shown on a constant currency basis and therefore excludes the effect of foreign currency movements.15
315.5365.2Key Performance DriversFinancialRevenue/ NMV% Growth YoY(FX neutral pro-forma)(1)18.2%12.5% Q4 Revenue grew by 18.2% on a constant currency basis to EUR 108.4m, resulting in FYRevenue of EUR 365.2, a constant currency growth of 12.5% YoY. % Growth YoY (EUR)8.8%15.8%NMV increased by 22.1% to EUR 113.6m (Q4), driven by a successful Black Fridaycampaign in Brazil as well as further improvements to the assortment, driving NMV toEUR 388.7m (FY), a 16.9% increase YoY on a constant currency basis.Gross Profit% ability FY Gross Profit margin was 42.6%, a YoY reduction of 0.8pp. Q4 Gross Profit margin decreased by 3.1pp YoY to 40.3%, driven by investments incompetitive pricing across the region, which included key promotional events like BlackFriday and Christmas promotions, as well as by product mix effects.NMV101.1113.6323.6388.7% Growth YoY(FX neutral pro-forma)(1)22.1%16.9%% Growth YoY (EUR)12.4%20.1%Source: GFG’s unaudited consolidated quarterly financial information and audited consolidated full year financial information based on IFRS and unaudited management reports. Please refer to theappendix for detailed information.Note(s): Consolidated Dafiti financial information on EUR basis is derived from GFG’s unaudited consolidated quarterly financial information and audited consolidated full year financial informationbased on IFRS and unaudited management reports.(1) Growth rate is shown on a constant currency basis and therefore excludes the effect of foreign currency movements. For the purpose of comparison, growth rates are shown on a pro-forma basis;includes Kanui and Tricae and excludes Mexico.16
Zalora & The 61.2323.5Key Performance DriversFinancialRevenue/ NMV% Growth YoY(FX neutral pro-forma)(1)37.8%% Growth YoY (EUR)28.8%27.9% Zalora and The Iconic Q4 Revenue grew to EUR 97.1m, driving FY Revenue to EUR323.5m, resulting in a constant currency pro-forma growth of 27.9% (FY) and 37.8% (Q4). 23.9%Q4 NMV grew by 40.7% on a pro-forma constant currency basis to EUR 108.0m,resulting in FY NMV of EUR 353.0m, a constant currency pro-forma increment of 30.7%over the previous year.Gross Profit32.734.2103.2125.2Profitability % Margin43.4%35.2%39.5%38.7%Gross Profit margin declined by 8.2pp in Q4 to 35.2%, driven by competitive promotionalpricing during key trading periods and by promotional events as well as product mixeffects.NMV82.3108.0278.9353.0% Growth YoY(FX neutral pro-forma)(1)40.7%30.7%% Growth YoY (EUR)31.2%26.6%Source: GFG’s unaudited consolidated quarterly financial information and audited consolidated full year financial information based on IFRS and unaudited management reports. Please refer to theappendix for detailed information.Note(s): Consolidated Zalora & The Iconic financial information on EUR basis is derived from GFG’s unaudited consolidated quarterly financial information and audited consolidated full year financialinformation based on IFRS and unaudited management reports.(1) Growth rate is shown on a constant currency basis and therefore excludes the effect of foreign currency movements. For the purpose of comparison, growth rates are shown on a pro-forma basis;excludes Thailand and Vietnam.17
JumiaEURmQ42016Q42017FY2016FY2017Key Performance DriversGMV120.2197.9357.5507.0Financial% Growth YoYRevenue64.5%29.9% Growth YoYGross Profit% MarginAdj. EBITDA(1)% Margin36.5% Growth YoYActive Customers (LTM, m)% Growth YoY84.322.0%93.811.2%GMV Continued attractive growth with acceleration in Q4 of 64.5% YoY. On a constant currency basis, it is even more pronounced with growth of 113% YoY.Profitability/ Cash Position FY Gross Profit, as percentage of GMV, slightly decreased to 5.3% from 8.4%, mostlydriven by lower commissions in order to further increase liquidity on the marketplaces. Adj. EBITDA as percentage of GMV improved to (23.7)% compared to (25.5)% in FY2016. Pro-forma Cash Position of EUR 245.0m(2)Ownership Rocket Internet economic ownership: 29.0 4.98.3 68.3% 2.2 Cash PositionTotal Orders (m)41.8%1.63.194.1%1.547.4%OperationalSignificant success of Black Friday, breaking all previous sales records across all toplinedrivers (new customers, orders, items sold, visits).Successful ramp-up of the revenue diversification strategy with progressive increase inRevenue from value added services (e.g. Marketing and data services, logistics).Continued investments in the marketplace platform attracted new customers andcontinued scaling to nearly double the number of orders in Q4.Continuous improvement in customer relevance by increasing SKUs live on the platformfrom 1m in January 2016 to 5.9m to date.Source: Jumia’s unaudited consolidated financial information based on IFRS and management reports. Please refer to the appendix for detailed information.Note(s): On August 30, 2016 Africa eCommerce Holding GmbH, the holding company of Jumia, was merged into Africa Internet Holding GmbH (formerly trading under Africa Internet Group). In June2016, all business models of Africa Internet Group were renamed under the Jumia brand. The figures shown for all periods refer to Africa Internet Holding GmbH.(1) Adjusted for share-based compensation expenses.(2) Pro-forma cash position includes cash on balance sheet and capital commitments.(3) Economic ownership includes stakes held directly as well as indirectly, including beneficial interest through RICP (where applicable).18
WestwingEURmQ42016Q42017FY2016FY2017Key Performance DriversRevenue76.685.1250.4265.8Financial% Growth YoYGross Profit% MarginAdj. EBITDA(1)% 90.4Cash PositionGMV77.7% Growth YoYTotal Orders (m)% Growth YoYActive Customers (LTM, m)% Growth YoY6.2%90.216.1%0.80.9GMV/ Revenue Re-acceleration of growth in Q4, with 16.1% increase in GMV and 11.2% increase inRevenue, based on a growth-oriented model with only 5-6% marketing ratio. Acceleration driven predominantly by strong DACH business, which grew by more than30% YoY in Q4, leading the path for other geographies.Profitability Overall profitable in Q4 2017 with DACH business being a key driver of the strongdevelopment in profitability.Ownership Rocket Internet economic ownership: 32%(2)Operational 8.8%2.811.8%2.8(0.4%)1.01.00.1% Westwing’s loved lifestyle brand continues to lead in the rapidly-growing Home & LivingWestwing’sis leadingin customers.the rapidly-growingHome& LivingeCommerceeCommercelifestylemarket,brandwith 90%femaleIncrediblecustomerloyalty:85% ofmarket,with 90%customers.GMV comesfrom femalecustomerswho visit Westwing on average 100x per year.Customer85%(Privateof GMVLabel)comesfrom customerswhorate,visit inWestwingon averageWestwing loyalty:collectionsgrowingat triple-digitQ4 alreadyat 10%100xyear. GMV, with great customer proposition and strong margins.shareperof Group’s e to convincingSuperior newmarketingmodelLabel)drivinggrowthwith lowercustomeracquisition customercost andpropositionandcustomerattractivelifetimemargin value.profile.continued high ProfitableProfitable andand fastfast growinggrowing DACHDACH businessbusiness modelmodel isis beingbeing replicatedreplicated inin otherother EuropeanEuropeancountries, withcountries,with anan approachapproach basedbased onon internationalinternational rolloutrollout ofof privateprivate label,label, onlineonline shopshopandand marketing.marketing.Source: Westwing’s unaudited consolidated financial information based on IFRS and management reports. Please refer to the appendix for detailed information.Note(s): KPIs only include revenue generated via website. Other revenue sources (e.g. offline store) are not considered.(1) Adjusted for share-based compensation expenses.(2) Economic ownership includes stakes held directly as well as indirectly, including beneficial interest through RICP (where applicable).19
Home24EURmQ42016Q42017FY2016FY2017Key Performance DriversRevenue66.079.7243.8275.7Financial% Growth YoYGross Profit% MarginAdj. EBITDA(1)% tability Gross Profit margin improved by 2.7pp YoY to 44.6% during the year, and by 1.1pp YoYto 46.4% in Q4.(5.5)(4.0)(40.1)(21.8) (8.4%)(5.1%)(16.5%)(7.9%)34.019.9365.2431.0102.9% Growth YoYTotal Orders (m)% Growth YoYActive Customers (LTM, m)% Growth YoYRevenue Continuing Revenue acceleration during the year with Q4 growth of 20.8% YoY lead toFY Revenue of 275.7m, an increase of 13.1% YoY.29.9Cash nership Rocket Internet economic ownership: 41%(2)Operational Strengthened position in its core markets in Continental Europe and LatAm throughcombination of a non-inventory model with a high-margin private label inventory model. Home24 maintains a broad product offering with highly competitive prices and relativelyshort delivery times. Positive performance effects from its investments in optimized processes and systems aswell as from continued focus on product quality, fulfillment performance and customerservice quality.12.3%1.01.19.1%Adjusted EBITDA further improved, despite increased marketing expense and significantinvestments in processes and systems.Source: Home24’s unaudited consolidated financial information based on IFRS and management reports. Please refer to the appendix for detailed information.Note(s):(1) Adjusted for share-based compensation expenses.(2) Economic ownership includes stakes held directly as well as indirectly, including beneficial interest through RICP (where applicable).20
FY 2017 Results Rocket Internet SE –Consolidated IFRS Income StatementEURmRevenueFY 2016FY 201750.436.8Internally produced and capitalized assets2.90.0Other operating income1.21.548.311.6Purchased merchandise and purchased services(24.2)(15.8)Employee benefits expenses(59.0)(63.7)Other operating expenses(45.3)(27.7)Share of profit/loss of associates and joint ult from deconsolidation of subsidiariesDepreciation and amortizationImpairment of non-current assets(9.3)(0.7)EBIT(579.0)(56.8)Financial result(168.0)47.0Finance .5)(6.0)(44.1)(8.2)(697.4)2.3(4.22)0.01Finance incomeLoss before taxIncome taxesLoss for the periodLoss attributable to non-controlling interestsLoss/profit attributable to equity holders of the parentEarnings per share (in EUR) Revenue decline is due to a reduction of services rendered tonetwork companies as well as deconsolidations, sales (LaNevera Roja and Pizzabo in early 2016) or discontinuation ofpreviously fully consolidated subsidiaries. Result from deconsolidation strongly decreased, as nomajor deconsolidations occurred during FY 2017. Increase in employee benefit expenses is due to fair valuechanges in the underlying basis for cash-settled share-basedpayments and higher expenses from equity-settled sharebased payments. Net gain from associates/JVs in FY 2017 is driven by noncash effects: net impairment losses (EUR (65)m), equitypickups including deemed disposals (EUR 64m) primarilyrelated to HF and Traveloka and results from disposal (EUR4m). FY 2016 mainly impacted by impairment losses of GlobalFashion Group and Linio, as well as negative equity pickupsof key companies. Positive financial result reflects gain from the sale of theremaining Lazada shares (EUR 75m) and recycling of othercomprehensive income (OCI) in connection with the partialsale of available-for-sale financial assets (EUR 66m). Negative impact from agreement with Naspers regarding thesale of shares in Delivery Hero.Source: Audited consolidated financial statements.21
FY 2017 Results Rocket Internet SE –Consolidated IFRS Balance SheetAssetsEURmDec 312016Dec 312017Equity and LiabilitiesEURmDec 312016Dec 312017Non-current assetsProperty, plant and equipment3.52.9EquitySubscribed capital165.1165.1Intangible assets2.18.9Treasury shares0.0(21.1)Investments in associates and joint venturesNon-current financial assetsOther non-current non-financial assets837.5853.0Capital reserves3,099.43,100.31,542.1937.9Retained earnings210.6235.20.51.0Other components of .1332.6285.15.012.5Equity attributable to equity holders of the parentNon-controlling interestsTotal non-current assetsTotal equity2,385.61,803.7Inventories0.70.2Non-current financial liabilitiesTrade receivables7.65.4Other non-current non-financial liabilitiesCurrent assetsOther current financial assetsOther current non-financial assetsIncome tax assetNon-current liabilities216.31,014.23.32.2Deferred tax liabilitiesTotal non-current liabilities13.11,401.01,716.6Trade payablesTotal current assets1,631.62,751.6167.40.04,184.64,555.3Other current financial liabilitiesOther current non-financial liabilitiesIncome tax liabilitiesTotal current liabilitiesLiabilities directly associated with assets classified as held for saleTotal liabilitiesTotal equity and liabilitiesTotal assets1.2298.7Current liabilities2.6Cash and cash equivalentsAssets classified as held for 101.116.11.0130.50.0429.24,555.3 Increase in current financial assets due to reclassification of DH shares(EUR 738) sold to Naspers into current assets (transaction closed in Q12018). Increase in current financial liabilities due to the recognition of a derivative financialliability (the agreement with Naspers regarding the sale of shares in Delivery Hero). Non-current financial assets consist mainly of DH shares (EUR 728m) andother equity investments (EUR 129m). Decrease in non-current financial liabilities due to buyback of convertible bonds.Source: Audited consolidated financial statements.22
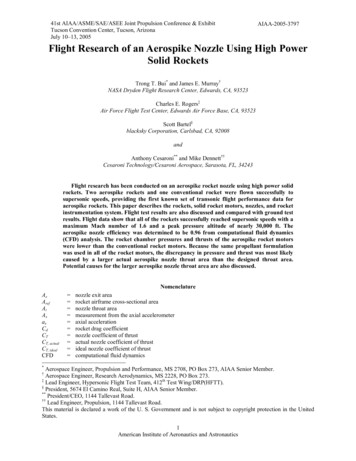
Strong Cash ReservesCash at Operating Companiesas of March 31, 2018Cash at Rocket Internet SEas of March 31, 2018EUR1.5bEUR1.2bGross CashNet Cash (3)c. EUR 0.5b(1)EUR 2.7bEUR 2.4b(Selected Companies andRegional Internet Groups(2))Gross CashNet Cash(3)Source: Unaudited management information.Note(s):(1) Cash position includes gross cash and committed equity capital.(2) Selected companies include: GFG, Jumia, Westwing and Home24, i.e. excluding HelloFresh. Regional Internet Groups include APACIG (Asia Pacific Internet Group) and MEIG (Middle EastInternet Group).(3) Net cash represents gross cash minus (i) convertible bond outstanding and (ii) commitments.23
Financial Calendar 2018DateEventMay 29, 2018Q1 2018 Results for Rocket Internet & Selected CompaniesJune 8, 2018FY 2017 Annual General MeetingSeptember 20, 2018H1 2018 Results for Rocket Internet & Selected
Share Price Increase (1)Since IPO EUR 7.2b Current Market Cap(1) 8% Current Rocket Stake(2) 8 10 12 14 Nov-17 Dec-17 Jan-18 Feb-18 Mar-18 Share price since IPO Share price since IPO Note(s): (1) Xetra closing price as of March 29, 2018. (2) Economic ownership. (3) IPO offering price. Nov-17 Dec-17 Jan-18 Feb-18 Mar-18 30% Share Price Increase .