Transcription
IntroductionPrice action is one of the most commonly used tools throughoutthe financial markets. It is a type of technical analysis thatfocuses on the historical price movements of a security orcommodity for the purpose of predicting future movements.It is the visual representation of market participants' behavior.Learning to read, analyze, and forecast price action is the firststep of understanding the financial markets.Price action can seem like a very difficult subject to master.There is a lot of written material on the subject but can be quitecomplex to understand. This guide aims to bring clarity toimportant price actions and how you can use them in yourtrading.Disclaimer:All information in this book is purely for educational purposes. The Information in thisbook is not intended to be and does not constitute financial advice. It is general innature and not specific to you. You are responsible for your own investment researchand investment decisions. In no event will Dr Wealth be liable for any damages. Underno circumstances will the Dr Wealth be liable for any loss or damage caused by areader’s reliance on the Information in this report. Readers should seek the advice of aqualified and registered securities professional or do their own research and duediligence.
Table ofContentsWhat is Price Action?TrendlinesUpward TrendlinesDownward TrendlinesTrendline BreakoutCandlestick PatternsSimple Candlestick patternsComplex Candlestick patternsChart PatternsDouble TopDouble BottomTriple TopTriple BottomHead and Shoulders TopHead and Shoulders BottomPrice and Volume AnalysisVolume falls on price supportVolume confirmation on price breakoutConclusion
What is Price Action?Price action trading is a style of trading thatrelies on how the price moves overtime asopposed to market indicators or other technicalanalysis tools.There are no technical indicators like moving averageor RSI.Instead, price action traders use the “historical” priceand volume data of a security to determine where thesecurity is likely to go in the future.Traders may draw trend lines or rely on candlestickpatterns to make such decisions.The trader believes that the market price reflects allavailable information so at any given time you cananalyse the current price action and decide how totrade.You can trade price action using a variety ofmethods and at different time frames. Someprefer to trade the higher time frames such as thedaily chart, while others prefer to trade the lowertime frames such as the hourly chart.
TrendlinesTrendlines are an indicator of the direction ofthe price action.A trendline is simply a line on a chart connecting aseries of points showing the general direction ofa price movement.They are useful to traders for identifying supportor resistance levels, or as a visual aid to helpspot price trends. Normally, the more points thereare in a trendline, the more significant it becomes.It is important to know how to draw trendlines onyour chart. They can be used to help you get in or outof trades. They can also be used to determine thestrength of the trend.
Upward TrendlinesAn upward trendline has a positive slope and twoor more low points.The second low must be higher than the first for theline to have a positive slope. This line is consideredto be valid when there are at least three (3) datapoints connected above each other.The upward trendline acts as a support for theprice and the bullishness remains as long as the pricestays above the up trendline.
Downward TrendlinesA downward trendline has a negative slope andtwo or more low points.The second low must be lower than the first for theline to have a negative slope. This line is consideredto be valid when there are at least three (3) datapoints connected above each other.The downward trendline acts as a resistancefor the price and the bullishness remains as long asthe price stays below the down trendline.
Trendline BreakoutRemember that the upward trendline acts as a pricesupport. Any breakdown of the upwardtrendline could be a sign of potential trendreversal (although this could sometimes be a falsealarm).Image: Trade Forex TradingSimilarly, a break above the downwardtrendline signals that the trend might turnfrom a bear to a bull.Image: Trade Forex Trading
Candlestick PatternsIn technical analysis, a candlestick pattern is amovement in prices shown graphically on acandlestick chart that some believe can predict aparticular market movement.The recognition of the pattern is subjective andprograms that are used for charting have to rely onpredefined rules to match the pattern.There are 42 recognised patterns that can be splitinto simple and complex patterns.
Simple Candlestick PatternsBig Black Candlehas an unusually long black body with a wide rangebetween high and low. Prices open near the high and closenear the low. Considered a bearish pattern.Big White Candlehas an unusually long white body with a wide rangebetween high and low of the day. Prices open near the lowand close near the high. Considered a bullish pattern.Black Bodyformed when the opening price is higher than the closingprice. Considered to be a bearish signal.White Bodyformed when the closing price is higher than the openingprice and considered a bullish signal.Dojiformed when opening and closing prices are virtually thesame. The lengths of shadows can vary.Long-Legged Dojiconsists of a Doji with very long upper and lower shadows.Indicates strong forces balanced in opposition.Dragonfly Dojiformed when the opening and the closing prices are at thehighest of the day. If it has a longer lower shadow it signalsa more bullish trend. When appearing at market bottomsit is considered to be a reversal signal.Gravestone Dojiformed when the opening and closing prices are at thelowest of the day. If it has a longer upper shadow it signals abearish trend. When it appears at market top it isconsidered a reversal signal.
Simple Candlestick PatternsHammera black or a white candlestick that consists of a small body nearthe high with a little or no upper shadow and a long lower tail.Considered a bullish pattern during a downtrend.Hanging Mana black or a white candlestick that consists of a small body nearthe high with a little or no upper shadow and a long lower tail.The lower tail should be two or three times the height of thebody. Considered a bearish pattern during an uptrend.Long Upper Shadowa black or a white candlestick with an upper shadow that has alength of 2/3 or more of the total range of the candlestick.Normally considered a bearish signal when it appears aroundprice resistance levels.Long Lower Shadowa black or a white candlestick is formed with a lower tail thathas a length of 2/3 or more of the total range of the candlestick.Normally considered a bullish signal when it appears aroundprice support levels.Marubozua long or a normal candlestick (black or white) with no shadowor tail. The high and the lows represent the opening and theclosing prices. Considered a continuation pattern.Spinning Topa black or a white candlestick with a small body. The size ofshadows can vary. Interpreted as a neutral pattern but gainsimportance when it is part of other formations.Shaven Heada black or a white candlestick with no upper shadow.[Compared with hammer.]Shaven Bottoma black or a white candlestick with no lower tail.[Compare with Inverted Hammer.]
Complex Candlestick PatternsBearish Haramiconsists of an unusually large white body followed by asmall black body (contained within large white body). It isconsidered as a bearish pattern when preceded by anuptrend.Bearish Harami Crossa large white body followed by a Doji. Considered as areversal signal when it appears at the top.Bearish 3-Method Formationa long black body followed by three small bodies (normallywhite) and a long black body. The three white bodies arecontained within the range of first black body. This isconsidered as a bearish continuation pattern.Bullish 3-Method Formationconsists of a long white body followed by three small bodies(normally black) and a long white body. The three blackbodies are contained within the range of first white body.This is considered as a bullish continuation pattern.Bullish Haramiconsists of an unusually large black body followed by asmall white body (contained within large black body). It isconsidered as a bullish pattern when preceded by adowntrend.Bullish Harami Crossa large black body followed by a Doji. It is considered as areversal signal when it appears at the bottom.Dark Cloud Coverconsists of a long white candlestick followed by a blackcandlestick that opens above the high of the whitecandlestick and closes well into the body of the whitecandlestick. It is considered as a bearish reversal signalduring an uptrend.
Complex Candlestick PatternsEngulfing Bearish Lineconsists of a small white body that is contained within thefollowed large black candlestick. When it appears at top itis considered as a major reversal signal.Engulfing Bullishconsists of a small black body that is contained within thefollowed large white candlestick. When it appears atbottom it is interpreted as a major reversal signal.Evening Doji Starconsists of three candlesticks. First is a large white bodycandlestick followed by a Doji that gap above the whitebody. The third candlestick is a black body that closes wellinto the white body. When it appears at the top it isconsidered as a reversal signal. It signals more bearishtrend than the evening star pattern because of the doji thathas appeared between the two bodies.Evening Starconsists of a large white body candlestick followed by asmall body candlestick (black or white) that gaps above theprevious. The third is a black body candlestick that closeswell within the large white body. It is considered as areversal signal when it appears at top level.Falling Windowa window (gap) is created when the high of the secondcandlestick is below the low of the preceding candlestick.It is considered that the window should be filled with aprobable resistance.
Complex Candlestick PatternsMorning Doji Starconsists of a large black body candlestick followed by a Dojithat occurred below the preceding candlestick. On thefollowing day, a third white body candlestick is formed thatclosed well into the black body candlestick which appearedbefore the Doji. It is considered as a major reversal signal thatis more bullish than the regular morning star pattern becauseof the existence of the Doji.Morning Starconsists of a large black body candlestick followed by a smallbody (black or white) that occurred below the large black bodycandlestick. On the following day, a third white bodycandlestick is formed that closed well into the black bodycandlestick. It is considered as a major reversal signal when itappears at bottom.On Necklinein a downtrend, consists of a black candlestick followed by asmall body white candlestick with its close near the low of thepreceding black candlestick. It is considered as a bearishpattern when the low of the white candlestick is penetrated.Three Black Crowsconsists of three long black candlesticks with consecutivelylower closes. The closing prices are near to or at their lows.When it appears at top it is considered as a top reversal signal.Three White Soldiersconsists of three long white candlesticks with consecutivelyhigher closes. The closing prices are near to or at their highs.When it appears at bottom it is interpreted as a bottom reversalsignal.Tweezer Bottomsconsists of two or more candlesticks with matching bottoms.The candlesticks may or may not be consecutive and the sizesor the colours can vary. It is considered as a minor reversalsignal that becomes more important when the candlesticksform another pattern.
Complex Candlestick PatternsTweezer Topsconsists of two or more candlesticks with matching tops. Thecandlesticks may or may not be consecutive and the sizes orthe colours can vary. It is considered as a minor reversalsignal that becomes more important when the candlesticksform another pattern.Doji Starconsists of a black or a white candlestick followed by a Dojithat gap above or below these. It is considered as a reversalsignal with confirmation during the next trading day.Piercing Lineconsists of a black candlestick followed by a white candlestickthat opens lower than the low of preceding but closes morethan halfway into black body candlestick. It is considered asreversal signal when it appears at bottom.Rising WindowA window (gap) is created when the low of the secondcandlestick is above the high of the preceding candlestick. Itis considered that the window should provide support to theselling pressure.Judas Candleconsists of a large black candle followed by a smaller whitecandle with a lower tail which is equal to the black candle inlength. This is indicative of price capitulation.Darth Maulthe correct term for this candle is a "high wave spinning top",a small candle body with unusually large upper and lowershadows, suggesting that the prior trend has run into a periodof indecision. The term "Darth Maul" comes from Star Wars,as the candle looks somewhat like a lightsaber.
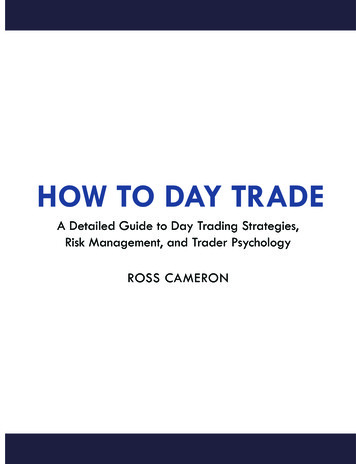
Chart PatternsDouble TopChart by AltafqadirThe double top is a frequent price formation at theend of a bull market. It appears as twoconsecutive peaks of approximately the sameprice on a price-versus-time chart of a market.The two peaks are separated by a minimum inprice, a valley. The price level of this minimum iscalled the neck line of the formation.
The formation is completed and confirmedwhen the price falls below the neck line,indicating that further price decline isimminent or highly likely.The double top pattern shows that demand isoutpacing supply (buyers predominate) up to thefirst top, causing prices to rise. The supplydemand balance then reverses; supply outpacesdemand (sellers predominate), causing prices tofall.After a price valley, buyers again predominateand prices rise. If traders see that prices are notpushing past their level at the first top, sellersmay again prevail, lowering prices and causing adouble top to form. It is generally regarded as abearish signal if prices drop below the neck line.The time between the two peaks is also adetermining factor for the existence of a doubletop pattern. If the tops appear at the same levelbut are very close in time, then the probability ishigh that they are part of the consolidation andthe trend will resume.Volume is another indicator forinterpreting this formation. Price reaches thefirst peak on increased volume then falls down thevalley with low volume. Another attempt on therally up to the second peak should be on a lowervolume.
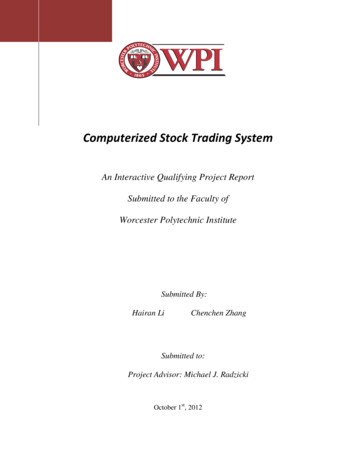
Double BottomChart by AltafqadirA double bottom is the end formation in adeclining market. It is identical to the doubletop, except for the inverse relationship in price.The pattern is formed by two price minima areseparated by local peak defining the neck line.The formation is completed and confirmed whenthe price rises above the neck line, indicatingthat further price rise is imminent orhighly likely.Most of the rules that are associated with doubletop formation also apply to the double bottompattern. Volume should show a marked increaseon the rally up while prices are flat at the secondbottom.
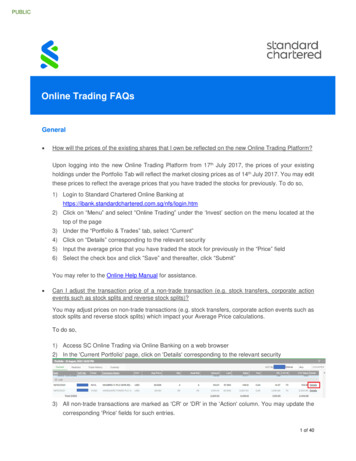
Triple TopChart by AltafqadirThe formation of triple tops is rarer than that ofdouble tops in the rising market trend.The volume is usually low during thesecond rally up and lesser during theformation of the third top.The peaks may not necessarily be spaced evenlylike those which constitute a Double top.The intervening valleys may not bottom out atexactly the same level, i.e. either the first orsecond may be lower. The triple top is confirmedwhen the price decline from the third top fallsbelow the bottom of the lowest valley between thethree peaks.
Head and shoulders TopChart by AltafqadirHead and Shoulders formations consist of a leftshoulder, a head, and a right shoulder anda line drawn as the neckline. The leftshoulder is formed at the end of an extensivemove during which volume is noticeably high.After the peak of the left shoulder is formed, thereis a subsequent reaction and prices slide downsomewhat, generally occurring on low volume.The prices rally up to form the head with normalor heavy volume and subsequent reactiondownward is accompanied with lesser volume.
The right shoulder is formed when prices move upagain but remain below the central peak calledthe Head and fall down nearly equal to the firstvalley between the left shoulder and the head orat least below the peak of the left shoulder.Volume is lesser in the right shoulder formationcompared to the left shoulder and the headformation.A neckline can be drawn across the bottoms of theleft shoulder, the head and the right shoulder.When prices break through this neckline and keepon falling after forming the right shoulder, it isthe ultimate confirmation of the completion of theHead and Shoulders Top formation.It is quite possible that prices pull back to touchthe neckline before continuing their decliningtrend.
Head and shoulders BottomChart by AltafqadirThis formation is simply the inverse of a Head andShoulders Top and often indicates a change in thetrend and market sentiment.The formation is upside down and thevolume pattern is different from a Headand Shoulder Top.
Prices move up from first low with increasevolume up to a level to complete the left shoulderformation and then fall down to a new low.A recovery move follows that is marked bysomewhat more volume than seen before tocomplete the head formation.A corrective reaction on low volume occurs tostart formation of the right shoulder and then asharp move up due to heavier volume againbreaks though the neckline.Another difference between the Head andShoulders Top and Bottom is that the Topformations are completed in a few weeks,whereas a Major Bottom (left, right shoulder orthe head) usually takes longer, and asobserved, may be prolonged for a period ofseveral months or sometimes even more than ayear.
Price and Volume AnalysisWe have talked about price action extensively butcombining it with volume analysis will makeyour trading more reliable.Volume falls on Price SupportPrices should bounce off the trendline (support)when nearing it. Otherwise, the trend may reverseshould it break below the trendline.That’s where volume analysis comes into play - ifthe volume decreases as the price nears thesupport, it might signal weak buying and that thesupport may no longer hold.Image: Trader’s Nest
Volume confirmation on price breakoutA price breakout means that the price isbreaking through a resistance (going up)or a support (going down).Besides identifying the price action, you canfurther validate the breakout by checking thetrading volume - you want the volume to behigher than normal as the breakout happened.Image: Trader’s Nest
ConclusionWe have provided a detailed guide on how totrade price action and we hope that it has givenyou a good starting point, and a few ways to goabout it.Trading price action is an art and really you haveto learn it hands-on to be good at it.If you’re new to trading but want to pocket someprofits while learning, join Alvin at his QualityMomentum Trading webinar to learn more.All the best!
AboutPowered by retail investors who believethat investing can change lives. Andpledges to provide trusted financialeducation to individuals.LEARN MORE
What is Price Action? Price action trading is a style of trading that relies on how the price moves overtime as opposed to market indicators or other technical analysis tools. There are no technical indicators like moving average or RSI. Instead, price action traders use the "historical" price and volume data of a security to determine .