Transcription
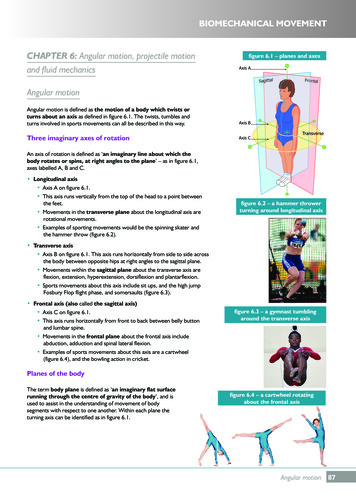
CHAPTER 2MotionWhat You’ll Learn the difference betweendisplacement and distance how to calculate an object’s1 Describing Motion2(D), 4(A), 4(B)Before You Read how to graph motionHave you ever been on a roller coaster? You can feel the steepdrops and quick turns in your body. Write how it feels to travel upa steep hill slowly and then to go down the other side quickly.FocusRead to LearnHighlight the main point in eachparagraph in this section.Highlight in a different color adetail or example that helpsexplain a point.Motion and PositionspeedHow are motion and position related?Find Main Ideas Make athree-tab book. Label it asshown. Use it to organizeyour notes about motion.DisplacementVelocityMotionAccelerationYou don’t need to see something move to know that it hasmoved. Suppose you see a mail truck stopped next to a mailbox.When you look again later, the truck is farther down the street bya tree. You didn’t see the truck move, but you know that motionhas taken place because of the truck’s new position.What is a reference point?A reference point is needed to determine the position of anobject. Motion occurs when an object goes from one referencepoint to another. In the example above, the mailbox was the firstreference point for the mail truck. The tree was the secondreference point.After a reference point is chosen, a frame of reference can becreated. A frame of reference is a coordinate system in which theposition of the objects is measured. A coordinate system is like amap. The reference point is at the origin and each object’sposition can be described with its coordinates.Reading Essentials Motion26Copyright McGraw-Hill Education. Permission is granted to reproduce for classroom use.Distance and time are important in describing a race. Thewinner covers the distance in the shortest amount of time. It takesmore time to run a 10-km race than to run a 5-km race because10-km is a longer distance.
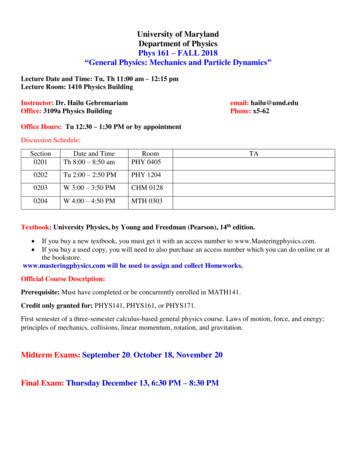
Change in PositionCopyright McGraw-Hill Education. Permission is granted to reproduce for classroom use.SpeedSo far, motion has been described by the distance somethinghas moved and by displacement from the starting point. Youmight also want to tell how fast something is moving. To do this,you need to know how far it travels in a certain amount of time.Speed is the distance an object travels per unit of time.How is speed calculated?40 m50 mFINISHS TA R TDistance is how far something has moved. It is important indescribing motion. In the 50-m dash, a runner travels 50 mbetween the start line and the finish line. The distance is 50 m.The SI unit of length or distance is the meter (m). Longdistances are measured in kilometers (km). One kilometer isequal to 1,000 meters. Short distances are measured incentimeters (cm). One meter is equal to 100 centimeters.Not all motion is in a straight line. In the figure, the runnerjogged 50 m to the east.N 0m10 m20 m30 mThen she turned aroundand jogged 30 m to the20 m30 mwest. The total distanceshe jogged is 80 m. She is20 m from the startingpoint. Displacement isthe distance and50 mdirection of an object’sposition relative to thestarting point. Therunner’s displacement is 20 m east.Take a Look1. Describe another waya runner could have adisplacement of 20 m east.Apply MathThe SI unit of distance is the meter (m). The SI unit of timeis the second (s). So, in SI, speed is measured in meters persecond (m/s). Sometimes it is easier to express speed in otherunits so that the numbers will not be very large or very small.Something that moves very quickly, such as a rocket, can bemeasured in kilometers per second (km/s). Very low speeds, suchas geological plate movements, can be measured in centimetersper year (cm/y).To calculate the speed of an object, divide the distance ittraveled by the time it took to travel the distance. Here is aformula for calculating speed.distance (in meters)dspeed (in meters/second) , s ttime (in seconds)Reading Essentials Motion272. Calculate A train traveling ata constant speed covers adistance of 960 meters in30 s. What is the train’sspeed? Show your work.
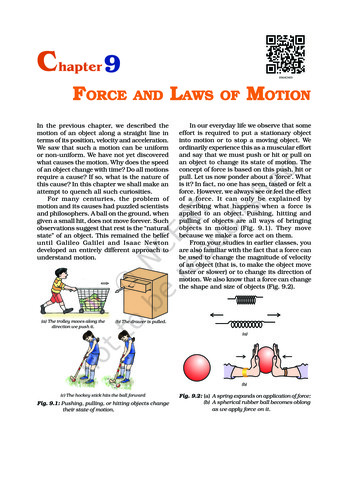
What is motion with constant speed?A speedometer measures the speed of a car. Suppose you lookat the speedometer when you are riding on a freeway. The car’sspeed hardly changes. If the car is not speeding up or slowingdown, it is moving at a constant speed. If you are traveling at aconstant speed, you can measure your speed over any distancefrom millimeters to light years.What is changing speed?Take a Look3. Describe what is happeningwhen the line on the graph ishorizontal.Usually, speed is not constant. The graph below shows how thespeed of a cyclist changes during a 5-km ride. Follow the graph asthe ride is described. As the cyclist starts off, his speed increasesfrom 0 km/h to 20 km/h. Then he comes to a steep hill. He slowsdown to 10 km/h as he pedals up the hill. He speeds up to 30 km/hgoing down the other side of the hill. At the bottom, he stops for ared light. He speeds up when the light turns green. At the end ofthe ride, he slows down and then stops. The ride took 15 min.Speed (km/h)Speed Changing over Distance30Going downhill25Climbingsteep hillStopping forred light2015Constant speed10512345Distance (km)Apply Math4. Find the average speed inkilometers per hour of a racecar that travels 260 km in 2 h.260s 2s km/hWhat is average speed?Look at the graph of speed for the bicycle trip. Sometimes thebicycle was moving fast, sometimes it was moving slowly, andsometimes it was stopped. How could you describe the speed ofthe whole ride? Would you use the fastest speed or the slowest?Average speed describes the speed of motion when speed ischanging. Average speed is the total distance traveled divided bythe total time of travel. It is calculated using the relationshipsamong speed, distance, and time.The total distance the cyclist traveled was 5 km. The total timewas 15 minutes, or 14 h. You can write 14 h as 0.25 h. The averagespeed for the bicycle trip can be found using a mathematicalequation.total distance 5 km 20 km/haverage speed total time0.25 hReading Essentials Motion28Copyright McGraw-Hill Education. Permission is granted to reproduce for classroom use.0Gainingspeed
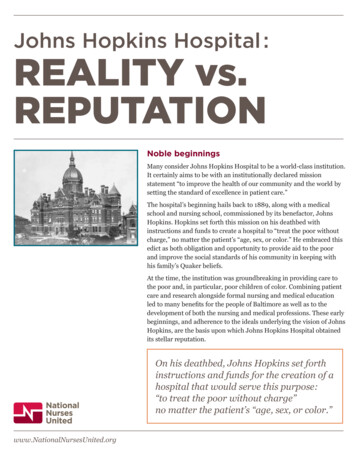
What is instantaneous speed?The speed shown on a car’s speedometer is the speed atone point in time, or one instant. Instantaneous speed is thespeed at one point in time. If an object is moving with constantspeed, the instantaneous speed doesn’t change. The speed is thesame at every point in time. However, when a car speeds up orslows down, its instantaneous speed is changing. The speed isdifferent at every point in time.A distance-time graph shows the motion of an object over time.The graph below shows the motion of three toy cars movingacross a lab floor. Time is plotted along the horizontal axis of thegraph. The distance traveled is plotted along the vertical axis ofthe graph.If an object moves with constant speed, the increase in distanceover equal time intervals is the same. This results in a straight lineon a distance-time graph. Look at the graph below. The straightred line represents the motion of the red car. The red car traveledat a constant speed of 1 m/s.The blue line is also straight. This means that the blue car wasalso moving at a constant speed. The red and blue lines aredifferent because the red and blue cars were moving at differentspeeds. The blue car had a slower speed than the red car. It movedat 0.75 m/s. The steepness of a line on a graph is the line’s slope.The slope of a line on a distance-time graph equals the object’sspeed. The steeper the line, the faster the speed.Distance-Time GraphRed car1210Blue carDistance (m)Copyright McGraw-Hill Education. Permission is granted to reproduce for classroom use.Graphing Motions 1 m/s8s 0.75 m/s64Green cars 0 m/ss 1 m/s20s 0.5 m/s024681012Time (s)Reading Essentials Motion29GET IT?5. Identify two examples ofmotion in which an object’sinstantaneous speedchanges.Apply Math6. Explain why the slopes aredifferent for each car.
How is changing speed graphed?Think it Over7. Recall The vertical axis iscalled the y-axis. What is thehorizontal axis called?Look back at the graph of the three cars. Unlike the other lines,the line for the green car is not straight. The green car traveled ata constant speed of 0.5 m/s for 4 seconds. Then, the green carstopped for 4 seconds. After that, the green car moved at aconstant speed of 1 m/s for 4 seconds.When the green car was stopped, its line is horizontal.A horizontal line on a distance-time graph has a zero slope.A zero slope means the object has a speed of 0 m/s.How do you draw a distance-time graph?A distance-time graph plots data for distance and time. Thedistance traveled is plotted on the vertical axis. Time is plotted onthe horizontal axis. Each axis has a scale, or a series of numbers,that covers the range of the data.The data for the toy cars’ movements were recorded for12 seconds. The time scale for the graph must range from0 to 12 s. The red car traveled the farthest. Since the red cartraveled 12 meters, the distance scale must range from 0 to 12 m.Both the x-axis and the y-axis must be divided into equalintervals. Then, the data points are plotted on the graph. Finally,lines are drawn to connect the points.What is a coordinate system?How can you use coordinates anddisplacement?Suppose you want to travel by bus from city A to city B on themap. City A is your starting point and City B is where you want toend up. In other words, City B is the displacement of the bus. Thecoordinate system of the map tells you what direction and howgreat the displacement of the bus needs to be to reach city B.Reading Essentials Motion30Copyright McGraw-Hill Education. Permission is granted to reproduce for classroom use.When you use a map to locate a small town in a different state,you may not know where to look at first unless you have someadditional information. Maps are set up with coordinate systemsand an index of the towns on the map. Suppose you look up thetown and next to it is the notation L6. You look on the map andsee that along the top of the map are the letters of the alphabet.Along the side of the map are numbers. Using the L6 informationyou follow the imaginary line that passes through L down themap until it crosses the imaginary line running across the mapfrom 6. Close to the point where they cross you should see thetown.
After You ReadMini Glossaryaverage speed: the total distance traveled in a unit of timedisplacement: the distance and direction that something movedfrom a starting pointdistance: a measure of how far an object has movedinstantaneous speed: the speed of an object at a one point intimespeed: the distance an object travels in an amount of timeReview1. Use the data below to make a distance-time graph. Be sure to include labelsand scales.Copyright McGraw-Hill Education. Permission is granted to reproduce for classroom use.Bike RideTime (min)Distance (m)15150303004545060600Reading Essentials Motion31
A speedometer measures the speed of a car. Suppose you look at the speedometer when you are riding on a freeway. The car's speed hardly changes. If the car is not speeding up or slowing down, it is moving at a constant speed. If you are traveling at a constant speed, you can measure your speed over any distance from millimeters to light years.