Transcription
The Journal of Wildlife Management 82(4):711–722; 2018; DOI: 10.1002/jwmg.21419Research ArticleWolf-Livestock Conflict and the Effects ofWolf ManagementNICHOLAS. J. DECESARE,1 Montana Fish, Wildlife & Parks, Missoula, MT 59804, USASETH M. WILSON, Northern Rockies Conservation Cooperative, Missoula, MT 59801, USAELIZABETH H. BRADLEY, Montana Fish, Wildlife & Parks, Missoula, MT 59804, USAJUSTIN A. GUDE, Montana Fish, Wildlife & Parks, Helena, MT 59620, USAROBERT M. INMAN, Montana Fish, Wildlife & Parks, Helena, MT 59620, USANATHAN J. LANCE, Montana Fish, Wildlife & Parks, Butte, MT 59701, USAKENT LAUDON,2 Montana Fish, Wildlife & Parks, Kalispell, MT 59901, USAABIGAIL A. NELSON, Montana Fish, Wildlife & Parks, Livingston, MT 59047, USAMICHAEL S. ROSS, Montana Fish, Wildlife & Parks, Bozeman, MT 59718, USATY D. SMUCKER, Montana Fish, Wildlife & Parks, Great Falls, MT 59405, USAABSTRACT Wolf (Canis lupus) depredations of livestock are a ubiquitous source of conflict in every countrywhere wolves and livestock overlap. We studied the spatial and temporal variation of wolf depredations oflivestock in Montana during 2005–2015, including evaluations of targeted control efforts and public harvestas potential means to reduce depredations. During this time we collected spatial data for all confirmed wolflivestock depredations, tallied the annual number of depredation events within hunting districts, andcollected data for variables potentially predictive of depredation events. We decomposed variation indepredation data into 2 distinct components: the binary presence or absence of depredation events in eachdistrict-year, and the count of depredation events in district-years with 1 event. We found that presenceabsence of depredations increased with wolf presence and wolf density, increased with livestock density, werehighest at intermediate proportionate areas of agricultural land, and were a recurrent phenomenon such thatdistricts with depredations the previous year were more likely to continue having them. Targeted removal,but not public harvest, significantly reduced the recurrent presence of depredations. The number of conflictsin district-years with 1 depredation event was positively correlated with wolf density, cattle density,intermediate proportionate areas of forested land, and the number of events during the previous year. Publicharvest reduced the counts of depredation events in areas where conflict reoccurred, though with a modestpredicted effect size of 0.22 fewer depredations/district-year, or 5.7 fewer depredation events statewide/year(8% of the annual average). Minimizing livestock losses is a top priority for wolf management. These resultsshed light on the broad-scale patterns behind chronic problems and the effectiveness of wolf managementpractices in addressing them. Ó 2018 The Wildlife Society.KEY WORDS Canis lupus, cattle, harvest, human-wildlife conflict, hunting, lethal control, livestock depredation,wolves.Wolf (Canis lupus) depredations of livestock are a ubiquitoussource of conflict in every country where wolves and livestockoverlap (Fritts et al. 2003). Eliminating depredation was aprimary reason behind historical efforts to exterminatewolves, and their subsequent recovery in portions of NorthAmerica and Europe has brought familiar challenges ofReceived: 21 March 2017; Accepted: 12 December 20171E-mail: ndecesare@mt.govPresent Address: California Department of Fish and Wildlife,Redding, CA 96001, USA.2DeCesare et al. Wolf-Livestock Conflictunderstanding, reducing, and mitigating conflicts withlivestock (Bangs et al. 2009, Boitani and Ciucci 2009).Wolf-livestock conflicts, in particular, can be difficult toexplain or predict with statistical approaches relative to otherforms of human-wildlife interactions (Mabille et al. 2015), yetsome consistent patterns have emerged. The risk of livestockdepredation has increased in areas with greater numbers ofboth wolves and livestock and with higher spatial overlapamong them (Bradley and Pletscher 2005, Gula 2008,Kaartinen et al. 2009, Treves et al. 2011). Depredationshave been positively associated with particular land cover types,including forested or agricultural vegetation or a mix of both(Bradley and Pletscher 2005, Kaartinen et al. 2009). Densities711
of wild ungulate prey have been linked to wolf-livestockconflicts in some regions, though results have included positive(Bradley and Pletscher 2005, Imbert et al. 2016, Nelson et al.2016) and negative (Gula 2008, Kaartinen et al. 2009)correlations. Studies of temporal patterns of wolf-livestockconflict have shown strong seasonality, with monthlydepredation totals peaking during late summer in NorthAmerican and European study areas (Ciucci and Boitani 1998,Harper et al. 2008, Bradley et al. 2015). Also apparent fromprevious studies is a predictable pattern of recurrence ofdepredations in areas with prior conflicts (Karlsson andJohansson 2010, Bradley et al. 2015).Efforts to reduce the occurrence of carnivore depredationsof livestock have included 2 suites of widely applied tools:non-lethal deterrents such as visual or auditory deterrents,barriers, enclosures, or guardian animals, and lethal removalof carnivores, including targeted removal following depredation events and non-targeted reduction of populationsthrough public harvest (Miller et al. 2016). Studies oftargeted lethal control have been controversial regarding itseffectiveness for reducing depredations by wolves (Harperet al. 2008, Wielgus and Peebles 2014, Poudyal et al. 2016,Treves et al. 2016, Kompaniyets and Evans 2017). Detailedassessments accounting for the autocorrelated nature ofdepredations have typically shown a significant effect oftargeted removals in reducing future depredations by wolves(Harper et al. 2008, Bradley et al. 2015, Poudyal et al. 2016).Little is known about the effects of public harvest on wolflivestock conflicts, though studies in other carnivorelivestock systems suggest a range of possible outcomes(Treves 2009, Treves et al. 2016). Harvest can reduce sheepdepredations by Eurasian lynx (Lynx lynx) primarily byreducing the overall abundance of lynx at broad spatial scales(Herfindal et al. 2005). To the contrary, hunter harvest ofblack bears (Ursus americanus) does not affect numbers ofnuisance bear complaints (Treves et al. 2010) or bear-relateddepredation costs (Huygens et al. 2004). Regulated publichunter harvest of wolves began in portions of the westernUnited States in 2009. Although harvest in this regionsignificantly affects population dynamics of wolves (Gudeet al. 2012, Ausband et al. 2015), it is unclear whether theseeffects or other behavior-mediated effects of harvest (Imbertet al. 2016) translate to changes in the rates at which the wolfpopulation depredates livestock.Efforts to reduce wolf-livestock conflicts in Montana haveincluded a host of non-lethal practices implemented cooperatively by individual livestock producers, non-governmentalorganizations, and public agency staff (e.g., Wilson et al.2017). Management to reduce conflicts also has includedlethal removal of wolves by public agencies, permittedlandowner take, and most recently public harvest, beginningin 2009 (Bradley et al. 2015). Despite these practices,depredations negatively affect some livestock producers, andthe economic effects of these are partially mitigatedthrough compensation programs. In Montana, financialreimbursements of 300,000 were paid during 1987–2008for confirmed wolf-caused livestock depredations by a privatefund administered by a non-government organization (i.e.,712Defenders of Wildlife; K. Paul, Defenders of Wildlife,unpublished data). Since 2008, compensation payments andfunding for prevention efforts have been administeredby the Montana Livestock Loss Board (MLLB), a statelegislature-created panel of governor-appointed members.Payments for confirmed livestock losses to wolves from theMLLB have averaged 96,245/year to producers withinMontana during 2009–2015 (G. Edwards, MLLB, unpublished data).Minimizing and mitigating livestock depredations are keypriorities for wolf management and conservation inMontana and other jurisdictions, and future managementwill benefit from continued reassessment of and subsequentimprovements to actions geared to minimize conflicts. Ourobjective was to summarize the spatial and temporalpatterns of wolf-livestock conflict over the past decadewithin Montana and evaluate the influence of hypothesizedpredictors of conflict in local areas. We hypothesized thatspatio-temporal factors influencing conflict in Montanaduring this period would be like those reported in previousstudies, and we included a novel assessment of publicharvest as a potential management strategy for reducingconflict.STUDY AREAOur study was in Montana, USA during 2005–2015.Montana is 380,832 km2 in area and ranges in elevation from555–3,904 m. The western portion of the state consistspredominately of a portion of the Rocky Mountains, whereasthe eastern portion includes large expanses of prairiebadlands and prairie-agricultural lands mixed with timberedriver drainages and island mountain ranges. January temperatures average 128 to 68C and July temperatures average188 to 238C. Precipitation varies widely depending on locationand elevation, with average annual precipitation ranging from17–88 cm/year. Most wolves and wolf-livestock conflicts occurin western Montana, where land cover includes a mix ofconiferous forest-dominated mountains separated by largevalleys containing grassland, rangeland, or agriculturalvegetation types. Major wild prey species for wolves inMontana include elk (Cervus canadensis), deer (Odocoileusspp.), moose (Alces alces), and other species.METHODSConfirmed Wolf-Livestock DepredationsWe briefly reviewed the time series of depredation eventsduring 1985–2015 but restricted our spatio-temporalsummaries and analyses to 2005–2015 to focus oncontemporary patterns. We recorded depredations oflivestock by wolves as events, such that the injuring orkilling of 1 livestock at a given place and time was 1 event.The United States Department of Agriculture WildlifeServices staff confirmed depredation events followingstandardized protocols (Roy and Dorrance 1976). Thenumber of depredation events and the number of livestockinjured or killed per event represented minimum numbers ofactual livestock loss given the occurrence of additional,The Journal of Wildlife Management 82(4)
unconfirmed depredations (Oakleaf et al. 2003). Werestricted our analyses solely to confirmed events, andremoved events from the data that included only animalsdeemed to be probable or possible cases of wolf-caused injuryor mortality (3.6% of events).Overall, 786 confirmed depredation events occurred during2005–2015. To study spatial and temporal patterns ofdepredations at broad scales, we treated administrativehunting districts (districts) as polygonal sample units andassigned each depredation to 1 of 162 districts across thestate. Sufficient spatial information (e.g., recording of spatialcoordinates or district) were available to assign 760 (97%) ofthe 786 depredations to a specific district. We then countedthe number of depredation events occurring within eachdistrict for each calendar year. District boundaries followedtopographic and anthropogenic features, which led tovariable sizes with a median area of 1,280 km2 ( x ¼ 2,198 2,779 [SD]; range ¼ 44–18,688). To control for theinfluence of differences in area among districts whencounting depredation events, we calculated standardizedcounts by adjusting counts according to the relative area ofdistricts. We adjusted the raw counts (xraw) to standardizedcounts (xadj) for each hunting district (i) relative to themedian district area by multiplying them by an adjustmentfactor (ai) where,ai ¼areai; andareamedianxadj;i ¼ xraw;i ai :ð1ÞWe used the median district area instead of the meanbecause the distribution of district areas is right-skewed byrelatively few large-area districts in the eastern portion of thestate.Potential Explanatory VariablesWolf abundance, removals, and harvest.—We tallied thenumbers of wolves and packs within each district at theend of each calendar year, and used values at the end of agiven year to predict the subsequent year’s depredationresponses. Thus, for the 2005–2015 study of depredations, we counted wolves at the end of each year during2004–2014. We monitored the number of wolves andwolf packs (defined as groups of 2 wolves withestablished territories) statewide using a combinationof capture and radio-telemetry, direct observationalcounts, howling and snow-track surveys, remote cameras,and public wolf reports (Coltrane et al. 2016). Each yearwe sought to document pack size, determine packterritories, and verify wolf activity in new areas, indicatingnew packs. Counts of wolves were minimum counts andnot population estimates (Coltrane et al. 2016). Theseefforts resulted in the documentation of 1,071 pack-yearsand 5,170 wolf-years across the state during the studyperiod. We captured and handled wolves in accordancewith Montana Fish, Wildlife and Parks’ (MFWP)biomedical protocol for free-ranging wolves, which hasbeen approved by the MFWP animal care and usecommittee (MFWP 2005).DeCesare et al. Wolf-Livestock ConflictWe estimated spatial locations of packs using minimumconvex polygon home range estimates from very highfrequency (VHF) and global positioning system (GPS)based radio-telemetry (39% of pack-years) and using surveyand observational data to estimate the centroids of packhome ranges (61% of pack-years), which we then buffered tobe circular home ranges equal in area to the statewide averagehome range size of 599.8 km2 (Rich et al. 2012, Coltraneet al. 2016). We then estimated the annual numbers ofwolves and packs within each district by summing pack homeranges and pack sizes contained within districts. When homeranges spanned multiple districts, we assigned counts ofpacks and wolves proportionately to each overlapping districtaccording to the proportion of the home range areacontained by each. To account for the differences in areaamong districts when monitoring wolves, we converted totalcounts of packs and wolves to densities of each per 1,000 km2by dividing the total counts by the district area (in thousandsof km2).The numbers of wolves killed through targeted lethalremovals and public harvest were also reported annuallyduring the study period and tallied annually for each district.The United States Department of Agriculture—WildlifeServices (USDA-WS) conducted targeted removal effortsand methods included trapping and shooting from theground or aircraft. We used pack identification informationfrom each targeted removal to assign removals to huntingdistricts according to the district(s) overlapped by the packs’home range. Targeted removals were conducted by USDAWS under statutory authority according to the AnimalDamage Control Act of 1931 and in cooperation withthe Montana Department of Livestock under statutoryauthority according to MCA 81-7-102. During the 2009 and2011–2015 public wolf hunting and trapping seasons(there was no such season in 2010), MFWP monitoredwolf harvest using a mandatory reporting requirement forall wolves harvested by hunters and trappers. Only huntingwas allowed during the 2009 and 2011 seasons, and huntingand trapping were allowed during 2012–2015. Public harvestof wolves was regulated under the auspices of legal huntingand trapping seasons defined by the Montana Fish &Wildlife Commission, under the authority granted to themin statute MCA 87-1-301. Reporting requirements includeda legal description (i.e., township, range, section) of theharvest location, which allowed us to spatially assign eachharvested wolf to a district. Harvest totals were 72 wolvesduring the 2009–2010 season, 166 during the 2011–2012season, 225 during the 2012–2013 season, 230 during the2013–2014 season, and 207 during the 2014–2015 season,and location descriptions were available for 97% of wolvesharvested. To account for the differences in area amongdistricts when monitoring wolf mortality, we converted totalcounts of removals and harvest per district to densities ofeach per 1,000 km2 by dividing the counts by the district area(in thousands of km2). Like our treatment of pack and wolfdensities, we tested the densities of removals and harvest for agiven calendar year on the subsequent years’ variation indepredation events.713
Agricultural land cover and livestock density.—We estimatedthe proportionate area of rural agricultural land (includingirrigated and non-irrigated grazing lands) within eachdistrict using property type attributes of each private landparcel provided by the Montana Cadastral Mapping Projectof the Montana State Library (Montana State Library 2015).We then estimated the proportionate area of forested landwithin each district using Montana Land Cover Frameworkdata from the Montana Natural Heritage Program(Montana Natural Heritage Program 2013).We obtained annual head counts per county during2004–2015 for livestock (cattle and domestic sheep) inMontana from the United States Department of Agriculture National Agricultural Statistics Service (USDANASS 2015). We estimated the proportion of agriculturalland within each county that was contained within eachhunting district and used these values to divide the totalnumbers of livestock per county among overlappinghunting districts. Lastly, we estimated the density ofcattle, sheep, and livestock (cattle and sheep) per huntingdistrict in 2 ways: density per area as head count divided bydistrict area, and density per agricultural area as the headcount divided by area of agricultural land per district. Weconducted all spatial analyses using ArcGIS 10.1 (ESRI,Redlands, CA, USA).Statistical Modeling of Spatial and Temporal Patterns inWolf-Livestock DepredationsWe used descriptive statistics and maps to summarizepatterns of livestock depredations across the state and overtime. These included characterizations of the annualnumbers of depredation events over time, number ofindividual livestock killed per event, and spatial patternsof depredation events per unit area. We assessed spatialvariation among districts first in terms of the proportion ofyears during which 1 depredation occurred within eachdistrict. This characterized the degree to which depredationswere a chronic problem within a district. We also evaluatedthe average annual count of depredations within each districtto characterize the within-year frequency at which depredations occurred. We then used statistical modeling to ask 3questions about variation in depredation events over spaceand time.Presence-absence versus number of depredations.—Our firstquestion was if annual variation in the statewide number ofdepredation events was influenced by changes in thepresence–absence of depredations among varying numbersof districts or by changes in the number of depredations perdistrict in areas where they occur. In other words, was a yearwith high overall depredations characterized by numerousplaces with conflict, or instead by higher numbers ofconflicts in the same typical places? During subsequentanalyses (questions 2 and 3), we sought to understand thefactors influencing each of these 2 processes. Initially askingabout the relative contribution of each process to thestatewide totals established a basis for us to interpret howmuch emphasis should be placed on the factors influencingeach process.714To address our first question, our response variable was theannual count of depredation events statewide, during 2005–2015 (n ¼ 11 annual counts). We used multiple linearregression to regress the extent to which 1) the annualnumber of districts with 1 depredation event and 2) theaverage number of depredation events per district with 1explained variation in the overall statewide total. We thenused estimates of the average semi-partial correlations ofeach component to assess how much of the total variance wasexplained by each (Kim 2015).Factors affecting presence-absence and number of depredations.—To study the spatial and temporal factors influencingdepredations across Montana during 2005–2015, wefollowed a form of hurdle modeling wherein we distinctlymodeled covariates of the presence-absence of depredationsin a given district-year (question 2) and the count ofdepredations in a district-year given 1 event (question 3;Bolker et al. 2012). The approach is called hurdle modelingbecause the user first models what variables describe thelikelihood of clearing a hurdle, in this case having 1depredation. Then, among those districts with 1 depredation,a second model is fit to describe the relative frequency, in termsof the count of depredation events per year. In a framework ofgeneralized linear mixed-effects models (GLMMs), we usedlogistic regression to develop binary models of the initialpresence of depredations (zero vs. non-zero) and a truncatednegative binomial regression to develop count models for thesubsequent number of depredations when present. Preliminarycomparisons among Poisson, negative binomial (NB), andtruncated negative binomial distributions (with NB1 and NB2variance parameterizations; Bolker et al. 2012) concluded thelatter with an NB1 variance parameterization best fit the datafor counts of depredations. We screened sets of predictorvariables included in multivariable models to avoid havingcorrelated (r 0.6) variables together within models, and wechecked models for error inflation or coefficient changes due tomulticollinearity. We conducted all statistical analyses usingProgram R, version 3.1.1 (R Core Team 2014), and thepackages ppcor version 1.1 (Kim 2015) and glmmADMBversion 0.8.3.2 (Bolker et al. 2012).We developed models assessing patterns of variation inpresence and count of depredations over space (amongdistricts within a given year) and over time (among yearswithin a given district). We treated each district-year as asample unit and included a random intercept for year to treateach year as a new trial comparing variation among districts.This approach parameterized a spatial comparison ofvariation in depredations among districts within each yearand with respect to spatially varying covariates concerningwolf and livestock densities and land cover types measuredper district. In addition to measuring the effect of wolfdensity, we also included a binary covariate for the presenceor absence of wolves, as determined at the end of the previousyear. We recognize that the presence of wolves is an innatecomponent of a depredation event in real-time, yet ourminimum count data instead represented an imperfectdepiction (including false negatives) of wolf presence duringthe prior year. We used this covariate to control for spatialThe Journal of Wildlife Management 82(4)
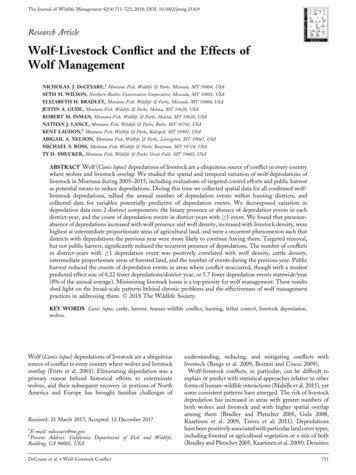
variance in the annual statewide presence of wolves whiletesting for the effects of other covariates on spatial variance inlivestock depredations.To additionally study the temporal rate of change indepredations within a given district over the 11 years ofstudy, we also included a covariate characterizing thepresence or count of depredations in the previous year.This approach tested whether depredations were a temporally autocorrelated phenomenon, such that the presence ornumber of depredations in any one year could be predicted bythat of the previous year. We then included additionalvariables that interacted with the previous year’s presence orcount, which allowed us to test whether other variables suchas targeted removals or public harvest had any effect on therecurrence of depredations over time.We used Akaike’s Information Criterion (AIC) to evaluatethe relative support for both binary and count models, andconducted comparisons among models in batches using a mixof a priori groupings of candidate models and manualforward stepping comparisons (Arnold 2010). We firstevaluated different covariates characterizing wolf populations in each district, including wolf presence, pack density,and wolf density. Upon selecting a best model with thelowest AIC from this suite of variables, we then evaluatednew models including suites of candidate variables characterizing livestock densities. We next evaluated modelsincluding land cover variables, using quadratic terms toaccommodate non-linear relationships. Next, we tested fortemporal autocorrelation by adding to the model a variablecharacterizing the previous years’ presence-absence or countof depredations within each district. This evaluated whetherpatterns of the previous year were predictive of the currentyear, which would imply temporal autocorrelation. We thentested interactions of public harvest and targeted removalswith this autocorrelation parameter to assess whether harvestor removals had any effect on the trend in depredations fromyear to year within a given district. We tested the binarypresence-absence of any level of harvest or removals and thenumber and proportion of wolves harvested or removedwithin each district. When evaluating the effects of publicharvest, we restricted analyses to a subset of depredation dataduring years that followed harvest (2010, 2012–2015). Inusing AIC to evaluate model support, we followedrecommendations of Arnold (2010), which included usingadditional information (e.g., values of b/SE) to identify andremove models with non-informative parameters whencomparing nested models.RESULTSDescriptive Statistics and Maps of Wolf-LivestockDepredationsWith natural recolonization of wolves into northwestMontana came an initially small number of livestockdepredation events, ranging from 0 to 5 annually during1987–1995 (Fig. 1a). Following the 1995 reintroductions ofwolves into Yellowstone National Park and central Idaho,USA annual numbers of wolves and depredations inDeCesare et al. Wolf-Livestock ConflictFigure 1. Annual numbers of a) confirmed livestock depredations by wolvesand minimum wolf counts and b) depredations per known wolf and packstatewide, Montana, USA, 1985–2015.Montana rose gradually, from 15 confirmed depredationsin 1996 to a peak of 117 in 2010. However, as the minimumpopulation counts for wolves leveled off during 2011–2015,numbers of depredation events showed a disproportionatedecline. For comparison, annual per capita depredationevents during 1995–2010 appeared relatively stable, averaging 0.20 0.08 events/wolf, but decreased during thesubsequent 5 years, averaging 0.10 0.02 events/wolf(Fig. 1b).During our 2005–2015 study period, there were 786confirmed depredation events of livestock, 80% of whichwere attacks on cattle, 15% on sheep, and 5% on otherdomestic animals including (in order of abundance) horses,llamas, and goats. We excluded 26 additional events duringwhich dogs were killed or injured without harm to livestockfrom these analyses. Among confirmed cattle depredationevents, 13% involved injury to livestock but no deaths, 74%were lethal to a single animal, and 12% were lethal to morethan one animal; the mean deaths per event involving cattlewas 1.03 animals (median ¼ 1, SD ¼ 0.66, range ¼ 0–6).Among sheep depredation events, 1% involved injury tolivestock but no deaths, 33% were lethal to a single animal,and 66% were lethal to more than one animal; the meandeaths per event involving sheep was 5.03 animals (median¼ 2, SD ¼ 8.49, range ¼ 0–82). Depredation events occurredprimarily on private land (83%) but also on public (14%) andtribal lands (3%).Comparison of the cumulative proportion of statewidedepredations with cumulative area covered by districts715
showed a notable concentration of events in relatively fewdistricts. For example, 95% of depredation events occurred in22% of the state. Spatial display of the proportionatepresence of livestock depredation events across the 11-yearperiod revealed several regions of Montana where depredations were chronic (Fig. 2a). After adjusting counts ofdepredation events for each district to be relative to themedian district area (eq. 1), 16% of district-years included 1 depredation event. For those districts with 1 eventduring the 11-year study period, there was on average anevent in 35% of years, and the maximum was 100% of years(11 of 11 years), which occurred in 2 districts. Amongdistricts with 1 depredation event, the raw number ofevents for a given district-year varied from 1–19, thoughadjusting these data to a standardized median area resulted inan adjusted range of 1–21 depredation events/district-year.Average annual numbers of depredation events followed asimilar spatial pattern to their proportionate presence(Fig. 2b).Statewide Annual Depredation TotalsThe annual totals of wolf-livestock conflicts mathematicallyreflect changes in both the number of districts withdepredations and the number of depredations per districtin affected districts. Multiple linear regression analysis of theaverage semi-partial correlations for each componentindicated that approximately 48% of the variation wasinfluenced by changes in the number (or proportion) ofdistricts with depredations, whereas 51% of the variation wasinfluenced by variation in the average number of depredations per district when and where they occurred (Fig. 3).This result establishes the equal importance of understanding the factors influencing the presence-absence of depredations and the number of depredations where and whenpresent.Figure 2. Spatial variation in wolf-livestock conflicts as measured by a) percent of years with 1 confirmed depredation event and b) average annual count ofdepredation events, each standardized by the area of each district relative to the median area of 1,280 km2, Montana, USA, 2005–2015.716The Journal of Wildlife Management 82(4)
Figure 3. Linear regression showing positive relationships between the statewide annual total of wolf-livestock depredation events (y-axis) and annualvariations in a) the number of districts with depredations and b) the
Defenders of Wildlife; K. Paul, Defenders of Wildlife, unpublished data).Since 2008,compensationpaymentsand funding for prevention efforts have been administered by the Montana Livestock Loss Board (MLLB), a state legislature-created panel of governor-appointed members. Payments for confirmed livestock losses to wolves from the