Transcription
Report onthe Comprehensive Trade Costs ofLao People’s Democratic Republic130 June 2012A report prepared with the support of1This report was prepared under the overall guidance of Dr. Ravi Ratnayake, Director, Trade andInvestment Division (TID), United Nations Economic and Social Commission for Asia and the Pacific(ESCAP) by Yann Duval, Acting Chief, Trade Facilitation Section, TID and Chorthip Utoktham,Consultant, ESCAP. Any questions and enquiries regarding this report may be addressed to Dr. YannDuval (duvaly@un.org; tel: 66-2 288 2252). The views expressed in this report are those of the authorsand do not necessarily reflect the views and policies of ESCAP and the United Nations. This document hasnot been formally edited and any errors are the responsibility of the authors.1
ContentsI. Introduction . 3II. Understanding Comprehensive Trade Costs: Further Elaboration . 4III. Lao PDR Comprehensive Trade Costs (excluding tariff). 5Lao PDR Trade Costs: An Overview. 5Progress made since 2000. 7IV. Reducing Comprehensive Trade Costs: Other Indicators of Lao PDR Performanceand Implications. 9a) Maritime Connectivity/Services . 10b) Business (Regulatory) Environment. 12c) Availability/Use of ICT Services. 13d) Direct Behind- and at-the-Border Trade Costs. 14e) Other Trade Costs . 15V. Conclusion and Way Forward. 16Bibliography . 18Annex I: Explanatory Note for Users . 19I. Comprehensive Trade Cost: Definition and Basic Data Interpretation andTransformation. 19II. Underlying Methodology and Data Sources for Trade Cost Calculation . 22Annex II: Examples of Business Process Analysis Outputs. 26List of TablesTable 1. Trade Costs (NT-CTC) of Selected Economies with Each Other, 2008-2010. 6Table 2. Reduction in Lao PDR trade costs (NT-CTC). 8Table 3. Ease of Doing Business: Trading across Border . 15Table 4. Time to Export and Import Goods. 16List of FiguresFigure 1. Bilateral Comprehensive Trade Costs (excluding Tariff) of Lao PDR. 5Figure 2. Contribution of Various Policy-Related Factors on Changes in Trade Costs . 9Figure 3. Liner Shipping Connectivity Index (LSCI), 2011. 11Figure 4. Logistics Performance Index (LPI), 2011 . 11Figure 5. Ease of Doing Business (EDB), Investor Protection, Credit Information andContract Enforcement: 2011 Ranking . 13Figure 6. Information and Communication Technology Usage in India and MekongCountries (Internet users per 100 people; 2005 and 2010) . 142
I. IntroductionInternational trade continues to be a primary engine of growth and development for mosteconomies of the region, including Lao PDR. As such, trade facilitation, i.e., thereduction in international trade transaction costs, is essential to ensuring that enterprisesin Lao PDR can effectively engage in international trade and integrate into regional andglobal value chains.In an effort to better measure trade facilitation performance in the region and to increaseunderstanding of trade costs between countries in Asia and the Pacific and beyond,ESCAP developed a database of bilateral comprehensive trade cost (CTC).2 CTC is anall-inclusive measure of bilateral trade cost based on micro-economic theory. It iscalculated using macro-economic data as opposed to perception (survey) data. The latestversion of the ESCAP Trade Cost database was released in December 2011. However,trade cost for some of the least developed countries (LDCs), including Lao PDR, are notfeatured in this Database due to unavailability of disaggregated trade data for thesecountries.In that context, the Office of the National Trade Facilitation Secretariat, Ministry ofIndustry and Commerce, Lao PDR, requested ESCAP to develop bilateral trade costestimates for Lao PDR to enable it to monitor the country’s progress in facilitating trade.As a result, the ESCAP Trade and Investment Division (TID) developed an alternativeway to generate bilateral trade cost estimates for Lao PDR and its partner countries.3 TheLao PDR Comprehensive Trade Cost dataset generated using this alternative data sourcecontains bilateral trade cost information between Lao PDR and 46 partner countries at theaggregate level and for the period 1995-2010.4This report provides a preliminary analysis of the data contained in the Lao PDRComprehensive Trade Cost Database and its implications. Interested stakeholders mayconduct more detailed analysis using the Database provided separately.5The next section elaborates briefly on the definition and interpretation of bilateralcomprehensive trade costs (CTC) and CTC-excluding-tariff (NT-CTC). Section 3presents an overview of Lao PDR bilateral comprehensive trade cost (excluding tariff)with various trade partners. Section 4 introduces some of the main factors responsible fordifferences in trade costs across Asia-Pacific countries and discusses the performance ofLao PDR on the basis of available indicators related to these factors. Section 5 concludesand proposes a way forward for policy makers, researchers and practitioners on tradefacilitation for Lao .aspThis is done essentially by using bilateral trade data from the IMF Direction of Trade Statistics (IMF–DOTS) instead ofCOMTRADE data.4Sectoral trade costs (for agriculture and manufacturing goods) could unfortunately not be estimated as IMF-DOTS only provideaggregate bilateral trade data.5See Annex 1 for an explanatory note for database users.33
II. Understanding Comprehensive Trade Costs: FurtherElaboration6The bilateral comprehensive trade cost measure (CTC) featured in the Lao PDR TradeCost Database - submitted along with this report - is truly comprehensive in the sense thatit includes all costs involved in trading goods internationally with another partner (i.e.bilaterally) relative to those involved in trading goods domestically (i.e.,intranationally).7 This measure captures the cost of trade in its wider sense, including notonly international transport costs and tariffs but also other trade cost componentsdiscussed in Anderson and van Wincoop (2004), such as direct and indirect costsassociated with differences in languages, currencies as well as cumbersome import orexport procedures.As trade facilitation-related costs are generally understood to exclude tariff, the Lao PDRTrade Cost Database also include estimates for NT-CTC, i.e., CTC excluding importtariff costs. When the focus is specifically on trade facilitation and logistics matters, as inthis report, the use of NT-CTC is most appropriate. Following Anderson and vanWincoop (2004), comprehensive trade costs excluding tariff (NT-CTC) encompass alladditional costs other than tariff costs involved in trading goods bilaterally rather thandomestically.Bilateral NT-CTC, as defined above, is presented in this country report as “ad valoremequivalent” values, i.e., in percentage of the value of goods. One of the explanations forthe relatively high ad valorem values found is that NT-CTC is an average trade cost of allgoods that are tradeable, many of which are not traded in practice for various reasons,including for example inability to meet international product standards of partnercountries.It is important to note that NT-CTC measures overall trade costs between two partnercountries, i.e., it is an average of the import and exports costs of both trading partnerswith each other (excluding tariffs imposed by each country on each other). Hence, NTCTC of Lao PDR with Viet Nam is equal to the NT-CTC of Viet Nam with Lao PDR.6Details on calculation and methodology, as well as further details regarding interpretation of comprehensive trade costs, are providedin Annex 1.7There have been many attempts to develop trade costs measures. Much efforts have focused on direct measurement of various tradecost components, such as international transport costs (using actual shipping costs of a standard container to various destinations ormore aggregate CIF/FOB trade data), or costs of moving goods from the factory to the deck of a ship at the nearest sea port (including,e.g., cost of preparing trade documentation, customs clearance, goods transport and handling to the port). However, these approachesdo not provide a comprehensive measure of international trade costs - and combining the different measures and indicators into acomprehensive measure is hardly feasible.4
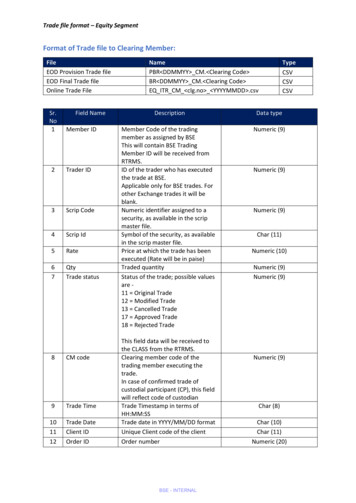
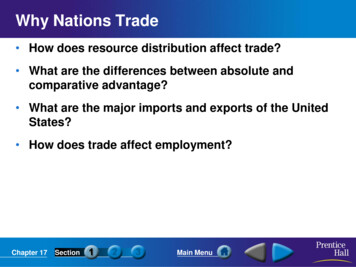
III. Lao PDR Comprehensive Trade Costs (excluding tariff)Lao PDR Trade Costs: An OverviewFigure 1 shows bilateral NT-CTC between Lao PDR and a number of its trade partners,including its top 5 trading partners in terms of import volume (Thailand, China, Vietnam,Republic of Korea and Japan). Non-tariffs trade costs of Lao PDR are lowest withThailand, Viet Nam, and China, in this order. It is worth noting that Lao PDR – Chinatrade costs are, on average, almost three times higher than those between Lao PDR andThailand, However.Figure 1. Bilateral Comprehensive Trade Costs (excluding Tariff) of Lao PDR48%ThailandViet NamChinaRepublic of KoreaFranceGermanyJapanUnited StatesUnited raliaIndiaSwitzerlandSwedenPolandRussian FederationSpainIndonesiaSouth h RepublicArgentinaMoroccoSlovak iff-equivalent trade cost (percent)Note: Latest data is not available for Bulgaria, Canada, Egypt, Greece, Moldova and, New Zealand.Source: Lao PDR Trade Cost Database [modified from ESCAP Trade Cost Database]5
Lao PDR trade costs with ASEAN countries provide a mixed picture (Trade costs withASEAN countries are shown in yellow in Figure 1, while those with other countries areshown in blue). For example, Lao PDR – Cambodia and Lao PDR – Malaysia trade costsare found to be five times those between Lao PDR and Thailand; and the trade costs areeven higher with ASEAN members that are located further away from Lao PDR, such asIndonesia and the Philippines.It is worth noting that the higher trade costs cannot be attributed to the larger physicaldistance between Lao PDR and these countries, however. Indeed, Lao PDR–Indonesiatrade costs are found to be not only higher than those between Lao PDR and mostEuropean countries (which are clearly much more geographically distant from Lao PDRthan Indonesia), but also higher than those between Lao PDR and India or Russia. Thesefindings suggest that there is ample room to enhance trade integration of Lao PDR inASEAN.Looking at trade costs between Lao PDR and developed economies, Lao PDR trade costs(NT-CTC) are lowest with the two largest European economies (Germany and France),with Lao PDR – Japan trade costs (NT-CTC) slightly higher. Lao PDR – USA trade costs(NT-CTC) are found to be about 10% higher than those between Lao PDR and Germany.Table 1 provides a more detailed view of Lao PDR trade costs (NT-CTC) with key tradepartners, as well as trade costs of these trade partners with each other. It highlights thefact that Lao PDR trade costs remain high when compared to those of other countries –e.g., they are on average more than twice as high as those of Viet Nam.Table 1. Trade Costs (NT-CTC) of Selected Economies with Each Other, 2008-2010LAOKHM250%Lao, P.D.R.(9%)(LAO)250%Cambodia(9%)(KHM)79%76%Viet Nam(N/A)(3%)(VNM)48%83%Thailand(-25%) (-15%)(THA)281%206%India(-14%) (-17%)(IND)130%143%China, P.R.(-25%) (7%)(CHN)204%158%Japan(-15%) (-5%)(JPN)151%135%Republic of Korea(-49%) nited States(-22%) (-18%)(USA)174%147%Average(-24%) (-7%)(AVG)Source: Laos’ Trade Cost 10%)6
On a more positive note, Lao PDR – Thailand trade costs (NT-CTC) are significantlylower than Cambodia – Thailand and Viet Nam – Thailand trade costs (NT-CTC). At thesame time, Lao PDR trade costs (NT-CTC) with the United States (USA) are more thandouble those of Cambodia and Viet Nam and remain prohibitively high with out-of-thesubregion emerging markets such as India.Progress made since 2000As shown in Table 1, the country made relatively more progress in reducing trade coststhan many other countries between 2000 and 2010, cutting costs by nearly 25%.Table 2 shows how Lao PDR bilateral trade costs (NT-CTC) have evolved since thebeginning of the new century with a variety of other countries. Lao PDR has seen itstrade costs reduced most with Republic of Korea between 2000 and 2010, with thesecosts cut nearly in half during the period. Much progress was also made with China andThailand (2 of its neighboring countries), as well as with the United States of America –and also Portugal, although trade costs between that country and Lao PDR (at 365%)remain at least 50% higher than between Lao PDR and the larger European economies.The trade cost reduction of 14% achieved between Lao PDR and India is alsonoteworthy, particularly given that the two countries belong to two distinct Asiansubregions.Lao PDR trade costs with Germany and Italy are found to have fallen between 2000 and2010, while those with France and Spain – and to a lesser extent UK - increased. Lookingat ASEAN partners, trade costs of Lao PDR with Indonesia and Philippines seem to havereached a peak during the 2004-2007 period; and have fallen since then. This is not thecase with Cambodia, however, with Lao PDR – Cambodia trade costs increasing between2004-2007 and 2008-2010 period.Lao PDR made least progress in reducing trades costs with some of the Eastern andNorthern European countries (e.g., Norway, Czech Republic) between 2000 and 2010.Trade costs with those countries are not only very high in absolute terms, but have alsoincreased significantly, often by more than 40%. These findings may deserve furtherinvestigation.7
Table 2. Reduction in Lao PDR trade costs (NT-CTC)NT-CTC betweenLao PDR and:Republic of KoreaPortugalThailandChinaUnited ruMalaysiaArgentinaUnited KingdomRussian FederationAustraliaPhilippinesSouth siaTurkeySwedenChileNetherlandsNorwayHungaryCzech RepublicFinlandSlovak Republic2000-20032004-20072008-2010% 93%211%297%551%380%311%494%Source: Lao PDR Trade Cost Database [modified from ESCAP Trade Cost Database]8
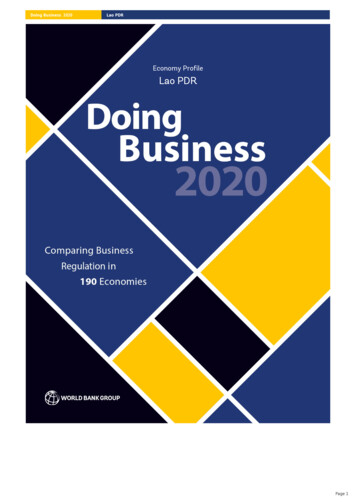
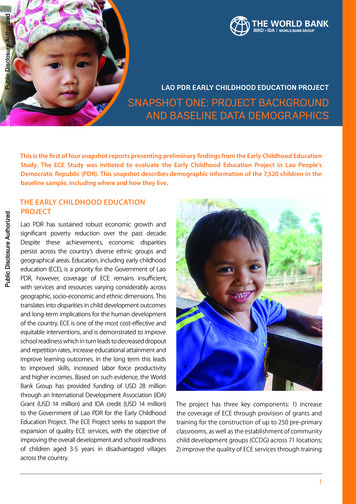
IV. Reducing Comprehensive Trade Costs: Other Indicatorsof Lao PDR Performance and ImplicationsNT-CTC is a highly aggregated measure of trade costs – and trade facilitationperformance. Beyond recommending the development of a holistic trade facilitationprogramme and focusing trade facilitation efforts on countries with which Lao PDR hasparticularly high bilateral trade costs (NT-CTC), specific policy implications cannot bederived from simply looking at overall comprehensive trade costs.Comprehensive trade costs can be conceived as made of a tariff trade costs component, anatural trade costs component, and a non-tariff policy-related component (see Figure 2).In Asia and the Pacific, the tariff trade cost component typically accounts only for a smallshare of total trade costs as extensive trade liberalization has taken place in mosteconomies in the region, including through bilateral and regional agreements (e.g.,ASEAN Trade in Goods Agreement for Lao PDR). The natural trade cost componentrelates to the cost associated with differences in language, culture, geographical distance,and landlockedness, all of which add to costs but cannot be easily affected throughpolicy. Natural trade costs are often significant, particularly for landlocked countries.Figure 2. Contribution of Various Policy-Related Factors on Changes in TradeCostsTariff Trade CostsPolicy-RelatedNon-Tariff Trade CostsNatural Trade Costs(Geographical and Cultural Factors)0-10%*6090%*1%Direct Behi nd- & At-the-border Tra de Co sts6-7%Ava ila bi lity/use of ICT Serv ices6-7%Business (Regula to ry ) Enviro nment16-18 %Ma ritime Connectivity/Serv ices52-57 %O ther Trade Co sts- Indirect cost of trade pro cedure- Currency fluctuation- Other no n-tariff barri ers1030%**illustrative based on casual observation of the data only. Natural trade costs for landlocked countries maybe outside the range shown for natural trade costs.Source: Duval and Utoktham (2011)The third trade cost component, and typically the largest (representing over 60% ofcomprehensive trade costs on average in Asia and the Pacific), is of most interest as it canbe reduced through policy action (see Figure 2). The regional analysis conducted atESCAP indeed finds that, on average, the following policy factors/areas are most9
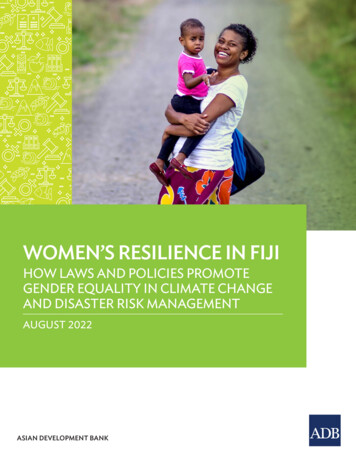
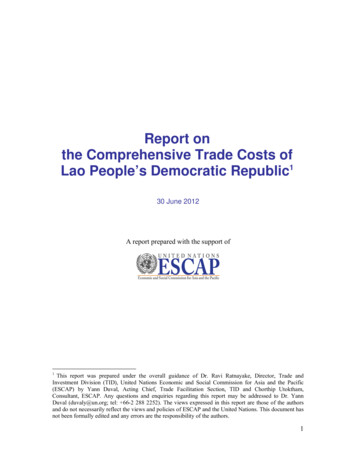
important in reducing trade costs, in this order: a) maritime connectivity/services andrelated logistics performance; b) the domestic business (regulatory) environment; c) theavailability and use of information and communication technology (ICT) services; and d)direct behind- and at-the-border trade costs. The analysis also suggests that over half ofthe comprehensive trade costs variations across countries are affected by other factorsalthough the importance of these other factors cannot be separated out. The performanceof Lao PDR in relation to each of the above areas is discussed below.a) Maritime Connectivity/ServicesAs more than 80% of goods traded are transported by sea, maritime services and seaportinfrastructure and connectivity play a crucial role in determining the cost of internationaltrade. As Lao PDR is a landlocked country and has no seaport, it depends on the portinfrastructure of neighboring countries, in particular Thailand but also Viet Nam - andeven possibly China, as well as Myanmar in the future.8 Based on the Liner ShippingConnectivity Index (LSCI), which provides a comprehensive view of the maritimeservices and infrastructure available, 9 China has the highest port connectivity in theworld, well ahead of countries such as Japan and North America (see Figure 3). Thailand,the country through which most of Lao PDR imports and exports transit, also hasadequate Liner Shipping Connectivity.10In the context of Lao PDR, the key issue is therefore one of effective transit arrangementswith neighboring countries, complemented by the availability of logistics services thatcan efficiently move goods from Lao PDR to the seaport in Thailand and Viet Nam.However, the Logistics Performance Index (LPI) scores of Lao PDR in all five areascovered by the LPI 11 remain very low, in particular in terms of ease of arranginginternational shipments and timeliness of delivery of these shipments (see Figure 4). Thissuggests much need for policies aimed at logistics service sector development in LaoPDR.8Air freight services play an increasingly important role in international trade. However, as 80% of goods traded still take place usingsea vessels, the LSCI index is thought to adequately capture the international logistics services efficiency dimension of trade costs.9The LSCI is composed of the following five quantitative indicators: (a) number of ships providing services to and from a country, (b)combined TEU (20-foot equivalent unit: standard size container) carrying capacity of these ships, (c) number of services provided, (d)number of liner companies providing these services, and (e) maximum vessel size available in a country.10Viet Nam has made huge progress in port connectivity in the past 3 years according to the LSCI, whereas Cambodia still has verypoor liner shipping connectivity.11The LPI is an overall measure of logistics quality and performance, which is composed of (a) customs: efficiency of clearanceprocess; (b) infrastructure: quality of trade- and transport-related infrastructure (ports, railroads, roads, information technology); (c)international shipments: ease of arranging competitively priced shipments; (d) logistics competence: competence and quality oflogistics services (transport operators, customs brokers); (e) tracking and tracing: ability to track and trace consignments and; (f)timeliness: frequency with which shipments reach the consignee within the scheduled or expected delivery time. Each indicator isrepresented by a score from 1 (lowest quality) to 5 (highest quality). For more details, please visit http://lpisurvey.worldbank.org/ .10
Figure 3. Liner Shipping Connectivity Index (LSCI), 2011ChinaRepublic of KoreaMalaysiaUnited StatesJapan2011Viet 406080100120140160Index (maximum value in 2004 100)Source: ESCAP, based on UNCTAD LSCI, World Development Indicators, World BankFigure 4. Logistics Performance Index (LPI), 2011LPI Score54.54TimelinessCustoms3.532.521.51Tracking & tracingInfrastructureLogistics competenceCambodiaChinaJapanRepublic of KoreaInternational shipmentsLao PDRMalaysiaThailandUnited StatesVietnamSource: Connecting to Compete 2012: Trade Logistics in the Global Economy, the World Bank11
b) Business (Regulatory) EnvironmentWhile logistics efficiency plays an important role in trade facilitation, an increasingnumber of studies have shown that the quality and transparency of the businessenvironment in importing and exporting countries significantly affect trade flows.12 Aninefficient domestic regulatory environment can indeed be expected to increaseinternational trade costs given those international transactions almost systematicallyinvolve additional and often more complex interactions with regulators and serviceproviders, as compared to domestic transactions. In this context, Figure 5 shows the Easeof Doing Business (EDB) ranking of Lao PDR and other selected economies. WhileThailand is found to have a performance and an EDB rank on par with that of Malaysiaand Japan, Lao PDR – along with Cambodia – ranks in the bottom tier of the Worldranking, indicating a very poorly conducive business regulatory environment.In an effort to distinguish essential dimensions of the business environment thought toaffect overall trade costs, we also show country rankings for three underlying indicatorsof the EDB covering key areas of business regulations - credit, investment, and rule oflaw.13 In terms of investor protection, Lao PDR and Viet Nam rank significantly lowerthan others in South-East Asia. In terms of getting credit, Lao PDR Indonesia andPhilippines perform poorly. In terms of contract enforcement, which arguably is anindicator for general rule of law, Lao PDR performs poorly but better than Indonesia andCambodia. Overall, much improvement in the domestic business environment is likely tobe needed for Lao PDR to make progress in reducing its comprehensive trade costs.12See Duval and Utoktham (2010) for a review.These three indicators also have the particularity of being least correlated with each other, among all other underlying indicators ofthe EDB, making it feasible to include all of them as explanatory variable of trade costs in the empirical analysis that follows. Thechoice and nature of these indicators are discussed in details in Duval and Utoktham (2010).1312
Figure 5. Ease of Doing Business (EDB), Investor Protection, Credit Informationand Contract Enforcement: 2011 Ranking4United States8Republic of Korea17Thailand18Rank (the less the better)Malaysia20Japan91China98Viet Nam129Indonesia136Philippines138Cambodia165Lao PDR0204060Contract Enforcement80100Credit Acquisition120Investor Protection140160180Ease of Doing BusinessSource: ESCAP, based on data from the Doing Business Report 2012, World Bankc) Availability/Use of ICT ServicesAvailability and affordability of information and communication technology (ICT)services (see Figure 6) can be expected to facilitate trade and the overall cost of trade,particularly since ICT use can greatly facilitate and reduce the cost of exchanging theoften complex and sizeable volume of information, data and documents associated withan international trade transaction.While Viet Nam, Philippines and Thailand are found to have achieved similar level ofICT usage, with approximately a quarter of the population using the Internet, ICT usagein Lao PDR remains low. Policy measures aimed at encouraging and facilitating access toICT services are most likely needed to reduce trade costs in Lao PDR – as well as toensure access and use of the future national electronic single window facility by thetrading community at large.13200
Figure 6. Information and Communication Technology Usage in India and MekongCountries (Internet users per 100 people; 2005 and 2010)Republic of KoreaJapanUnited StatesMalaysiaChina2010Viet Nam2005PhilippinesThailandIndonesiaLao PDRCambodia0102030405060708090Users per 100 peopleSource: Authors based on World Development Indicators (DataBank), World Bankd) Direct Behind and at the Border Trade CostsDirect behind- and at-the-border trade costs for international traded goods are one of thesignificant determinants of international trade costs, although it is found to explain onlyabout 1% of the variations in trade costs across Asia-Pacific countries. Data from TradingAcross Border indicators reported in the annual Doing Business Reports includeestimates of import and export cost, where export cost are defined roughly as the directcost involved in completing all regulatory and logistics procedures necessary to preparedocumentation and physically move a 20-foot container of goods from a factory near thecapital city to the deck of a ship at the nearest seaport.Lao PDR faces the highest export and import cost of all countries in Table 3, with coststwo to three times higher than those in other ASEAN countries. This situation is partlyexplained by the fact that the goods have to transit through another country’s territorybefore reaching the nearest seaport. Policies aimed at streamlining document preparationfor trade and transit, as well as reducing the cost of transportation and handling of goodsfrom Lao PDR to the main sea ports would be key in reducing direct costs, but wouldalso likely reduce the – possibly much higher - indirect costs associated with thecumbersome regulatory and logistics procedures in place (see next section).14
Table 3. Ease of Doing Business: Trading across BorderCost to export (US Cost to importper container)(US per 872Lao 957970Republic of Korea767680747695United States990105012451315Source: Ease of Doing Business Report 2009 and 201214, World Bank.e) Other Trade CostsAs mentioned above, while taking measures and implementing policies to address theabove 4 issues would be important, effectively facilitating trade and reducing trade costsinvolve tackling other less obvious and indirect trade costs, such as opportunity costsassociated with the time it takes to complete trade documentation or to engage in otherregulatory – or business to business – procedures. In fact, these costs (embedded in themeasure of comprehensive trade costs) can be so high that they can discourage businessesto actuall
ESCAP developed a database of bilateral comprehensive trade cost (CTC).2 CTC is an all-inclusive measure of bilateral trade cost based on micro-economic theory. It is calculated using macro-economic data as opposed to perception (survey) data. The latest version of the ESCAP Trade Cost database was released in December 2011. However,