Transcription
Indiana Undergraduate Journal of Cognitive Science 4 (2009) 103-113Copyright 2009 IUJCS. All rights reservedShot Structure in Hollywood FilmChristine E. Nothelfer1, Jordan E. DeLong2 and James E. Cutting21Department of Psychology, University of California, Berkeley2Department of Psychology, Cornell UniversityAbstractIn film, a ‘cut’ is a transition between two continuous strips of motion picture film, or‘shots’. These transitions can dissolve one film strip into the next, or be an abrupt stopbetween the two shots. How cuts have increased in frequency since the beginning of cinemaand how their arrangement form structure across groups of shots is the focus of this study. Inorder to examine this, films were obtained from 3 genres (action, comedy, drama) and 4 years(1945, 1965, 1985, 2005), one film per genre per year. Luminance and color informationwere digitally sampled and imported into a Matlab-programmed ‘cut detector’ to predictwhere cuts occurred within the given film. The program detected hard and soft cuts, whichwere then manually confirmed or rejected. Additionally, ranges of flagged frames wereprocessed to identify missed cuts, resulting in a list of all the frame numbers at which cutsoccur in each film. The results show that mean shot length has decreased over the years.Auto-correlation computation of shot length pairs shows that shot pairs are positivelycorrelated, across both variables of genre and year; this reveals that structure is present acrossgroups of shots in the same pattern of shot length sequences. This finding suggests that thereis much more structure to narratives and to seemingly intuitively-placed cuts than one maythink.IntroductionSince its introduction, film has come to play a major role in entertainment and popularculture. However, filmmaking has come a long way from its start through constant revisionand innovation.Cinema began with films consisting of a single shot, partially due to technologicalinconveniences. For example, the initial version of the Kinetograph camera, used during thefirst several years of film in the late 1890s, was contained in very large and heavy casing.Early cameras lacked a view-finder, which made determining what was actually in the framelargely guesswork, unless frame limits had been previously set by opening up the back of thecamera. Additionally, cameras were held on still-camera tripod heads until the creation of thefirst panning tripod head in 1897.
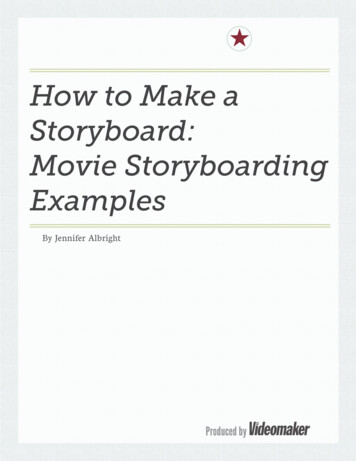
C. Nothelfer / IUJCS 4 (2009)104Single-shot films soon became problematic after the novelty had worn-off. Stories couldonly be portrayed in real time, and they were short (averaging about 1 min duration in 1990;Salt, 1983), disallowing film makers to employ a complex narrative. A solution to thisproblem was longer films through the use of transitions between continuous strips of film, orshots.A cut is a transition between two shots. These transitions can be an abrupt stop betweenthe two shots (a ‘hard cut,’ see Fig. 1A), or can dissolve one film strip into the next (a ‘softcut,’ see Fig. 1B). Cuts were introduced in the first multi-shot film around 1900 and sharplyincreased in frequency in 1903. Hard-cuts specifically between scenes increased dramaticallyfrom the 1930s through the 1960s, while use of the dissolve peaked in the 1950s and began todecline in the 1960s (Carey, 1974). Films could now be longer, as well as include developednarrative across various locales.The initial use of cuts was followed by trouble with action continuity across cuts,although solutions were soon devised over time. Because scenes were often too disconnectedto be understandable, text screens were placed between scenes to provide a consistentnarrative thread. In his book Film Style and Technology: History and Analysis, Barry Salt(1983) details how the fireman in Bob, the Fireman is clearly a different fireman acrosssuccessive shots, despite the text insisting that he is always “Bob.”Since the beginning of cinema, cuts have continued to increase in frequency. Accordingto Salt (1983), a shorter shot trend emerged by the 1950s and sped-up during the 1960s. Asfor the past few decades, David Bordwell (2006) explains in The Way Hollywood Tells It thatcutting rate continues to increase through the 1980s to the 2000s.As popular as film has come to be over time, few researchers have studied film througha statistical approach. In light of this, we intend to track changes over time in different shotlengths and examine shot length sequences.MethodsTo study film evolution and internal structure, films were chosen from 3 genres (drama,comedy, action) and 4 years (1945, 1965, 1985, 2005), 1 film per genre per year. Films usedwere: Bells of St. Mary’s (drama, 1945), Anchors Aweigh (comedy, 1945), Blood of the Sun(action, 1945), Shenandoah (drama, 1965), What’s New Pussycat? (comedy, 1965),Thunderball (action, 1965), Out of Africa (drama, 1985), Spies Like Us (comedy, 1985),Rambo: First Blood Part II (action, 1985), Walk the Line (drama, 2005), Wedding Crashers(comedy, 2005), Star Wars: Episode III –Revenge of the Sith (action, 2005). These filmswere chosen as the top grossing films of each year per category, as indicated bywww.boxofficereport.com. Genres were identified through www.imdb.com.To detect cuts, luminance and color information were obtained from films by digitallysampling and importing them into a multi-part Matlab program. This program features amanual feature for cut-detection found to be more efficient than manually processing a filmframe-by-frame, and more accurate than using a Cinemetrics-type program. Cinemetrics is aprogram available online that records where cuts occur by having the user click to indicate a104
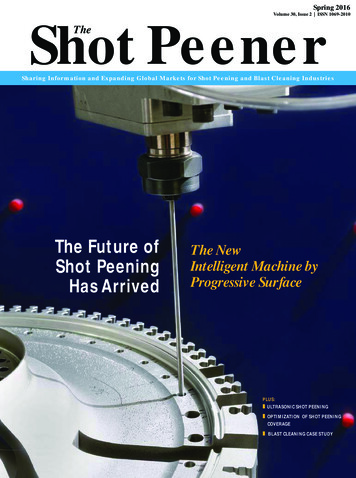
C. Nothelfer / IUJCS 4 (2009)105cut as he or she watches a film. Although this program is useful for determining mean shotlength, its data are corrupted by reaction time, which makes structure detection problematic.The cost of our Matlab program, however, is that the false alarm rate can be relatively high.Other cut-detection programs without a manual aspect have a hit rate of about .95 and falsealarm rate of about .18, while our program has a hit rate of .99 and false alarm rate of .002.Spies Like Us was manually processed frame-by-frame to provide benchmark data.The first part of the program saved each frame as a 256x256 pixel jpeg color picture file.Next, each frame was divided into an 8x8 grid. Within each square, 3 10-bin luminancehistograms were created, one for each color channel (red, green, blue). The histograms of agiven frame were then compared with the histograms of the previous and following frames.The difference between the two comparisons – which we will call acceleration - was noted,averaged across color channels, and saved into an 8x8 array.In order to detect hard cuts, two statistics are used. The first is the mean of the 8x8 arrayacceleration values. The second is covariance, or how one of the 8x8 panels of pixels changeswith respect to its surrounding panel. High increase in both covariance and mean accelerationdenotes what is likely to be a hard cut.Soft cuts are more difficult to detect and require the use of two properties. First-orderentropy of each frame was calculated to check whether pixel distribution was Gaussian.When two images are superimposed, the pixels of the resulting image usually become moreGaussian. Then the monotonic change in luminance over a period of time (6 frames) waschecked. If a frame had been flagged for its change in entropy and then met a monotonicityrequirement, it was flagged as a soft cut.After cuts were detected, the next part of the program used a graphics-user interface topresent the researcher with a screen of 4 rows of frames, each row featuring a cut. The framesbetween the end of one row and beginning of the following row presumably belonged to acontinuous shot, since cuts were presented in chronological order. The researcher’s task wasfirst to confirm or reject the computer-detected cut within each row. He or she then identifiedpairs of rows between which a cut may have been missed, if there appeared to be enoughdiscontinuity between the last frame of a given row and the first frame of the next row. Suchframes were flagged for use in the next part.The final part of the program replayed the ranges of flagged frames. After each film clipwas played, the researcher was prompted to identify whether a cut was present. If a cut waspresent, the researcher then navigated through the frames, 1 or 10 frames at a time, to identifywhere the cut occurred.The output file provided 2 variables—an array that contained the frame numbers atwhich all cuts in the film occurred, and an array that contained the length of each shot inseconds and their overall number ((total # cuts) – 1).ResultsTo explore how film has changed over time, we examined the change in mean shotlength across years. Mean shot length was 13.0 sec for 1945 films, 6.8 sec for 1965 films, 4.0105
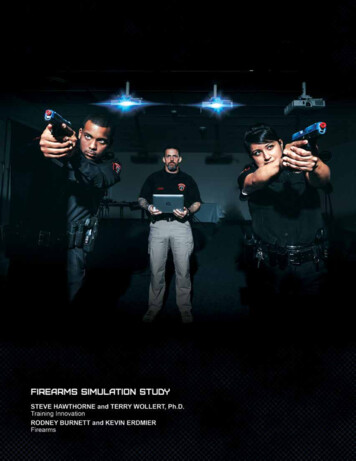
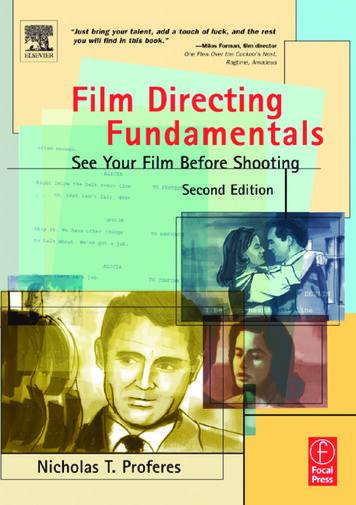
C. Nothelfer / IUJCS 4 (2009)106sec for 1985 films, and 4.3 sec for 2005 films (see Fig. 2). A chi square test shows thatpattern of increasingly shorter shots is statistically reliable across years, X2(6) 26.40, p .001.To examine structure within film, we looked at shot length sequence across genres bycomputing an auto-correlation between shot length pairs (see Fig. 3). The lag-1 correlationsfor films – that is, shot pairs that are 1 shot apart – are .17 for action films, .18 for comedies,and .18 for dramas. All curves fall-off smoothly, with the drama and comedy film curveshitting a negative correlation at lags of 25 and 62, respectively. All curves show a pattern ofabove chance— action films z 8.83, p .00003; comedy films z 6.82, p .00003;drama films z 5.70, p .00003. Additionally, action films are reliably above comedies, z 5.48, p .00003, and comedies are reliably above dramas, z 5.93, p .00003.An auto-correlation was also computed to examine shot length sequence across years(see Fig. 4). The lag-1 correlations for films are .18 for 1945 films, .19 for 1965 films, .18 for1985 films, and .17 for 2005 films. All curves, except the 1945 film curve, show a pattern ofabove chance— 1945 films z 1.23, p .12; 1965 films z 5.48, p .00003; 1985 films z 8.61, p .00003; 2005 films z 8.39, p .00003. Additionally, there appears to be noimmediate year effect— 2005 films are not reliably above 1985 films, z -2.57, p .99; the1985 films are reliably above 1965 films, z 4.58, p .00003; and the 1965 films aremarginally above 1945 films, z 1.90, p .029.To further examine structure within film, the partial correlations were calculated for shotlength pairs across genres (see Fig. 5). For example, at lag 2 where shot length pairs are 2shots apart, the partial correlations between the first and second shot lengths and that of thesecond and third shot lengths are factored out, leaving only the partial correlation betweenthe first and third shot lengths. Looking at continuous strings of values that remain above the95% 2-tailed confidence interval for random data, drama film partial correlation values arepositive up to lag 2, comedy films up to lag 4, and action films up to lag 3. All curves show apattern of above chance— action films z 3.06, p .0011; comedy films z 3.06, p .0011;drama films z 1.31, p .095. Additionally, action films are not reliably above comedyfilms, z 0.00, p .50, but comedies are reliably above dramas, z 1.31, p .095.Partial correlations were also used to examine shot structure across years (see Fig. 6).Looking at continuous strings of partial correlation values that remain above the 95% 2-tailedconfidence interval for random data, 1945 films are positive up to lag 2, 1965 films up to lag4, 1985 films up to lag 3, and 2005 films up to lag 3. All curves show a pattern of beingmarginally above chance— 1945 films z 1.31, p .095; 1965 films z 1.75, p .040; 1985films z 3.06, p .0011; 2005 films z 1.31, p .095. Additionally, there again appears tobe no immediate year effect— 2005 films are not reliably above 1985 films, z -2.18, p .99; the 1985 films are marginally above 1965 films, z 0.44, p .33; and the 1965 films aremarginally above 1945 films, z 0.44, p .33.106
C. Nothelfer / IUJCS 4 (2009)107DiscussionIn the present study, we sought to examine in what ways film has changed over time andexplore shot sequence structure. Our findings reveal that mean shot length decreases in morerecent films, and that increasing structure is present across groups of shot.The data confirms David Bordwell’s (2006) claim in his book, The Way Hollywood TellsIt, that mean shot length decreases significantly across years. Technological advances haveplayed a major part, but this decrease may also shed light on film viewers’ interests. Within anarrative, the shorter the shot length, the more information can be displayed in a givenamount of time. The increase in cuts over the years does not seem to overload viewers, andthe sharp decrease in mean shot length illustrates that viewers have become quite used to theincrease in cuts. Significantly longer shot lengths in older films may explain why the averagemovie-goer considers these films to be less interesting to watch.The correlated shot length pairs across both genres and years illustrates that the closershots are to each other within a film, the more their lengths are correlated. This reveals thatstructure is present across groups of shots. Further, the positive correlation indicates that it isthe same pattern of shot lengths that ripples through a film. The partial correlations revealhow many consecutive shots compose these patterns. This finding is interesting when pairedwith how film editing is taught. In his book Cut by Cut: Editing Your Film or Video, GaelChandler (2004) instructs how to edit film and video, and states: “Most editors go with theirgut more than their head when cutting. You don’t dryly reason out each edit. You use yourheart and instinct to cut” (p. 130). However, this intuition appears to be quite structured, andthere may be much more to how editors choose to place cuts.The significantly different correlation curves across genres perhaps reflect how cuts setthe pace for a film’s narrative, as dictated by its genre. Shot length sequences may bemirroring the quick motions within action films’ fight scenes, the long dialogues in dramas,and the mix between the two in comedies.Although there is no immediate year effect, a trend may appear with a larger sample.Change in shot length sequences across years may reflect changes in tastes and film style,often dependent on historical context. In Film Style and Technology: History and Analysis,Barry Salt (1983) states that “after the end of [World War II] there began to be an increasingtendency to deal with down-beat subject matter in all the major film-making countries [.]”(p. 287). Similarly, the 1950s sparked innovation in film projection methodology andlocation choice to combat the commercial decline of American cinema due to the rise oftelevision, and change in subject matter during the 1960s reflected the loss of older viewers.In terms of future directions, this study serves as preliminary research for a larger studythat will sample the top 10 grossing films of every 5 years, from 1935 to 2005. With thepresent data, there appears to be genre-year interaction for both mean shot length andcorrelated shot length pairs. With a larger sample we will be able to better examine thesetrends, look at other genres, and see what other trends emerge.107
C. Nothelfer / IUJCS 4 (2009)108This study also makes us wonder whether other forms of narrative hold a similar internalstructure. We are particularly interested in sentence length within literature. This also placesnotes in soundtrack and program music in question.In sum, films appear to hold structure in their shot length sequences, across both genresand years. Films have clearly changed since the introduction of the cut, which calls us toquestion whether films will continue to change. Shot lengths may continue to decrease,although probably not by too much. Perhaps higher correlations and longer consecutive shotpatterns will appear over time, reflecting a continuation of this structural phenomenon.ReferencesBordwell, D. (2006). The Way Hollywood Tells It. Berkeley, CA: University of CaliforniaPress.Carey, J. (1974). Temporal and spatial transitions in American fiction films. Studies in theAnthropology of Visual Communication, 1, 45-50.Chandler, G. (2004). Cut by Cut: Editing Your Film or Video. Studio City, CA: MichaelWiese Productions.Salt, B. (1983). Film Style and Technology: History and Analysis. London: Starword.108
C. Nothelfer / IUJCS 4 (2009)109FiguresFigure 1A. A ‘hard cut’ separating the end of one shot and beginning of the following shot.Figure 1B. ‘A soft cut’— one shot (girl leaving through door) dissolving into the next shot (view ofhouse).Figure 2. Graph depicting decrease in mean shot length across years.109
C. Nothelfer / IUJCS 4 (2009)110Figure 3. Autocorrelations, depicting how the closer shot pairs are to each other across genres, thehigher the correlation.110
C. Nothelfer / IUJCS 4 (2009)111Figure 4. Autocorrelations, depicting how the closer shot pairs are to each other across years, thehigher the correlation.111
C. Nothelfer / IUJCS 4 (2009)Figure 5. Partial autocorrelations, depicting how the closer shot pairs are to each other acrossgenres, the higher the correlation.112112
C. Nothelfer / IUJCS 4 (2009)113Figure 6. Partial autocorrelations, depicting how the closer shot pairs are to each other across years,the higher the correlation.113
The Way Hollywood Tells It that cutting rate continues to increase through the 1980s to the 2000s. As popular as film has come to be over time, few researchers have studied film through a statistical approach. In light of this, we intend to track changes in different shot over time lengths and examine shot length sequences. Methods