Transcription
MemoryMemory JJoggerogger
ForewordIn January of 2007, Hewlett-Packard’s ExecutiveCommittee endorsed the need for a common languageof process improvement for use across the company.This endorsement was driven by the recognition thatwell-deployed, well-understood, and well-supportedprocess improvement methods were essential toachieving HP’s business goals.Our common language has elements of “Lean” - aphilosophy that focuses on driving out waste, and“Six Sigma” - a set of tools and methods for executingbreakthrough improvement projects. The HP Lean Sigmaprogram integrates these approaches to create a cultureof improvement that arms people with the tools neededto make improvements at all levels of the company.The tools and methods outlined in this book, HP’s LeanSigma Memory JoggerTM, for optimizing resources,streamlining operations, and working with people areapplicable to all areas and levels of the company. Webelieve this reference book, created in partnershipbetween Hewlett-Packard and GOAL/QPC, will enableHP associates to successfully apply the most commonlyused and most effective tools for creating value,eliminating waste, and executing improvement projects.We wish you all the best,The HP Lean Sigma Development Team:David Rentschler (Personal Systems Group)Daniel Castle (Imaging & Printing Group)Bruce Boles (Technology Solutions Group)Kellee Noonan (HP Learning & Development) 2008 GOAL/QPC
How to Use The Lean SigmaMemory JoggerThe Lean Sigma Memory Jogger is designed for youto use as a convenient and quick reference guide onthe job. Put your finger on any tool within seconds!Know the tool you need? Find it by using the Tableof Contents. Tools and techniques are in alphabeticalorder.Solid tab. This tab appears on the footer of the firstpage of each new section.What do the different positions of runners mean?Getting Ready—An important first step is toselect the right tool for the situation. When yousee the “getting ready” position of the runner,expect a brief description of the tool’s purposeand a list of benefits in using the tool.Cruising—When you see this runner,expect to find construction guidelines andinterpretation tips. This is the action phase thatprovides you with step-by-step instructionsand helpful formulas.Finishing the Course—When you see thisrunner, expect to see the tool in its final form.There are examples from manufacturing, administration/service, and daily life to illustratethe widespread applications of each tool. 2008 GOAL/QPCi
2008 by GOAL/QPCAny reproduction of any part of this publication without the written permission ofGOAL/QPC is prohibited.Unauthorized electronic distribution is a violation ofHP’s Standards of Business ConductHewlett PackardCommon EditionApril 10, 2008HP Point of ContactKellee Noonan: 01-650-857-5990E-mail: kellee.noonan@hp.comGOAL/QPC12B Manor Parkway, Salem, NH 03079-2862Toll free: 800-643-4316 or 603-893-1944Fax: 603-870-9122E-mail: service@goalqpc.comWeb site: www.goalqpc.comGOAL/QPC is a nonprofit organization that helpscompanies continually improve their Quality,Productivity, and Competitiveness. (Hence, the “QPC”in our name.)ii 2008 GOAL/QPC
Table of ContentsHow to Use the Lean Sigma Memory Jogger . iLean and Six Sigma, Defined.ivAffinity Diagram . 1Brainstorming . 8Cause & Effect/Fishbone/Ishikawa . 12Charter . 20Check Sheet . 25Control Charts . 30Critical To Quality (CTQ) Tree . 46Data Collection . 50Data Points . 56Design of Experiments (DOE) . 60Failure Mode and Effects Analysis (FMEA). 66Flowchart . 71Focused Problem Statement . 78Force Field Analysis . 83Histogram . 86Matrix Diagram/RACI . 96Nominal Group Technique/Multivoting . 102Operational Definitions . 106Pareto Chart . 108Prioritization Matrices . 118Project Storyboard . 128Radar Chart . 133Run Chart . 137Scatter Diagram . 141SIPOC (Supplier - Input - Process - Output - Customer). 146Team Guidelines . 150Tree Diagram . 156Value Stream Mapping (VSM) . 164Visual Management/5S/Seven Wastes . 178HP Learning Modules . 191Model for Improvement . 192DMAIC Model . 193 2008 GOAL/QPCDeming Materials . 194Six Thinking Hats . 198iii
Lean and Six Sigma, DefinedWhat is it?The definitions of Lean and SixSigma from the American Society forQuality (ASQ), the world’s leadingcertification body for Six Sigma GreenBelts and Six Sigma Black Belts.Lean is a system of techniques and activities for running a manufacturing or service operation.The techniques and activities differ according to theapplication at hand but they have the same underlying principle: the elimination of all non-value-adding activities and waste from the business.Six Sigma is a fact-based, data-driven philosophy ofquality improvement that values defect preventionover defect detection. It drives customer satisfactionand bottom-line results by reducing variation andwaste, thereby promoting a competitive advantage.It applies anywhere variation and waste exist, andevery employee should be involved.Several different definitions have been proposed forSix Sigma, but they all share some common themes: Use of teams that are assigned well-defined projects that have direct impact on the organization’sbottom line. Training in “statistical thinking” at all levelsand providing key people with extensive trainingin advanced statistics and project management. Emphasis on the DMAIC approach (define, measure, analyze, improve and control) to problemsolving. A management environment that supports theseinitiatives as a business strategy.iv
Affinity DiagramGathering &grouping ideasWhy use it?To allow a team to creatively generate a large numberof ideas/issues and then organize and summarize natural groupings among them to understand the essenceof a problem and breakthrough solutions.What does it do? Encourages creativity by everyone on the team atall phases of the process Breaks down long-standing communicationbarriers Encourages non-traditional connections amongideas/issues Allows breakthroughs to emerge naturally, evenon long-standing issues Encourages “ownership” of results that emergebecause the team creates both the detailed inputand general results Overcomes “team paralysis,” which is broughton by an overwhelming array of options and lackof consensusHow do I do it?1. Phrase the issue under discussion in a full sentence.What are the issues involved in planningfun family vacations? 2008 GOAL/QPCAffinity Diagram1
From the start, reach consensus on the choice ofwords you will use. Neutral statements workwell, but positive, negative, and solution-oriented questions also work.2. Brainstorm at least 20 ideas or issuesa) Follow guidelines for brainstorming.b) Record each idea on a Post-it note in bold,large print to make it visible 4–6 feet away. Useat minimum, a noun and a verb. Avoid usingsingle words. Four to seven words work well.A “typical” Affinity has 40–60 items; it is notunusual to have 100–200 ideas.3. Without talking: sort ideas simultaneously into5–10 related groupingsa) Move Post-it notes where they fit best for you;don’t ask, simply move any notes that you thinkbelong in another grouping.2Affinity Diagram 2008 GOAL/QPC
b) Sorting will slow down or stop when each personfeels sufficiently comfortable with the groupings.Tip Sort in silence to focus on the meaning behindand connections among all ideas, instead ofemotions and “history” that often arise in discussions.Tip As an idea is moved back and forth, try tosee the logical connection that the other personis making. If this movement continues beyond areasonable point, agree to create a duplicate Postit .Tip It is okay for some notes to stand alone. These“loners” can be as important as others that fit intogroupings naturally.4. For each grouping, create summary or headercards using consensusa) Gain a quick team consensus on a word orphrase that captures the central idea/themeof each grouping; record it on a Post-it note and 2008 GOAL/QPCAffinity Diagram3
place it at the top of each grouping. These aredraft header cards.b) For each grouping, agree on a concise sentencethat combines the grouping’s central idea andwhat all of the specific Post-it notes add to thatidea; record it and replace the draft version. Thisis a final header card.c) Divide large groupings into subgroups as needed and create appropriate subheaders.d) Draw the final Affinity Diagram connecting allfinalized header cards with their groupings.4Affinity Diagram 2008 GOAL/QPC
Tip Spend the extra time needed to do solid headercards. Strive to capture the essence of all of theideas in each grouping. Shortcuts here can greatlyreduce the effectiveness of the final Affinity Diagram.It is possible that a note within a groupingcould become a header card. However, don’tchoose the “closest one” because it’s convenient.The hard work of creating new header cards often leads to breakthrough ideas. 2008 GOAL/QPCAffinity Diagram5
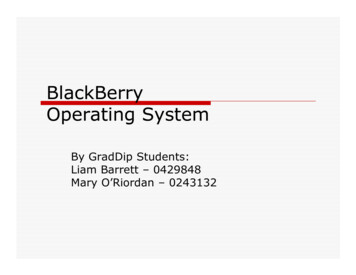
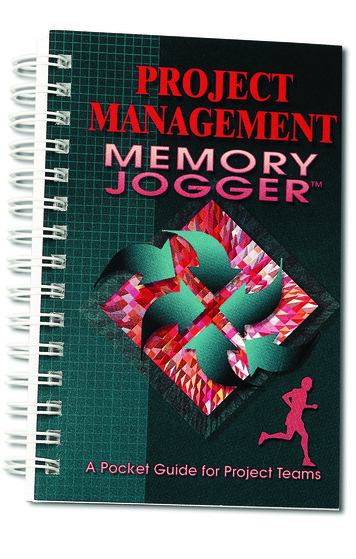
6Affinity DiagramPoor definition ofprioritization for marketintroductionFighting dailyproblems(alligator/swamp)Reconciliation withcorporate resourceallocationOwnership of plandoesn’t crossfunctional linesInformation providedcourtesy of GoodyearPlan is not linked tounit financial goalsUnrealistic goalscreate Blue SkyattitudeMeans not clearlydefinedPlanning approachnot standardizedPlan not integratedOur business planningapproach must be improvedRewards do notcompensate teamplayingGroup is not focalpoint for conflictresolutionCommunicationbetween functionalgroups difficultThem/usperceptionInsufficient teamapproach to newproduct developmentand introductionCommunication issueswithin the groupMore groupings on next pageGroup members notmaking individualcommitment to successof the planFunctional groups nottrusting each otherNo strong commitmentto the groupThe group could function moreeffectivelyAffinityIssues Surrounding Implementation ofthe Business Plan 2008 GOAL/QPC
2008 GOAL/QPCProduction capability tosupport changingrequirementsProduction capacitySales forecast isnot accurateCapacity may notmeet needsCapital availabilitylimits opportunitiesComplexity driven bycustomer demandsrequires addedinvestmentLack of time andresourcesFaster pace ofproductintroductionsstretchesresourcesLack integration ofsupport group plansFast new productintroductions stretchresourcesLimited resources are achallengeInformation providedcourtesy of GoodyearAffinityIssues SurroundingImplementation of theBusiness Plan (cont.)Note: The Affinity helped the team bring focus to the manyopinions on business planning. The headers that surfacedbecame the key issues in the ID example (shown in the ID toolsection).Affinity Diagram7
BrainstormingCreating bigger& better ideasWhy use it?To establish a common method for a team to creativelyand efficiently generate a high volume of ideas onany topic by creating a process that is free of criticismand judgment.What does it do? Encourages open thinking when a team is stuckin “same old way” thinking Gets all team members involved andenthusiastic so that a few people don’t dominatethe whole group Allows team members to build on eachother’s creativity while staying focused on theirjoint missionHow do I do it?There are two major methods for brainstorming. Structured. A process in which each teammember gives ideas in turn. Unstructured. A process in which team membersgive ideas as they come to mind.Either method can be done silently or aloud.8BrainstormingAffinity Diagram 2008 GOAL/QPC
Structured1. The central brainstorming question is stated,agreed on, and written down foreveryone to seeBe sure that everyone understands the question,issue, or problem. Check this by asking one ortwo members to paraphrase it before recording iton a flipchart or board.2. Each team member, in turn, gives an idea. Noidea is criticized. Ever!With each rotation around the team, any membercan pass at any time. While this rotation processencourages full participation, it may also heightenanxiety for inexperienced or shy team members.3. As ideas are generated, write each one inlarge, visible letters on a flipchart or otherwriting surfaceMake sure every idea is recorded with the samewords of the speaker, don’t interpret or abbreviate.To ensure this, the person writing should alwaysask the speaker if the idea has been worded accurately.4. Ideas are generated in turn until each personpasses, indicating that the ideas (or members)are exhaustedKeep the process moving and relatively short—5 to 20 minutes works well, depending on howcomplex the topic is.5. Review the written list of ideas for clarity and todiscard any duplicatesDiscard only ideas that are virtually identical. It isoften important to preserve subtle differences thatare revealed in slightly different wordings. 2008 GOAL/QPCBrainstorming9
UnstructuredThe process is the same as in the structured methodexcept that ideas are given by everyone at any time.There is no need to “pass” since ideas are not solicitedin rotation.VariationsThere are many ways to stimulate creative teamthinking. The common theme among all of them isthe stimulation of creativity by taking advantage ofthe combined brain power of a team. Here are threeexamples:Visual brainstorming. Individuals (or the team)produce a picture of how they see a situationor problem.Analogies/free-word association. Unusual connections are made by comparing the problem toseemingly unrelated objects, creatures, or words.For example: “If the problem was an animal,what kind would it be?”6-3-5 method. This powerful, silent method isproposed by Helmut Schlicksupp in his bookCreativity Workshop. It is done as follows:a) Based on a single brainstorming issue, eachperson on the team (usually 6 people) has 5minutes to write down 3 ideas on a sheetof paper.b) Each person then passes his or her sheet ofpaper to the next person, who has 5 moreminutes to add 3 more ideas that build on thefirst 3 ideas.10Brainstorming 2008 GOAL/QPC
c) This rotation is repeated as many times asthere are team members, e.g., 6 team members 6 rotations, 6 sheets of paper, 18 ideasper sheet.This interesting process forces team members toconsciously build on each other’s perspectivesand input. 2008 GOAL/QPCBrainstorming11
Cause & Effect/Fishbone DiagramFind & cure causes,NOT symptomsWhy use it?To allow a team to identify, explore, and graphicallydisplay, in increasing detail, all of the possible causesrelated to a problem or condition to discover its rootcause(s).What does it do? Enables a team to focus on the content of theproblem, not on the history of the problem ordiffering personal interests of team members Creates a snapshot of the collective knowledgeand consensus of a team around a problem. Thisbuilds support for the resulting solutions Focuses the team on causes, not symptomsHow do I do it?1. Select the most appropriate cause &effect format.There are two major formats: Dispersion Analysis Type is constructedby placing individual causes within each“major” cause category and then asking ofeach individual cause “Why does this cause(dispersion) happen?” This question is repeatedfor the next level of detail until the team runsout of causes. The graphic examples shownin Step 3 of this tool section are based on thisformat.12C &nityE / FishboneAffiDiagram 2008 GOAL/QPC
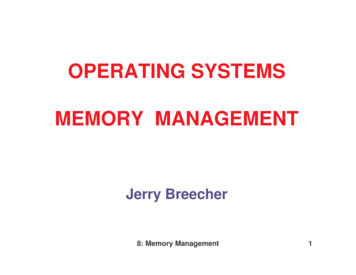
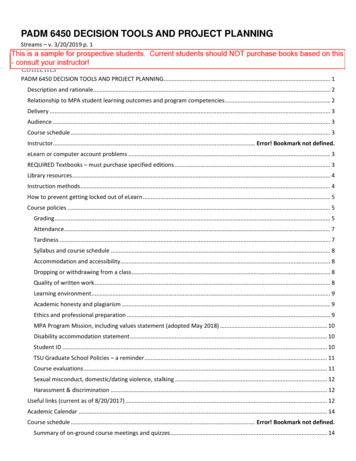
Process Classification Type uses the majorsteps of the process in place of the major causecategories. The root cause questioning processis the same as the Dispersion Analysis Type.2. Generate the causes needed to build a Cause &Effect Diagram. Choose one method: Brainstorming without previous preparation Check Sheets based on data collected by teammembers before the meeting3. Construct the Cause & Effect/Fishbone Diagrama) Place the problem statement in a box on theright hand side of the writing surface. Allow plenty of space. Use a flipchart sheet,butcher paper, or a large white board. A papersurface is preferred since the final Cause &Effect Diagram can be moved.Causes“Bones”(Major cause categories)EffectLate pizzadeliveries onFridays &SaturdaysTip Make sure everyone agrees on the problemstatement. Include as much information as possibleon the “what,” “where,” “when,” and “how much”of the problem. Use data to specify the problem.b) Draw major cause categories or steps in the production or service process. Connect them to the“backbone” of the fishbone chart. 2008 GOAL/QPCC & E / Fishbone13
Be flexible in the major cause “bones” that areused. In a Production Process the traditionalcategories are: Machines (equipment), MethodsMachinery/EquipmentPeopleLate pizzadeliveries onFridays &SaturdaysMethodsMaterialsIllustration Note: In a Process Classification Typeformat, replace the major “bone” categories with:“Order Taking,” “Preparation,” “Cooking,” and “Delivery.”(how work is done), Materials (componentsor raw materials), and People (the humanelement). In a Service Process the traditionalmethods are: Policies (higher-level decisionrules), Procedures (steps in a task), Plant(equipment and space), and People. In bothtypes of processes, Environment (buildings,logistics, and space), and Measurement(calibration and data collection) are alsofrequently used. There is no perfect set or numberof categories. Make them fit the problem.c) Place the brainstormed or data-based causes inthe appropriate category. In brainstorming, possible causes can be placedin a major cause category as each is generated,or only after the entire list has been created.Either works well but brainstorming the wholelist first maintains the creative flow of ideaswithout being constrained by the major causecategories or where the ideas fit in each “bone.”14C & E / Fishbone 2008 GOAL/QPC
Machinery/EquipmentPeopleUnreliablecarsOvenstoo smallPoorhandling oflarge ordersMethodsPeople don’tshow upDriversget lostPoordispatchingLate pizzadeliveriesonFridays &SaturdaysRun out ofingredientsMaterials Some causes seem to fit in more than onecategory. Ideally each cause should be in onlyone category, but some of the “people” causesmay legitimately belong in two places. Placethem in both categories and see how they workout in the end.Tip If ideas are slow in coming, use the major causecategories as catalysts, e.g., “What in ‘materials’ iscausing . . . ?”d) Ask repeatedly of each cause listed on the“bones,” either: “Why does it happen?” For example, under“Run out of ingredients” this question wouldlead to more basic causes such as “Inaccurateordering,” “Poor use of space,” and so on. “What could happen?” For example, under“Run out of ingredients” this questionwould lead to a deeper understanding of theproblem such as “Boxes,” “Prepared dough,”“Toppings,” and so on. 2008 GOAL/QPCC & E / Fishbone15
16C & E / Fishbone 2008 GOAL/QPCMethodsDon't knowtownHighturnoverPoordispatchingMany new streetsPoortrainingPoor useof spaceLack of experienceHigh turnoverPoor handling oflarge ordersHigh turnoverOvens too smallNo capacity forpeak periodsMaterialsRun out of ingredientsHigh turnoverPoor useof spaceInaccurateorderingLack oftrainingwrongPoor training GetinformationDrivers get lostRushedPeopleLate pizzadeliveries onFridays &SaturdaysUnreliable carsNo teamworkLow payNo trainingNo money for repairsDon't know townPeople don't show upKids own junksLow payHighturnoverHigh turnoverMachinery/Equipment
Tip For each deeper cause, continue to push fordeeper understanding, but know when to stop. Arule of thumb is to stop questioning when a cause iscontrolled by more than one level of managementremoved from the group. Otherwise, the processcould become an exercise in frustration. Use common sense.e) Interpret or test for root cause(s) by one or moreof the following: Look for causes that appear repeatedly withinor across major cause categories. Select through either an unstructured consensusprocess or one that is structured, such asNominal Group Technique or Multivoting. Gather data through Check Sheets or otherformats to determine the relative frequencies ofthe different causes.VariationsTraditionally, Cause & Effect Diagrams have been created in a meeting setting. The completed “fishbone” isoften reviewed by others and/or confirmed with datacollection. A very effective alternative is CEDAC , inwhich a large, highly visible, blank fishbone chart isdisplayed prominently in a work area. Everyone postsboth potential causes and solutions on Post-it notesin each of the categories. Causes and solutions arereviewed, tested, and posted. This technique opens upthe process to the knowledge and creativity of everyperson in the operation. 2008 GOAL/QPCC & E / Fishbone17
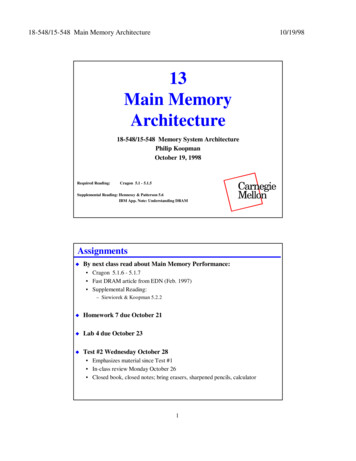
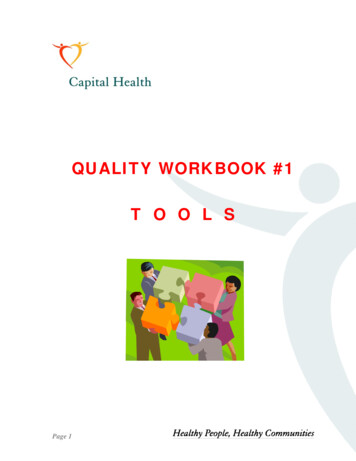
18C & E / FishbonePhysician didnot write orderPatient arrivestoo earlyInappropriateER admittanceHospital proceduresPhysician misuse –inpatientReservationunawareUnit switch bedPatient waitsfor bedNot usedpending dischargeUnit clerk unawareof discharge or transferShift changeNot toldOn breakNot enteredCommunicationDelayedentryAdmitting unawarebed is cleanToo busySandbagDouble roomsManytransfersSpecialty bedsCardiac monitorsThink it will takemore timeNeed more trainingNo trustNot usedNot enteredFunctions not usefulSystem incorrectMachine (PCIS)Discharged patientdid not leaveWait for rideWait for lunchWait for resultsCall housekeepingtoo lateCall housekeepingtoo earlyWait for MDCall housekeepingwhen cleanTransfer too earlyfrom another hospitalUnit clerk trainingMD proceduresMedicineadmit quotaTimingUnit clerk staffingNursing shortageResourcesCause & Effect/FishboneBed Assignment DelayInformation provided courtesy ofRush-Presbyterian-St. Luke’s Medical Center 2008 GOAL/QPC
2008 GOAL/QPCMethodsShows pins on benchCasting ties/pliersC & E / FishboneDesignToolsplug-in sideUsing wrong toolsBitsNot enoughImproper sizesNew tools - long lead timeGaugesBackplane mountingHeavy/AwkwardMount to frameGaugingStorageDamaged connectorPlacement Improperpins on benchinsertionBent pinsGeneral handlingIn/Out of BoxesRepairTestStorageScrews come looseDamaged connectorsTest fixturesStorageDamaged connectorsNo Stiffener PlatesBad panelLack ofalignment – bareAssembly difficultyfixturesDesigner not on siteNot Enough UniversalDesigner can't reactto problems2 backplanesLarge part #Mylar tapeHandlingScribe slipsPlacementon edges eRetainerLarge part # insertionLack of attentionNo/Don't LikeOn-the-job trainingFixtures004 prep VANo FixtureNot designed formanufacturingPeopleCauses for Bent Pins (Plug-In Side)Cause & Effect/FishboneInformation provided courtesy of AT&T19
CharterFraming the projectWhy use it?To obtain an agreement between management andproject team members about what the team will accomplish.What does it do? Clarifies what is expected of the team Keeps the team focused Keeps the team aligned withorganizational priorities Transfers ownership of the project from theleadership team and sponsor(s) to theproject teamHow do I do it?Some charters are long and detailed; others are shortand concise. All charters should include the elementslisted below. Complete the six steps outlined below tocreate your charter.1. Develop an overview of the purpose ofyour project The purpose describes the problem oropportunity your team is addressing. The purpose answers the question “What iswrong?” Focus on what the team’s goals are. The purpose should not include assumptionsabout causes of the problem or possiblesolutions.20CharterAffinity Diagram 2008 GOAL/QPC
Additional questions to ask include thefollowing:– What is important to customers about ourproduct or service?– What problems do customers have with ourproduct or service?– What problem is our team addressing?2. Develop one or more statements about why it isimportant to work on this project Describe the business case for the project:– Why is it important to customers?– Why is it important to our business?– Why is it important to employees?– Why should it be worked on now? Estimate the project’s potential impact on yourbusiness or the potential opportunity it cancreate.– Rough figures are OK. Additional questions to ask include thefollowing:– How will the reduction of defects impact ourcustomers? The business? The employees?Tip Before they can fully commit to and supporta project, the sponsors need to have at least arough estimate of the project’s business impact.They then have the opportunity to either buyinto the project or suggest revisions in scope ordirection that will improve the project’s impact. 2008 GOAL/QPCCharter21
3. Identify the focus, or scope, of the project. Scopedoes the following: Identifies the boundaries of the team’s work:the start and end points of the process the teamis improving, the stage at which project teammembers begin their work, and the stage atwhich their work ends. Clarifies decision-making authority. Clarifies budgetary limits. Clarifies what is within the team’s area ofinfluence—as well as what is outside that area. Includes the project’s schedule and milestones. Includes identifying checkpoints, or “tollgates,”as reminders for the team to check with thesponsors at each major milestone. Additional questions to ask include thefollowing:– How will the team focus its work?– What information will you collect to identifyurgent problems?– What specific parts of the process will youfocus on?4. Determine the specific deliverables to be producedduring the project The final deliverable goes to the customers ofthe project. This deliverable can be a product, service,process, or plan. A deliverable can be regarded as somethingthat must be in place before changes can beaccomplished.22Charter 2008 GOAL/QPC
The types of deliverables for most projects arevery similar. They include:– Process changes.– Training.– Documentation.– Other processes and procedures formaintaining gains.5. Define the measures or other indicators that willbe used to (a) judge the success of the project and(b) identify ways to improve performance at a laterdate These measures/indicators do the following:– Establish a baseline of performance.– Are used to track progress.– Are used to judge the project’s success.If possible, identify the target and specifications foreach measure.Additional questions to ask include:– How much improvement is needed?– What defects will you be tracking?6. Determine the resources available to the teamThese resources consist primarily of the people whoare available to join the team and do its work.– Include how much time they can spend on theproject.– If they cannot be on the team, state thecircumstances under which they can be involvedwith the project.You can also include people who are not membersof the team but might be called upon by the teamfor additional information and expertise. 2008 GOAL/QPCCharter23
Additional questions to ask include:– To whom is the team accountable?– Who is the team leader?– To whom can the team turn for expert guidanceand coaching?– Has the process owner been identified?Tip Every project needs a charter! If your sponsor hasnot provided it, then create one and get it approved.Tip Write the charter in such a way that someonecompletely unfamiliar with the project couldread it and understand what the project involvesand why you are working on it.Tip Most projects evolve; during each step, youlearn more about what is really going on. Beopen to revisiting the scope, definition, and purpose of your project. Check with your sponsorbefore making any substantive changes.24Charter 2008 GOAL/QPC
Check SheetA1 2 Total7B 7Counting &accumulating dataC 3Why use it?To allow a team to systematically record and compiledata from historical sources, or observations as theyhappen, so that patterns and trends can be clearly detected and shown.What does it do? Creates easy-to-understand data that come froma simple, efficient process that can be applied toany key performance areas Builds, with each observation, a clearer pictureof “the facts” as opposed to the opinions of eachteam member Forces agreement on the definition of eachcondition or event (every person has to belooking for and recording the same thing) Makes patterns in the data becomeobvious quicklyHow do I do it?1. Agree on the definition of the events or conditionsbeing observed If you are building a list of events or conditionsas the observations are made, agree on theoverall definition of the project.Example: If you are looking for reasons for latepayments, agree on the definition of “late.” 2008 GOAL/QPCAffinityDiagramCheckSheet25
If you are working from a standard list of eventsor conditions, make sure that there is agreementon the meaning and application of each one.Example: If you are tracking sales calls fromvarious regions, make su
The Lean Sigma Memory Jogger is designed for you to use as a convenient and quick reference guide on the job. Put your fi nger on any tool within seconds! . in advanced statistics and project management. Emphasis on the DMAIC approach (defi ne, me