Transcription
Evaluating a Large-Scale Educational AssessmentPsychometric EvidenceH. Swaminathan, H. J. Rogers, UCONN, 20161
Questions from Committee Members What is test validity? Is SBAC valid, if so why and if not why not? What is test reliability? Is SBAC reliable, if so why and if not why not? Each year the students are tested on that grade's material orconcepts. Can students be compared as to whether they madeprogress based on that one test since the test the year before wasdifferent? If a student scores in the below standard category in third grade, forexample, isn't it possible that he might still score in the belowstandard category in fourth grade even if he made a year's worth ofgrowth?H. Swaminathan, H. J. Rogers, UCONN, 20162
Theoretical Framework for Tests Educational assessments are designed to measure students’ overallproficiency in domains (e.g., subject areas) of interest Scores on the assessments are one piece of information used to makedecisions about students, teachers, and schools/districts The two most important properties of a test score are validity andreliabilityH. Swaminathan, H. J. Rogers, UCONN, 20163
Test Score Validity Validity refers to the degree to which interpretations of test scoresare supported by theory and evidence (AERA/APA/NCME TestStandards) Instead of asking, “Is the test valid?”, the appropriate question is, “Isthis a valid use or interpretation of the test scores?”H. Swaminathan, H. J. Rogers, UCONN, 20164
Test Score Validity Validity is not an all-or-none property Validity evidence is gathered from a variety of sources to support theuse of test scores for a particular purpose An argument is made that the test scores can reasonably beinterpreted in the intended manner Establishing that a particular use of test scores is valid requires cleararticulation of the claims that are being made about the scoresH. Swaminathan, H. J. Rogers, UCONN, 20165
Validity Evidence The primary types of validity evidence are Evidence based on test content Evidence based on response processes Evidence based on internal structure Evidence based on relations to other variablesH. Swaminathan, H. J. Rogers, UCONN, 20166
Validity Evidence for SBAC(see detailed technical report) Evidence based on test content Alignment studies were performed to show how the content ofthe assessment matches the Common Core standards Evidence based on response processes Think-aloud protocols were used during pilot testing to assesswhether items measured the intended cognitive skillsH. Swaminathan, H. J. Rogers, UCONN, 20167
Validity Evidence for SBAC Evidence based on internal structure Dimensionality analyses were performed to confirm that theassumption of a unidimensional construct within and acrossgrades is reasonableH. Swaminathan, H. J. Rogers, UCONN, 20168
Validity Evidence for SBAC Evidence based on relations with other variables The correlation between scores on the CMT (2013) and the SBAC operationaltest (2015) for students in Grades 3 through 6 shows that the SBAC test scorescorrelate almost as highly with CMT scores as CMT scores two years apartELAGradeCMT G3CMT G4CMT G5CMT G6MATHCMT 20.820.840.83SBAC0.780.750.760.76GradeCMT G3CMT G4CMT G5CMT G6CMT 20.800.850.83H. Swaminathan, H. J. Rogers, UCONN, 2016SBAC0.780.800.810.829
Validity Evidence for SBAC Other evidence that supports a validity argument: Rigorous and well-documented test construction procedures Adequate measurement precision Appropriate test administration procedures Appropriate scoring procedures Appropriate scaling and equating procedures Appropriate standard setting procedures Adequate investigation of fairness to different subgroups Adequate test securityH. Swaminathan, H. J. Rogers, UCONN, 201610
Measurement Error in Test Scores The objective of measurement is to measure what we want tomeasure (the “true” value) appropriately and with minimum error The Standard Error of Measurement quantifies the amount of errorin a test scoreH. Swaminathan, H. J. Rogers, UCONN, 201611
Measurement Error in Test ScoresStandard Error of Measurement (SEM) Indicates the amount of error to be expected in using the test scoreas an estimate of a student’s “true” proficiency Provides us with an error band for a student’s true proficiencyFor example, we can be 95% confident that a student’s true scoreis in the rangeObserved Score 2 SEMH. Swaminathan, H. J. Rogers, UCONN, 201612
Measurement Error in Test ScoresStandard Error of Measurement (SEM) Depends on the score scale, and is therefore difficult to compareacross tests that use different score scales Can be re-expressed in terms of RELIABILITY, which is between zeroand one regardless of the score scaleH. Swaminathan, H. J. Rogers, UCONN, 201613
Test Score Reliability The reliability Index, 𝜌, is defined as the correlation between theobserved score and the true score or between scores on parallelforms of a test (i.e., tests that are equivalent in all respects) Reliability refers to the test score, not to the test itself Reliability of 0 denotes totally unreliable test scores; reliability of 1denotes perfectly reliable test scores We can express SEM in terms of Reliability and vice versa: if testscores are perfectly reliable, 𝜌 1 and SEM 0 Reliability is necessary but not sufficient for validityH. Swaminathan, H. J. Rogers, UCONN, 201614
Test Score Reliability1. Administering the same test to everyone does not guaranteescore reliability2. Low performing students will not be able to answer difficult itemsand for these students their true score will be poorly estimated, i.e.,the error of measurement will be large; similarly, true scores for highperforming students will be poorly estimated if the items are tooeasy for them3. Tests made up of suitable items for each group of students willprovide more reliable scoresH. Swaminathan, H. J. Rogers, UCONN, 201615
Problems with Classical Test Framework Reliability and hence Standard Error of Measurement are defined interms of parallel tests, which are almost impossible to realize inpractice Item statistics (e.g., difficulty) based on classical test theory aregroup dependent, i.e., they change as the groups change Proficiency scores are test dependent: we cannot compare the testscores of individuals who have taken different sets of test itemsH. Swaminathan, H. J. Rogers, UCONN, 201616
Problems with Classical Test FrameworkIt would be better if SEM is not defined in terms of parallel forms of the test, but definedfor individual test takers Item indices did not depend on the characteristics of the individualson whom the item data were obtained Student proficiency measures did not depend on the characteristicsof the items that were administeredH. Swaminathan, H. J. Rogers, UCONN, 201617
Item Response Theory Framework Item response theory is based on the postulate that the probabilityof a correct response to an item depends on the proficiency value ofthe student and the characteristics of the item An examine with a high proficiency value will have a high probabilityof answering the item correctly; a student with a low proficiencyvalue has a low probability of answering the item correctly The relationship between the probability of a correct responsedepends on the characteristics of the items and the proficiencyvalue of the studentH. Swaminathan, H. J. Rogers, UCONN, 201618
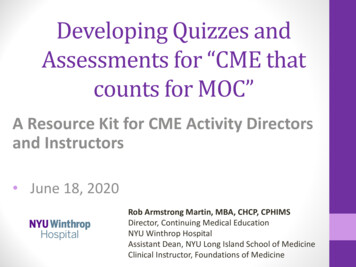
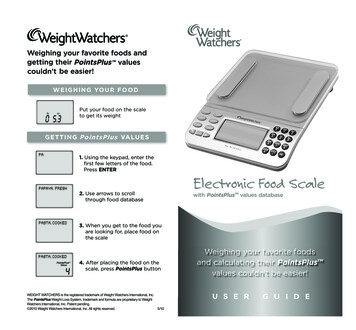
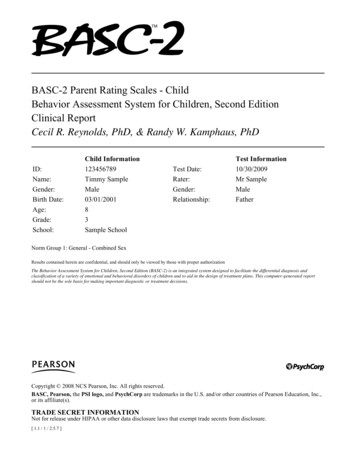
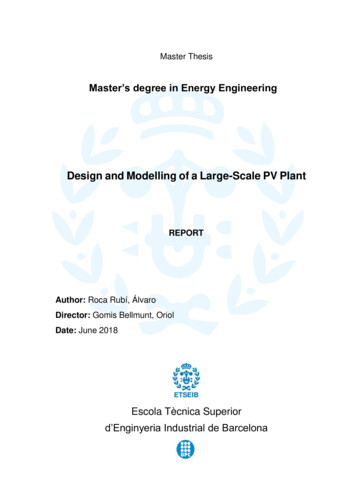
The Item Response Model The mathematical relationship between the probability of aresponse, the proficiency value of the student, and thecharacteristics of the item is specified by the ITEM RESPONSEMODEL Most common models: One-parameter or Rasch model Two-parameter model Three-parameter modelH. Swaminathan, H. J. Rogers, UCONN, 201619
One-Parameter Model Item Response Functions1.0Probability of Correct Response0.90.80.7b 00.60.50.4b -1b 10.30.20.10.0-3-2-10123Proficiency ScoreH. Swaminathan, H. J. Rogers, UCONN, 201620
Two-Parameter Model Item Response Functions1.00.90.80.7b -1,a a 1.0b -1,1b 0, a 1.60.60.50.40.3b 1, 0.7b 0,a a1.60.20.10.0-3-2-10123Proficiency scoreH. Swaminathan, H. J. Rogers, UCONN, 201621
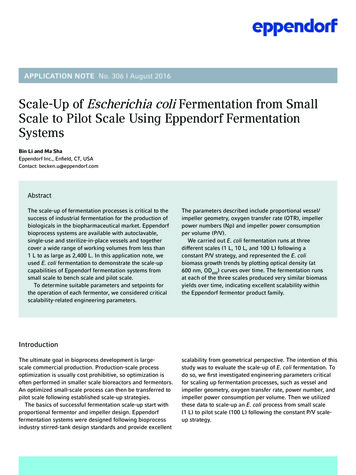
Three-Parameter Model Item Response Functions1.0Probability of Correct Response0.90.80.7b -1, a 1, c 0b 0, a 1.6, c 0.20.60.50.40.3b 1, a 0.7, c 0.10.20.10.0-3-2-10123Proficiency ScoreH. Swaminathan, H. J. Rogers, UCONN, 201622
Advantages of Item Response Theory The proficiency score of a student is not tied to the specific items weadminister We CAN compare the proficiency scores of students who have takendifferent sets of test items We can therefore match items to a student’s proficiency andmeasure proficiency value more precisely with shorter testsH. Swaminathan, H. J. Rogers, UCONN, 201623
Advantages of Item Response Theory We can create a bank of items by administering different items todifferent groups of students at different times (Vertical Scales forGrowth Assessment) This will allow us to administer comparable tests or individuallytailored tests to students (Computer Adaptive Testing) By administering different items to different individuals or groups wecan improve test security and minimize cheatingH. Swaminathan, H. J. Rogers, UCONN, 201624
How Is IRT Used In Practice? Test construction Equating of test forms Vertical scaling (for growth assessment) Detection of differential item functioning Adaptive testingH. Swaminathan, H. J. Rogers, UCONN, 201625
Test Construction Items can be selected to maximize precision of measurement, i.e.,small SEM (high reliability) in desired regions of the proficiencycontinuum (such as at cut scores) By selecting items that have optimal properties, we can create ashorter test that has the same degree of precision as a longer test We can tailor (customize) a test that is appropriate for a student By tailoring the test and choosing the appropriate items toadminister, we minimize testing time and estimate a student’sproficiency value efficientlyH. Swaminathan, H. J. Rogers, UCONN, 201626
Computerized Adaptive Testing (CAT) Adaptive testing is the process of tailoring the test items to matchthe best current estimate of a student’s proficiency value Items are most informative when their difficulty is close to thestudent’s proficiency value Different students take different tests Only through IRT can items be appropriately selected, proficiencyvalues estimated after each item or a set of items is administered,and the resulting test scores comparedH. Swaminathan, H. J. Rogers, UCONN, 201627
Advantages of CAT Testing time can be shortened Students’ trait values can be estimated with a desired degree ofprecision Scoring and reporting can be immediate Scoring errors and loss of data are reduced Test security is preserved (in theory) Paper use is eliminated Need for supervision is reducedH. Swaminathan, H. J. Rogers, UCONN, 201628
Reliability Evidence for SBAC Proficiency Scores Reliability of SBAC test scores compared with CMT scoresELAGradeCMT TestSBAC TestCMTSBACLengthLengthreliabilityreliability(# of items)(# of .940.928790.950.9242-46H. Swaminathan, H. J. Rogers, UCONN, 20160.9129
Reliability Evidence for SBAC Proficiency Scores Reliability of SBAC test scores compared with CMT scoresMATHGradeCMT TestSBAC TestCMTSBACLengthLengthreliabilityreliability(# of items)(# of 200.970.9181170.970.9237-40H. Swaminathan, H. J. Rogers, UCONN, 20160.9330
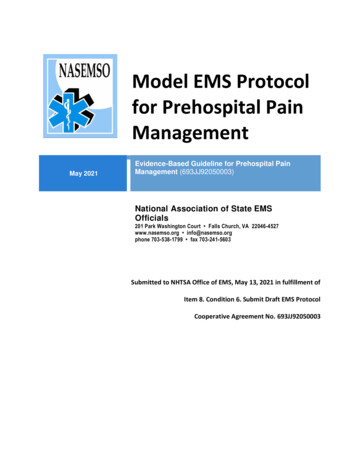
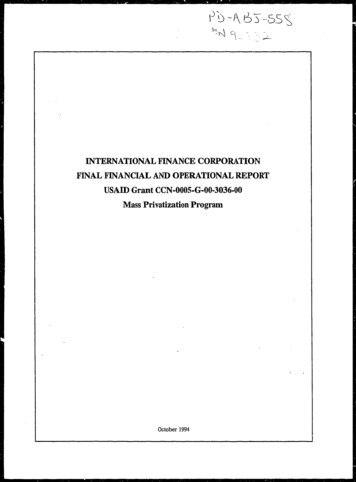
Growth Assessment and Vertical Scales In developing a vertical scale, sets of common items are administeredto students in adjacent grades Through these common items, items in adjacent grades are placed ona common proficiency scale using IRT methods Items are designed so that there is sufficient overlap of items acrossgradesH. Swaminathan, H. J. Rogers, UCONN, 201631
Growth Assessment and Vertical Scales Plot of SBAC item difficulty across grades: ELAH. Swaminathan, H. J. Rogers, UCONN, 201632
Growth Assessment and Vertical Scales Plot of SBAC item difficulty across grades: MATHH. Swaminathan, H. J. Rogers, UCONN, 201633
Growth Assessment and Vertical Proficiency Scale The proficiency score obtained is a general measure of proficiency Growth in proficiency can be assessed using the items that are on acommon scale across grades The same items need not be administered since the IRT-basedproficiency scores do not depend on the items administered The same procedure was used with the CMT vertical scale forassessing growth; the only difference is that the CMT was notadaptively administeredH. Swaminathan, H. J. Rogers, UCONN, 201634
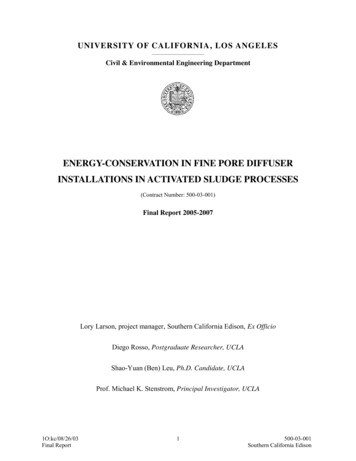
Growth Assessment and Achievement Level Categories It is possible that a student has grown, but remains in the sameAchievement Level Category from one grade to the next This is one of the reasons states wanted a growth scale that is moresensitive to student growth The vertical scale provides a measure of growth on the IRT proficiencyscaleH. Swaminathan, H. J. Rogers, UCONN, 201635
Vertical Scale Growth Model: ELAH. Swaminathan, H. J. Rogers, UCONN, 201636
SummaryThe test development procedures used by SBAC provide sufficientevidence that the test scores can validly be used as measures of overall proficiency the proficiency scores obtained through the CAT administration arereliable the IRT proficiency scores based on the vertical scale can be used tomeasure growth in proficiency across gradesH. Swaminathan, H. J. Rogers, UCONN, 201637
The correlation between scores on the CMT (2013) and the SBAC operational test (2015) for students in Grades 3 through 6 shows that the SBAC test scores correlate almost as highly with CMT scores as CMT scores two years apart ELA MATH H. Swaminathan, H. J. Rogers, UCONN, 2016 9 Validity Evidence for SBAC Grade CMT 2 SBAC CMT G3 0.82 0.78