Transcription
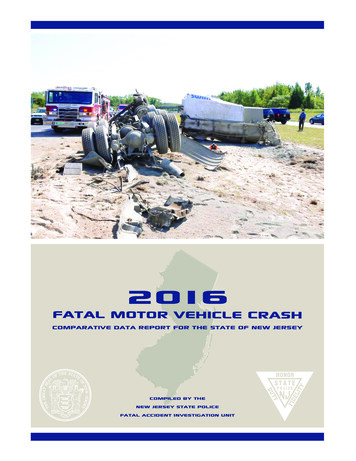
2016Fatal Motor Vehicle CRASHComparative Data Report FOR THE STATE OF NEW JERSEYCOMPILED BY THENEW JERSEY STATE POLICEFATAL ACCIDENT INVESTIGATION UNIT
CHRIS CHRISTIEGovernorKIM GUADAGNOLt. GovernorOFFICE OF THE ATTORNEY GENERALDEPARTMENT OF LAW AND PUBLIC SAFETYDIVISION OF STATE POLICECHRISTOPHER S. PORRINOPOST OFFICE BOX 7068WEST TRENTON, NJ08628-0068(609) 882-2000COLONEL PATRICK CALLAHANAttorney GeneralActing SuperintendentDear Reader:During 2016, New Jersey once again saw an increase in fatal motor vehicle crashes. Nationwide, thepreliminary data indicate that motor vehicle fatalities increased to a nine-year high. In 2016, New Jerseyrecorded 570 fatal collisions that resulted in 602 deaths. This is an increase of 48 motor vehiclecollisions and an increase of 40 deaths, which equates to 1.65 motor vehicle fatalities per day. The lawenforcement community and certain non-profit organizations will remain committed in theirrespective traffic and public safety efforts. Through enforcement and education of the motoringpublic, we will continue to work towards the reduction of motor vehicle fatalities on our roadways.As traffic-related deaths continue to be the leading cause of death in New Jersey and the nation, wemust continue our efforts in traffic safety awareness. In 2016, the recorded nationwide death toll onour roadways was 37,461 fatalities. This is an approximate increase of 5.6% from 2015. Althoughthere was an increase in fatal crashes involving intoxicated drivers in 2016, the law enforcementcommunity reaffirms its commitment to enforcing traffic laws to reduce these occurrencesOn the following pages, you will find statistics concerning this past calendar year’s fatal motorvehicle crashes. The information was compiled by the Fatal Accident Investigation Unit within theDivision of State Police. This report constitutes a detailed look at the causes and results of fatalcrashes throughout the state during 2016. With the continued efforts and cooperation of the public, andfederal, state and local agencies, I am convinced that our traffic safety records will continue toimprove in the years ahead.Sincerely,Patrick J. CallahanColonel"An Internationally Accredited Agency"New Jersey Is An Equal Opportunity EmployerPrinted on Recycled Paper and Recyclable
TABLE OF CONTENTSSTATISTICAL SUMMARY2016. .Quick. . . . Facts.2016. .Motor. . . . Vehicle. . . . . . Fatal. . . . Crashes. . . . . . .and. . .Fatalities. . . . . . .with. . . a. .Comparison. . . . . . . . .of. .the. . 1997-2016. . . . . . . . .Crashes. . . . . . and. . . Fatalities.A.Crash. . Victim. . . . . Classification. . . . . . . . . . by. . .Month.B.Crashes. . . . and. . . Fatalities. . . . . . . by. . Month. . . . . of. . rashes. . . . by. . County. . . . . .of. .Occurrence. . . . . . . . .and. . .Roadway. . . . . . . Classification.E.Fatalities. . . . .and. . .Injuries. . . . . According. . . . . . . . to. .Crash. . . . .Type. . . .Classification.F.Hours. . of. . Occurrence.G.Weather. . . . Conditions.H.Day.of. .Occurrence.I.Age.of. .Driver. . . . .Victims.J.Age.of. .Pedestrian. . . . . . . .Victims.K.Sex .of. .Pedestrians.L.Condition. . . . .of. .All. .Drivers.M.Alcohol. . . Factor.Victim. . Alcohol. . . . . . Factor,. . . . . .2012-2016. . . . . . . . Comparison.Victim. . Alcohol. . . . . . Factors. . . . . . for. . .the. . Year. . . . 2016.N.Alcohol. . . Involvement. . . . . . . . . .of. Deceased. . . . . . . . Drivers. . . . . .Related. . . . . .to. .Manner. . . . . .of. .Collision.O.Manner. . . .of. Collision.P.Type. .of. Vehicles. . . . . . . Involved. . . . . . .(Including. . . . . . . Parked).Q.CharacterofRoad.R.Road. .Designation.S.Age.of. .Drivers.T.Sex .of. .Drivers.U.What. .Drivers. . . . . Were. . . . .Doing.V.What. .Pedestrians. . . . . . . . .Were. . . . Doing.W. Contributing. . . . . . .Circumstances. .1. .2. .3. .3. .4. .5. .6. .7. .7. .8. .8. .8. .9. .9.10.11.11.12.12.13.14.14.15.15.16.16.17.SPECIFIC AREAS OF CONCERNInterstate. . . . .Highway. . . . . . .Fatalities. . . . . . . . . . . . . . . . . . . . . . . . . . . . . . . . . . . . . . . . . . . . . . . . . . . . . . . . . . . . . . . . .19.Pedalcycle. . . . . .Crashes. . . . . . . . . . . . . . . . . . . . . . . . . . . . . . . . . . . . . . . . . . . . . . . . . . . . . . . . . . . . . . . . . . . . . . .20.Motorcycle. . . . . .Crashes. . . . . . . . . . . . . . . . . . . . . . . . . . . . . . . . . . . . . . . . . . . . . . . . . . . . . . . . . . . . . . . . . . . . . . .21.Tractor-Trailer. . . . . . . . Crashes. . . . . . . . . . . . . . . . . . . . . . . . . . . . . . . . . . . . . . . . . . . . . . . . . . . . . . . . . . . . . . . . . . . . .22.Safety Equipment Usage. . . . . . . . . . . . . . . . . . . . . . . . . . . . . . . . . . . . . . . . . . . . . . . . . . . . . . . . . . . . . . . . . . . 2317 - .20. . Age. . . Group. . . . . . . . . . . . . . . . . . . . . . . . . . . . . . . . . . . . . . . . . . . . . . . . . . . . . . . . . . . . . . . . . . . . . . .24.Fatal. .Crashes. . . . . . and. . . Persons. . . . . . .Killed. . . . for. . .Selected. . . . . . Holiday. . . . . . Periods. . . . . . . . . . . . . . . . . . . . . . . . . . . . . . . . . . . . . . . .25.Ten .YearExperience26.Fatal. .Crash. . . . Investigation. . . . . . . . . . Summary. . . . . . . .by. .Troop. . . . . . . . . . . . . . . . . . . . . . . . . . . . . . . . . . . . . . . . . . . . . . . . . . .27.Fatal Crashes by County, Municipality, Date, Time and Location . . . . . . . . . . . . . . . . . . . . . . . . . . . . . . . . . . . 30Map - Fatalities By County . . . . . . . . . . . . . . . . . . . . . . . . . . . . . . . . . . . . . . . . . . . . . . . . . . . . . . . . . . . . . . . . . . 40
QUICK FACTSNationwide, the fatality rate increased to 1.18 fatalities per hundred million vehicle miles traveled, up from 1.15 in 2015.Nationwide preliminary statistics indicate there were 37,461 people killed.In New Jersey, there were 570 fatal crashes with 602 people killed.There was an increase of 48 fatal crashes and an increase of 40 fatalities.Of the fatalities, 28.6 % had consumed alcohol to some extent.Of all drivers, 12.1 % were legally intoxicated.An average of 1.64 persons were killed every day.There were 68 fatal crashes involving 70 motorcycles.Pedalcyclists accounted for 17 fatal crashes.The pedestrian death toll was 166.There were a total of 40 hit and run fatal crashes involving 60 vehicles. The victims were comprised of 4 drivers, 1passenger, 33 pedestrians and 2 pedalcyclists.Of the 832 drivers listed, 42 New Jersey drivers and 5 out-of-state drivers were suspended. There were 20 drivers withoutvalid licenses.There are 39,071 miles of public open roads in the state of New Jersey, indicating one death for every 64.8 miles.Straight roads were involved in 58.9 % of all fatal crashes.Of all fatal crashes, 85.4 % occurred during clear weather conditions.Of the known drivers involved in fatal crashes, 72.7 % were males.Of the vehicles involved in fatal crashes, 51.2 % involved passenger cars.There were 30 tractor-trailers involved in 28 fatal crashes which resulted in 29 fatalities.1
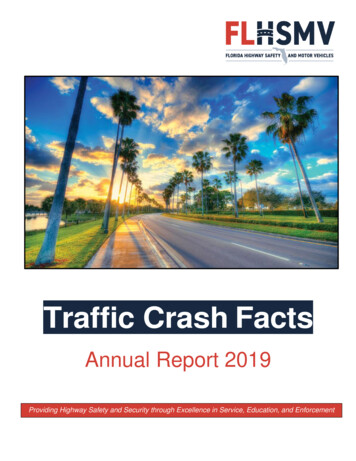
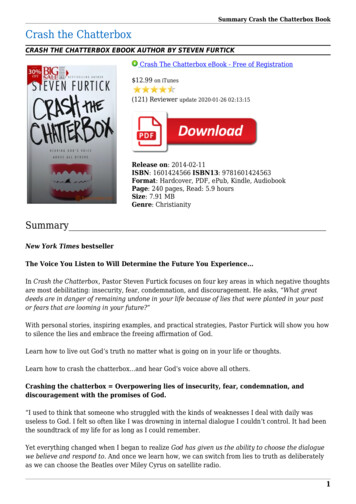
SUBJECTStatistical Summary of 2016 Motor Vehicle Fatal Crashes and Fatalities with a Comparison of the 2012-2016 Crashesand Fatalities.Statistics20122013201420152016Fatal ND IN FATALITIES20 Year 95900595844585566555422545625566 9'10'11'12'13'14'15'16
VICTIM CLASSIFICATION BY MONTH - mber310010121054Totals3318917166602CRASHES AND FATALITIES BY MONTH OF 5225705905425565626023
CRASH VICTIM CLASSIFICATION BY COUNTYVictim 5140Burlington4950315131Camden3839195141Cape 90Warren13159312TOTAL57060233089166174
CRASHES BY COUNTY OF OCCURRENCE AND ROADWAY Cape 010120304010107012040409010302060090Toll 2039221418122413570NOTE: US roadways are included in the State Highway column. Other roadways include State, County and Municipal Parks and Institutions and USGovernment Property.Breakdown in Percentages of 570 Crashes during 2016Other, 0.17%Toll Road, 9.47%Interstate, 7.01%Municipal, 15.79%State, 36.50%County, 31.06%Toll RoadStateMunicipalInterstate5CountyOther
FATALITIES AND INJURIES ACCORDING TO CRASH TYPE CLASSIFICATIONTotal CrashesTotal FatalitiesTotal 1281691771672618344638Other Motor 80Railroad Train010120201200044Parked 411181702051Animal133211332102010Fixed/Other 45374398In 2016 there were 570 fatal crashes in which 602 persons were killed and 398 persons injured.
HOURS OF OCCURRENCETime Of Occurrence2012201320142015201612:00 to 12:59 a.m.18171724181:00 to 1:59 a.m.22162722172:00 to 2:59 a.m.20131912233:00 to 3:59 a.m.20162014284:00 to 4:59 a.m.1218149255:00 to 5:59 a.m.1891810226:00 to 6:59 a.m.24252024287:00 to 7:59 a.m.17181417218:00 to 8:59 a.m.13121617179:00 to 9:59 a.m.142116231210:00 to 10:59 a.m.202012211311:00 to 11:59 a.m.181115162212:00 to 12:59 p.m.14222518241:00 to 1:59 p.m.23252123252:00 to 2:59 p.m.26203015243:00 to 3:59 p.m.24332732294:00 to 4:59 p.m.31262625215:00 to 5:59 p.m.38352330186:00 to 6:59 p.m.32203322427:00 to 7:59 p.m.34293137268:00 to 8:59 p.m.31262734399:00 to 9:59 p.m.332824313810:00 to 10:59 p.m.193026252411:00 to 11:59 p.m.3218222114553508523522570TOTALWEATHER 23% 1.05%4.56%7.72%Clear85.44%RainSnowFogOther7
DAY OF OCCURRENCEDay of 835089452392522104570AGE OF DRIVER VICTIMSNumber Killed2012201320142015201616 and under01010002Age 17020103040418 - 2021015020014015021 - 2442028026035033025 - 293503503103504430 - 3945044039033066040 - 4936039041037032050 - 6470058075059072065 and olderTOTAL570309830304600295590276620330Age Of DriverAGE OF PEDESTRIAN VICTIMSNumber KilledAge Of 01010310 - 14030104010215 - 19070406070620 - 24120150150080625 - 4442027041046048045 - 6454046060063054065 - 7421014019024021075 and 11668
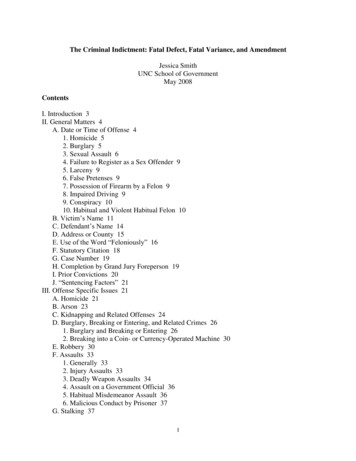
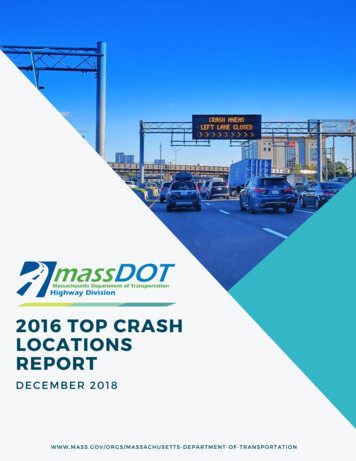
SEX OF PEDESTRIANSSexCONDITION OF ALL 27Male11793109117108Apparently Normal593Female4639615658Alcohol Use79Drug Use (Illicit)51TOTAL163132170173166Medication19Alcohol & Drug/Medication Use53Physical Handicaps0Illness7Fatigue2Fell Asleep1Other0TOTAL83220 YEAR TRENDIntoxicated Drivers Involved in Fatal Crashes200150 148150131140123 123116126116 114100142115115106105 41516
ALCOHOL FACTORThere were 602 fatalities during 2016. Of the fatalities, 330 were drivers, 89 were passengers, 166 werepedestrians and 17 were pedalcyclists. Of this total, 497 were tested for alcohol and 105 were not tested. Of the 497tested, 172 were positive for alcohol in varying degrees and 325 were negative. This indicates that 34.6 % of thefatalities tested were positive for alcohol and 65.4 % were negative. 78 drivers, 19 passengers, 35 pedestrians and 4pedalcyclists tested positive for drugs.In 151 of the 570 crashes, Driving While Intoxicated (alcohol and/or drugs) was listed as the major contributingfactor. There were 169 people killed as a result of these 151 crashes.1.) DRIVERS:Deceased: There were a total of 330 drivers killed of which 278 were tested for alcohol. Of those tested, 97 werepositive and 181 were negative, indicating 34.9 % had consumed an alcoholic beverage. Of the 97imbibing drivers, 77 or 79.4 % had an alcohol level of .08 % or higher.Surviving: There were a total of 502 surviving drivers of which 146 were tested for alcohol. Of those tested, 33were positive and 113 were negative, indicating 22.6 % had consumed an alcoholic beverage. Of the 33imbibing drivers, 24 or 72.7 % had an alcohol level of .08 % or higher.2.) Passengers: There were a total of 89 passengers killed of which 63 were tested for alcohol. Of those tested, 21were positive and 42 were negative, indicating 33.3 % had consumed an alcoholic beverage.3.) Pedestrians: There were a total of 166 pedestrians killed of which 144 were tested for alcohol. Of those tested, 51were positive and 93 were negative, indicating 35.4 % had consumed an alcoholic beverage.4.) Pedalcyclists: There were a total of 17 pedalcyclists killed of which 12 were tested for alcohol. Of those tested, 3were positive and 9 were negative, indicating 25.0 % had consumed an alcoholic beverage.SURVIVING DRIVER ALCOHOL FACTORSDrivers.01% - .03%.04% - .07%.08% - .10%.11% & overNegativeNo testTotal36816113356502EVALUATION:2016 showed a 21.1 % increase in alcohol-related fatalities. The number of fatal accident victims with blood alcoholreadings above the legal limit increased from 108 in 2015 to 132 in 2016, an increase of 22.2 %. Deceased drivers withalcohol involvement showed a 51.6 % increase when compared to 2015.ALCOHOL & DRUG USE:10 surviving drivers, 44 deceased drivers, 9 passengers, 16 pedestrians and 1 pedalcyclists tested positive for alcoholand drugs (Illicit & Medication).25 surviving drivers, 34 deceased drivers, 10 passengers, 19 pedestrians and 3 pedalcyclists tested positive for drugs(Illicit & Medication) alone.10
VICTIM ALCOHOL FACTOR 2012 - 2016 COMPARISON.01 % - .03 %.04 % - .07 %.08 % - .10 %2012 2013 2014 2015 2016 2012 2013 2014 2015 2016 2012 2013 2014 2015 100001001TOTAL221923182611101016141210131417.11 % and OverNegativeNo TestTOTAL2012 2013 2014 2015 2016 2012 2013 2014 2015 2016 2012 2013 2014 2015 2016 2012 2013 2014 2015 90542556562602TOTALThere were 136 victims that tested positive for drugs.VICTIM ALCOHOL FACTORS FOR THE YEAR 2016.01% - .03%.04% - .07%.08% - .10%.11% & overNegativeNo 61417115325105602LEGENDNEGATIVE: Tested and found to be negative for alcohol and drugs.NO TEST: No toxicology testing conducted.NOTE: 78 drivers, 19 passengers, 35 pedestrians and 4 pedalcyclists tested positive for drugs.
ALCOHOL INVOLVEMENT OF DECEASED DRIVERS RELATED TO MANNER OFCOLLISIONManner of Collision.01 - .07 %.08 % and above Alcohol & DrugsDrugs AloneAngle2533Same Direction - Rear End1731Opposite Direction - Head On/Angular1943Opposite Direction - Left/U-Turn2103Fixed Object10462721Pedestrian1000Railroad Train0000Pedalcycle0000Struck Parked Vehicle1010Overturned0531Other acking0000TOTAL20774434NOTE: Drivers that test positive for both alcohol and drug use are counted in both the appropriate BAC column and inthe Alcohol / Drugs column.MANNER OF COLLISIONManner of Collision - All Crashes20122013201420152016Angle5650394454Same Direction - Rear End3338542435Opposite Direction - Head On/Angular5655525656Opposite Direction - Left/U-Turn2223212028Fixed 0TOTAL553508523522570* Other categories include - Struck Parked Vehicle, Backing, Animal, Pedalcycle, Other Object and Railroad Train.12
TYPE OF VEHICLES INVOLVED (Including Parked)Fatal Crashes20122013201420152016Passenger Vehicle433426397413453Recreation Vehicle00000Taxicab / 75876Sport Utility Vehicle149112144139140Van96468Fire / Rescue00001Police Vehicle11474Ambulance20132Bus97839School Bus46646Single Unit 2-Axle1521242421Single Unit 3-Axle1718131610Truck / Trailer44102Truck (Bobtail)20102Semi-Trailer 0Heavy Truck01010Other4432485345TOTAL87479082981788513
CHARACTER OF ROADFatal CrashesRoad Character20122013201420152016Straight and Level269262295278296Straight and Grade4534453937Straight at Hillcrest97363Curve and Level5568555977Curve and Grade5635383227Curve at ersectionOtherTOTALROAD DESIGNATIONFatal CrashesRoad l100998610390Toll Roads5230483554Other20011553508523522570TOTALNOTE: US roadways are included in the State Highway column.*Other roadways include State, County and Municipal Parks.14
AGE OF DRIVERSFatal CrashesAge of Driver2012201316 and under42Age 17101018 - 205421 - 24201420152016137141336514449846766859625 - 298779879610130 - 3914812113310913140 - 4913612411411612050 - 6417114719816517665 and 6914832SEX OF DRIVERSFatal CrashesSex of 18191813TOTAL823752789769832* Unknown includes hit-and-run and parked vehicle crashes where driver information is not known or applicable.15
WHAT DRIVERS WERE DOINGFatal CrashesDriver Pre-Crash Action20122013201420152016Going Straight Ahead570524557523574Making Right Turn1078123Making Left Turn5855426274Making U Turn25231Starting From Parked11002Starting In Traffic1141158Slowing or Stopping1713211313Stopped in Traffic1921361920Parking10100Parked54382Changing Lanes1718141218Entering Traffic Lane25511Backing35464Driverless / Moving00001Passing1188118Negotiating Curve8876678394Driving on Shoulder51211Right Turn on WHAT PEDESTRIANS WERE DOINGFatal CrashesPedestrian Pre-Crash Action201220132014201520163822264133Crossing at Unmarked Crosswalk812191514Crossing Where Prohibited5555576166Other Pedestrian Action in Roadway3119333022Pedestrian Off Of Roadway846810Other Pedestrian Action2320291821TOTAL163132170173166Crossing at Marked Crosswalk16
CONTRIBUTING CIRCUMSTANCESContributing Circumstances20122013201420152016Unsafe Speed9882708379Driver Inattention175165190166217Failed to Obey Traffic Control3939273436Failed to Yield Right of Way5451375040Improper Lane Change669512Improper Passing635119Failed to Use Turn Signal00010Improper Turn45237Following Too Closely44232Unsafe Backing23362Improper Vehicle Lights30000Traveling Wrong Way68647Improper Parking10010Failure to Keep Right3348513940Other Driver Action2822272730Mechanical Failure62435Road / Environmental Factor569284Pedestrian Violation126101133129121Pedalcyclist Violation91071312605555582606623TOTALNOTE: In some crashes, alcohol and/or drug involvement may have contributed to the crash, however other drivingactions are the proximate cause of the crash. For a detailed analysis of alcohol and drug related crashes, see theAlcohol Factor Report on Page 10.17
SPECIFIC AREAS OF CONCERNINTERSTATE HIGHWAY FATALITIESThe Interstate Highway System of New Jersey is 100% completed, with 420.32 miles open to the motoring public.During 2016, the death rate averaged 5.42 deaths per month and 1 death for every 6.47 miles of highway. A conciseanalysis of victim classification, alcohol involvement, driver ages, contributing circumstances and manner of collisionis outlined on the following page.INTERSTATE HIGHWAY MILEAGEHighway NumberMileage OpenFatal Crashes by 66I-6764.751TOTAL420.3260I-95 includes sections of the New Jersey Turnpike.18
INTERSTATE HIGHWAY FATALITIES2016Interstate Fatal Crashes: 60Interstate Fatalities: 66Victim ClassificationAge of DriversDrivers3716 & under0Passengers15170Pedestrians1418 - 203Pedalcyclists021 - 2411TOTAL6625 - 292030 - 392340 - 4912Contributing CircumstancesUnsafe Speed350 - 6426Driver Inattention3465 & over4Improper Lane Change5Unknown1Improper Passing0Failed to Use Turn Signal0Following Too Closely0Angle2Traveling Wrong Way3Same Direction - Rear End6Failure to Keep Right0Opposite Direction - Head On / Angular4Mechanical Failure3Opposite Direction - Left / U-Turn0Road / Environmental Factor0Fixed Object19Pedestrian Violation13Pedestrian14Pedalcyclist Violation0Sideswipe7Other / Unknown5Overturned7No Improper Driving47Other1TOTAL113TOTAL60TOTAL100Manner of CollisionVictim Alcohol Factors.01% - .03%.04% - .07%.08% - .10%.11% & overNegativeNo ians00157114Pedalcyclists0000000TOTAL32215368668 drivers, 1 passenger and 1 pedestrian tested positive for alcohol and drugs (Illicit & Medication).2 drivers, 4 passengers and 2 pedestrians tested positive for drugs (Illicit & Medication) alone.19
FATAL PEDALCYCLE CRASHES20122013201420152016Pedalcycle Crashes1414111717Fatalities1414111717Age of VictimClassification of Victim2012 2013 2014 2015 20162012 2013 2014 2015 20160-301000Drivers14141117174 - 1000000Passengers0000011 - 1500111TOTAL141411171716 - 201003021 - 303521231 - 400322441 - 501015251 - 6054233No Improper Driving5444561 & over41325Driver Inattention11221Unknown00000Failed to Yield Right of Way25255TOTAL1414111717Failed to Obey Traffic Control00123Failure to Keep Right01120Improper ributing Circumstances2012 2013 2014 2015 2016ALCOHOL/DRUG INVOLVEMENTOf the 17 pedalcyclist fatalities, 12 were tested. Of those 12 tested, 3 tested positive for drugs only, 2 tested positive foralcohol only and 1 tested positive for alcohol and drugs. 6 were negative for alcohol and/or drugs and 5 were not tested.20
FATAL MOTORCYCLE CRASHES20122013201420152016Motorcycle Crashes7654605068Fatalities7856615169Age of DriversClassification of Victim201220132014201520162012201320142015201616 & under00000Drivers715559486717 - 2025045Passengers6121221 - 302313161719TOTAL775661496931 - 4016911615Over 403028322128TOTAL7155594867Contributing Circumstances'12 '13 '14 '15 '16Manner of Collision'12 '13 '14 '15 '16Angle13171171346756Opposite Direction - Head On/Angular111325Opposite Direction - Left/U-Turn135121116Fixed 24533Overturned9113237654605068Same Direction - Rear EndTOTALUnsafe Speed2720161516Driver Inattention1312131218Improper Lane Change02211Improper Passing30114Failed to Use Turn Signal00000Following Too Closely11101Failure to Keep Right22111Mechanical Failure00000Road/Environmental Factor11201Pedestrian Violation10010Pedalcyclist Violation00000Other/Unknown77426No Improper Driving1710191619TOTAL7255594967*Includes 1 Animal In Roadway Crash and 1 Struck ParkedVehicle Crash.Victim Alcohol Factors.01% - .03%.04% - .07%.08% - .10%.11% & overNegativeNo 9419698 deceased drivers tested positive for alcohol and drugs (Illicit & Medication). 10 deceased drivers and 1 passengertested positive for drugs (Illicit & Medication) alone.21
FATAL TRACTOR-TRAILER CRASHES20122013201420152016Tractor-Trailer Crashes2828442928Fatalities3234482929Manner of CollisionVictim Classification'12 '13 '14 '15 '162012 2013 2014 2015 2016Angle40224Drivers34661Same Direction - Rear End972145Passengers00100Opposite Direction - Head On/Angular15334TOTAL34761Opposite Direction - Left/U-Turn12101Fixed Overturned100322828442928Other Victim Classifications2012 2013 2014 2015 ailer Contributing CircumstancesOther Involved Contributing Circumstances'12 '13 '14 '15 '16Unsafe Speed01011Driver Inattention431072Improper Lane Change01001Improper Passing00000Failed to Use Turn Signal00000Following Too Closely00110Failure to Keep Right00000Mechanical Failure01101Road/Environmental Factor01250Other/Unknown14533No Improper Driving2318341517TOTAL2829533225'12 '13 '14 '15 '165121111914109Improper Lane Change01001Improper Passing00101Failed to Use Turn Signal00000Following Too Closely01000Failure to Keep Right05122Mechanical Failure00100Road/Environmental Factor000140Other/Unknown32536No Improper Driving11627412Pedestrian Violation43455No Pedestrian Violation013013429583938Unsafe SpeedDriver InattentionTOTAL22
TRACTOR-TRAILER VICTIM ALCOHOL FACTORSVICTIM ALCOHOL FACTORS.01% - .03%.04% - .07%.08% - .10%.11% & overNegativeNo 01OTHER VICTIM ALCOHOL FACTORSVICTIM ALCOHOL FACTORS.01% - .03%.04% - .07%.08% - .10%.11% & overNegativeNo lists1000001Pedestrians0001416TOTAL1204201283 drivers and 1 pedalcyclist tested positive for drugs.SAFETY EQUIPMENT USAGESafety Equipment UsedDriver survivedDriver killedPassenger killedUnknown2832None113628Lap Belt010Harness0003042511Child Restraint003Helmet3621Airbag Only217717Airbag & Seatbelts13412325Unapproved Helmet031Other001Total50133089Lap Belt & HarnessBased on the various sources of information (accident reports, observations, interviews, evidence), the seat belt datamay not be completely reliable.23
17 - 20 AGE GROUPListed below are the 17 to 20-year-old drivers involved in fatal motor vehicle crashes.YearTotal fatal crashes 17 - 20 driversTotal drivers involvedNumber of drivers drunk *201661623* .08 & over201617 years old18 years old19 years old20 years oldTotal Drivers Involved13141718Number of Drivers Drunk *0012FATAL CRASHES WITH ALCOHOL INVOLVED2016Crashes17 years old18 years old19 years old20 years old0213VICTIM CLASSIFICATION201617 years old18 years old19 years old20 years oldDrivers4564Passengers222224
FATAL CRASHES AND PERSONS KILLEDFOR SELECTED HOLIDAY PERIODS IN NEW JERSEYHolidayFatal CrashesPersons KilledMemorial Day2012(3)72 Hours442013(3)72 Hours442014(3)72 Hours462015(3)72 Hours692016(3)72 Hours15152012(1)24 Hours772013(4)96 Hours332014(3)72 Hours112015(3)72 Hours332016(3)72 Hours782012(3)72 Hours332013(3)72 Hours672014(3)72 Hours442015(3)72 Hours672016(3)72 Hours332012(4)96 Hours8102013(4)96 Hours562014(4)96 Hours882015(4)96 Hours10122016(4)96 Hours672012(4)96 Hours11112013(1)24 Hours222014(4)96 Hours10102015(3)72 Hours11122016(3)72 Hours552012-13(4)96 Hours442013-14(1)24 Hours222014-15(4)96 Hours662015-16(3)72 Hours10102016-17(3)72 Hours44Fourt
During 2016, New Jersey once again saw an increase in fatal motor vehicle crashes. Nationwide, the preliminary data indicate that motor vehicle fatalities increased to a nine-year high. In 2016, New Jersey recorded 570 fatal collisions that resulted in 6deaths. This is an increase of 48 motor vehicle 02