Transcription
Fostering EffectiveEnergy Transition2021 editionINSIGHT REPORTAPRIL 2021
Cover: GETTY/InakiantonanaInside: All photos GETTY/AvigatorPhotographer; Nikada; rusm; Liam Matter; Kontrastfotodesign; Tongpatong; Federico Rostagno; Scharfsinn86; Genkur; Viktoriia Hnatiuk; ImantsuContents3Foreword4Executive summary61. Introduction102. The Energy Transition Index in a decade to deliver153. Overall results184. Sub-index and dimension trends194.1 Key findings204.2 System performance2123242626272729313132353536394.2.1 Economic development and growth4.2.2 Energy access and security4.2.3 Environmental sustainability4.3 Transition readiness4.3.1 Regulation and political commitment4.3.2 Capital and investment4.3.3 Energy system structure5. Building resilience to overcome new risks5.1 Societies and policy5.1.1 The risk landscape5.1.2 Considerations to build a resilient transition5.2 Energy systems and technologies5.2.1 The risk landscape5.2.2 Considerations to build a resilient transition of energy systems and technologies5.3 Finance39405.3.1 The risk landscape5.3.2 Considerations to build resilient finance to support the transition436. Conclusion44Appendix45Contributors46Endnotes 2021 World Economic Forum. All rights reserved. No part ofthis publication may be reproduced or transmitted in any formor by any means, including photocopying and recording, or byany information storage and retrieval system.Fostering Effective Energy Transition 2021 edition2
APRIL 2021Fostering Effective Energy Transition2021 editionForewordThis edition marks the 10th anniversary ofthe Energy Transition Index (ETI). In the pastdecade, we have witnessed an unprecedentedacceleration of the energy transition. Twoexamples illustrate the point: the growing speedof renewable energy penetration (particularlywind and solar), and the important strides madein energy access. These changes have beenfacilitated by several factors, among whichtechnological advancement and growingpolitical support stand out. However,extraordinary as this evolution has been, thereremain some critical challenges to deliveringsustainable and affordable energy whileimproving access and security.A year has passed since the world was hit bywhat became the greatest global health challengein over a century. The crises generated by theCOVID-19 pandemic continue to affect countriesacross the world in multiple ways, underscoringkey unsolved societal issues. For example,as economic development has stumbled orreversed, the health emergency has exacerbatedinequality and hampered efforts to tackle energypoverty. Unilateral approaches adopted bygovernments in their handling of challengesduring the pandemic, from personal protectiveequipment to the approval and disseminationof vaccines, have also raised concerns aboutthe international community’s ability to cometogether in coordinated action across countriesand sectors. Moreover, uneven compliance torecommended public health measures, driveneither by economic reasons or differences invalues, illustrates the challenges in mobilizingall sections of society in a cohesive responseto a shared problem. The latter is critical aswe look to take effective collective action onenergy transition.Roberto BoccaHead of Shaping the Future of Energy,Materials, and Infrastructure, Memberof Executive Committee WorldEconomic ForumWhen we published last year’s ETI and discussedits findings, we were only a few months into thepandemic. We talked about how energy systemswere subject to compounded disruptions and wewondered what a new normal would look like.Some of the questions raised at that time havebeen answered, but many important pieces in thiscomplex, evolving puzzle have not yet been puttogether. The actions we take in the early years ofthis decade of delivery and action will be criticalin ensuring that strong, long-term ambition issupported by concrete, immediate progress. Weare eager to see stimulus and recovery packagesplaying an important role in this journey.This report discusses the key findings from the EnergyTransition Index 2021. For this report, we have madea few changes in the methodology to reflect therising sense of urgency of climate change, and wehave refreshed some the indicators to use availabledata more effectively. The ETI supports decisionmakers with a transparent fact-base on the progressand gaps in the energy transition, the complexityof that transition, and its interdependence withsocial, political, environmental, economic andinstitutional elements. Coming out of a challenging2020, and based on discussions with key globalexperts, this edition pays special attention to theclimate component. In addition, we address how toimprove the robustness and resilience of the transitionand how to tackle elements that could derail thesuccessful transformation of our energy systems.One of the key findings is a call for coordinated,multi-stakeholder action to achieve an effectiveenergy system evolution. To that end, the WorldEconomic Forum encourages the sharing of leadingpractices and the use of its platform for publicprivate collaboration to facilitate the process ofenergy transition around the world.Muqsit AshrafSenior Managing Director and GlobalEnergy Industries Lead, AccentureStephanie JamisonSenior Managing Director andGlobal Utilities Lead, AccentureFostering Effective Energy Transition 2021 edition3
Executive summaryThe past decade has established the stronginitial momentum to transform the energy systemfor the decades ahead. The scaling of nascenttechnologies and an increased focus on climatechange have fixed global attention firmly on thedecarbonization of energy systems.This journey is far from over. As of 2018, 81%of the world’s energy was still supplied by fossilfuels,1 global greenhouse gas emissions rosethrough 2019 and more than 770 million peoplearound the world still lack access to electricity.2The transformation of our energy systems needsto increase its momentum to help achievecritical objectives such as the UN’s SustainableDevelopment Goals and the Paris Agreement.A decade into the energytransition marks a new high,but acceleration is requiredThis edition marks the 10th anniversary of theWorld Economic Forum’s benchmarking ofcountries on their energy transition progress.We have taken the opportunity to look backat the lessons learned from the past decade,while also looking forward to thejourney ahead.–Aggregate ETI scores rose over the pastdecade for countries collectively accountingfor 86% of global total energy supplyand for 88% of global CO2 emissions fromfuel combustion.–The ranking of top countries on the ETI hasremained broadly consistent over the past decade.Denmark, Finland and the United Kingdom,highest improvers in the top 10 positions, wereable to improve their energy system performanceand sustainability outcomes thanks to a stableregulatory environment, diversified energy mix andcost-reflective energy pricing.–Countries with rising energy demand, such asChina, India and Sub-Saharan African nations,have registered the largest gains, but their scoreson the ETI remain low in absolute terms.improvement in levels of electricity access aroundthe world. However, more efforts are needed toimprove the quality of electricity supply in newlyelectrified areas. This is critical for the delivery ofpublic services, such as testing and vaccinationprogrammes for COVID-19. Moreover, increasinglyfrequent and unpredictable extreme weatherevents have exposed the vulnerability of grids,underscoring the urgent need to modernize andenhance the resilience of electricity transmissionand distribution infrastructure.Strong gains made inenvironmental sustainability,but significant gaps remainEncouraging progress has been made inenvironmental sustainability over the past10 years, with countries accounting for 88% ofglobal total energy supply improving their scoreson this dimension.–Global average energy intensity fell by 15%between 2010 and 2018. However, thisimprovement has yet to fully translate intomeaningful gains, as the carbon intensityof the energy mix was broadly flat over thesame period.–While there has been encouraging progress inareas such as rising levels of investment andpolitical commitment, progress has been farslower in translating ambitions into actions andin realizing the transformation of the energysystem structure itself.–The total amount of electricity generated fromcoal has been on an upward trajectory over thepast 10 years. Identifying viable ways for theearly retirement of carbon-intensive assets willbe needed to accelerate the transition.Assessing the resilience ofenergy transitionStrides made on energy access;reliability is the next frontierOver the past 10 years, only 13 of the 115benchmarked countries have made consistentgains (defined as consistently above-averageperformance improvements on the index). Thisdemonstrates the difficulty in sustaining progressand the complexities of the energy transition.Over the past 10 years, more than 70% of thecountries in the ETI made progress on the energyaccess and security dimension, primarily due toSystemic disruptions such as the pandemic haveunderscored the impact of external shocks. Theenergy transition has shown signs of resilienceFostering Effective Energy Transition 2021 edition4
through COVID-19, which highlighted the resilienceof renewables in particular.3 However, despitethe short drop in emissions during the pandemic,global emissions have since rebounded, accordingto the International Energy Agency.4 As we headdeeper into the decade of action5 – during whichwe must accelerate progress towards transitionand halve emissions by 2030 to remain on trackto meet the 1.5 C Paris Agreement goal – wecannot afford to lose momentum or, worse, gointo reverse.This report identifies three imperatives to increasethe resilience of the energy transition:1. Deliver a “just transition” for all. Inequality is onthe rise and broad stakeholder buy-in is a prerequisite for resilience. The energy transition itselfwill change resource flows and reset sectors ofthe energy system in ways that, if not planned for,could lead to unintended consequences and leaveentire communities adrift. Policy-makers shouldprioritize measures to support the economy,workforces and society at large as countries shiftto a low-carbon energy system. This will require aninclusive approach to evaluating energy policy andinvestment decisions.2. Accelerate electrification and go beyond.Electrification and the scaling up of renewablesare critical pillars of the energy transition andneed to be ramped up quickly. However,coordination on the demand side and thecontribution of other energy sources arenecessary to achieve the full impact required.Increased R&D funding and cross-sectorcollaboration are needed to fully decarbonizeenergy systems, from green hydrogen andnegative emission technologies to digitallyenabled demand optimization.3. Double-down on public-private sectorcollaboration. The UN Intergovernmental Panelon Climate Change (IPCC) estimates that annualinvestments in clean energy and energy efficiencyneed to increase by a factor of six by 2050,6compared with 2015 levels, to limit warming to1.5 C. Despite the growing inflow of capital into thesector, significant funding gaps remain, particularlyin emerging markets and nascent technologies.Collaboration between public and private sectors,including risk-sharing as low-carbon solutionsmature, will attract the diversified, resilient sourcesof capital needed for multi-year and multi-decadeinvestments into energy systems.Building an effective and resilient energy transitionrequires all hands on deck. As countries seek torecover from the impact of COVID-19, there is anopportunity to reset and rethink the way we powerour economies, produce materials and even howwe travel and live. It is critical to root the energytransition in economic, political and socialpractices so that progress becomes irreversible.Fostering Effective Energy Transition 2021 edition5
1IntroductionFostering Effective Energy Transition 2021 edition6
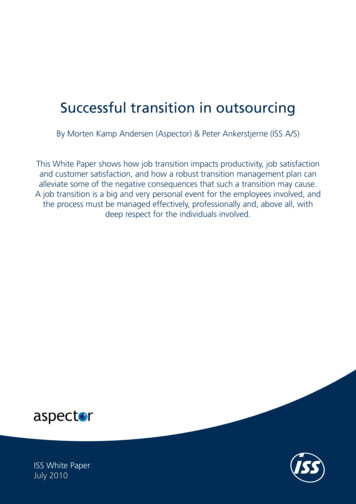
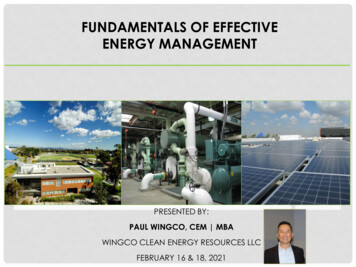
The past decade saw transformative changesacross the energy system. In 2011, the averageprice for crude oil was close to 100/barrel.7 Solarand wind energy were economically uncompetitivecompared to fossil fuel-based electricity generation,and just over 70 GW8 of solar and 238 GW ofwind capacity had been installed globally. From2011 to 2019, global installed capacity grewsevenfold for solar PV and approximately threefoldfor wind energy,9 supported by improving costcompetitiveness and operational efficiency. Globalinvestment in the energy transition rose from lessthan 300 billion per annum in 2011 to almost 500billion by 2020.10 Eight out of the world’s 10 largesteconomies have committed to achieve net-zeroemissions by mid-century.11Throughout 2020, the World Economic Forumengaged global experts from the public and privatesectors and across the energy value chain. Thebroad consensus is one of “cautious optimism”but with clear recognition of the work still needed,especially with respect to climate change andemissions targets.However, clear challenges remain. As of 2018, 81%of the world’s energy came from fossil fuels,12 globalemissions rose steadily over the period to 2019 andmore than 770 million people around the world stilllack access to electricity.The report summarizes insights from our analysisof the ETI and the lessons from 10 years ofbenchmarking countries on energy transition.We then provide an assessment of the evolvingrisk landscape and some key considerations forincreasing the momentum and building resilienceinto the energy transitionIs the energy transition resilient?As we continue through the decade of action anddelivery on tackling the climate change challenge,it is more urgent than ever to accelerate theenergy transition. This report will focus on theenvironmental sustainability dimension of the energytriangle and how leading countries have achievedprogress on that dimension, even in the face ofemerging risks and challenges.This 10th anniversary report is the opportunity to reflectand ask the question whether the energy transition isresilient and if the momentum is sufficient. A resilienttransition is one that maintains the direction, speedand required rate of progress towards a secure,affordable, sustainable and inclusive energy systemeven in the face of disruptions.Fostering Effective Energy Transition 2021 edition7
FIGURE 1:Energy transition over the last decadeHIGHER POSITIVE IMPACTHIGHER NEGATIVE IMPACT100 /bbl oil priceDeepwater Horizonexplosion and subsequentspill in the Gulf of Mexico 20100.5degree celsiusglobal temperature anomalycompared to 20th century10.1 billion40 GW Solar180 GW Windinternational financialflows to developingcountries for clean energy2011Fukushima Daiichi nuclearincident leaves future ofnuclear energy in doubt4.92012tons of CO2eqper capita (peak)Renault-Nissan alliance reachedglobal sales of 100,000 all-electricvehicles in July 201380002013megatonnes ofcoal consumption(peak)UN SustainableDevelopment Goalsset at UN GeneralAssemblyParis Climate Agreementis adopted by 196 partiesat COP 212015DONG Energyrebranded toOrsted and becomesfocused on greenenergy21.4 billioninternational financialflows to developingcountries for clean energyCall for deep emissions reductionsand rapid, far-reaching andunprecedented changes in allaspects of society to meet1.5 degrees targetCO20.9 degree celsiusglobal temperature anomalycompared to 20th century2017 TCFD releasesclimate-relatedfinancial disclosurerecommendationsChina first countryto build installed solar PVcapacity beyond 100 GW20184.7586 GW Solar623 GW Windtons of CO2eqper capitaVienna Alliance signedacross 24 oil-producingcountries to cooperateon production output2019US net exporterof hydrocarbonsfor 1st timesince 194050 /bbl oil priceGlobal pandemic creates dropin energy demand by 5% worldwideShell deliversworld's firstcarbon neutralLNG cargo toTokyo Gas andGS Energy2020Stimulus to date netnegative environmentalimpact in 15 G20 countries Extreme cold triggerblackout affecting3 million people102021millionelectric vehicleson the roadPresentation of EUClimate Target PlanSource: World Economic ForumFostering Effective Energy Transition 2021 edition8
FIGURE 2:Key trends within the energy transition2010LATEST YEAR250500global investmentin the energy transitionglobal investment in theenergy transition (2020) billion billion0.380.0860.070.053solar PVLCOEonshorewind LCOEsolar PVLCOE (2019)onshore windLCOE (2019) /kWh /kWh19% /kWh /kWh26%share of electricity fromrenewables, incl. hydroshare of electricity fromrenewables, incl. hydro (2019)0.510millionmillioncumulative global EVand plug-in salescumulative global EVand plug-in sales (2020)5.44.6energy intensityenergy intensity (2018)3334MJ/ MJ/ gigatonnesgigatonnesemissions fossil fuelcombustion and industrialprocesses - CO2eq, worldemissions fossil fuelcombustion and industrialprocesses - CO2eq, world (2020)1.2770# of people withoutaccess to electricity# of people withoutaccess to electricitybillionmillionSource: Bloomberg New Energy Finance, International Energy Agency, International Renewable Energy Agency, Sustainable Energy for All, and othersFostering Effective Energy Transition 2021 edition9
2The Energy TransitionIndex in a decadeto deliverFostering Effective Energy Transition 2021 edition10
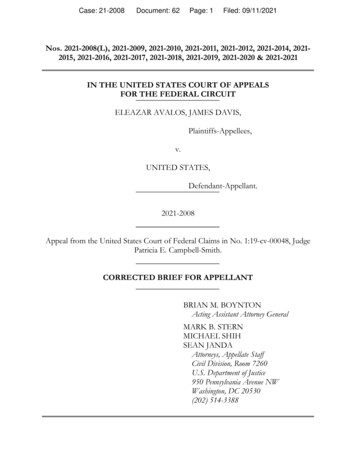
The ETI provides a data-driven framework to fosterunderstanding of the performance and readinessof energy systems across countries for transition.This year’s edition includes methodologicalupdates (see Box 1) to reflect changes in theglobal energy landscape and the urgency of thetask ahead, particularly in taking actions that willreduce carbon emissions.Previously published as the Energy ArchitecturePerformance Index (EAPI) series from 2013to 2017, the ETI was developed to reflectthe interdependencies of energy systemtransformation with the macro-economic,FIGURE 3:political, regulatory and social factors thatdetermine a country’s readiness for transition.The ETI framework is composed of two equallyweighted sub-indices (see Figure 3): the currentenergy system performance and the enablingenvironment for the energy transition.An effective energy transition can be definedas a timely transition towards a more inclusive,sustainable, affordable and secure energy systemthat provides solutions to global energy-relatedchallenges, while creating value for business andsociety, without compromising the balance of theenergy triangle.Energy Transition Index frameworkSystem performance imperativesSecurityand accessTransition readiness: enabling dimensionsEnvironmentalsustainabilityCapitaland investmentRegulationand politicalcommitmentEnergy systemstructureEnergy eHuman capitaland consumerparticipationInfrastructure andinnovative businessenvironmentEconomic development& growthSource: World Economic Forum, Fostering Effective Energy Transition: A Fact-Based Framework to Support Decision Making, 2018System performance provides anassessment of a country’s energy systemperformance across three key priorities:balanced energy triangle can support the choiceof appropriate policies and instruments as well assynchronize efforts across countries.–the ability to support economic developmentand growth–universal access to secure and reliableenergy supply–environmental sustainability across the energyvalue chainThe progress on energy transition in a countryis determined by the extent to which a robustenabling environment can be created. This includespolitical commitment, a flexible regulatory structure,a stable business environment, incentives forinvestments and innovation, consumer awarenessand the adoption of new technologies. The ETImeasures progress along these dimensions in thetransition readiness sub-index. Energy transitionis not restricted to linear shifts in fuel mix or thesubstitution of production technologies. Rather, thesocial, economic and technological systems needto co-evolve13 to shape the transition.14The objective of energy transition in a countryshould be to simultaneously deliver across thesethree priorities, thereby maintaining a balancedenergy triangle. Pursuing a long-term goal of aFostering Effective Energy Transition 2021 edition11
Countries are scored along 39 indicators (seeAppendix) on a scale of 0 to 100. Countries scoringthe global maximum on a given indicator areassigned a score of 100 on that indicator.Given the systemic and endogenous nature of theenergy transition, country scores are the result of ablend of factors including resource endowments,geography, climate, demography and economicBOX 1:structure. Moreover, country scores in somedimensions are based on factors beyond the scopeof national decision-making, such as commoditymarket volatility, geopolitics, international climatechange action and financial market sentiment.Country rankings should therefore be consideredin the context of a country’s unique set ofcircumstances and not a clear-cut diagnosis ofenergy transition accomplishment.Methodological revisions in ETI 2021The Energy Transition Index (ETI) is regularly refinedto reflect changes in the global energy landscapeand to improve the quality of insights deliveredto stakeholders. Due to the revisions made thisyear, the results of this year’s index are not directlycomparable to ETI 2020. For the purpose of trendanalysis, we have recalculated historical scoresusing the revised methodology. Changes havebeen made in three key categories:–Framework weights. As we enter a crucialjuncture of global action towards a sustainableenergy future, we have adjusted the weights ofseveral core energy system indicators. We havedone this to emphasize the urgency of countryaction needed to decarbonize their energysystems. Countries that take greater action toshift their energy systems away from fossil fuelswill see greater improvements in their scoresgoing forwards.–Thresholds. The ETI adopts a min-maxmethod to normalize indicator scores on acommon scale of 0-100. In most cases, thedata ranges are narrowed to control for outliers.The min-max thresholds need to be updated atregular intervals to account for natural evolutionin the spread of cross-sectional data. This year,in line with the broader methodology review,we have updated the thresholds in line with themost up-to-date data. Out of the 39 indicators,10 have been updated, covering 30% of totalindex weight.–Data sources. We have also updated the datasources for several of our indicators due toconsiderations of data recency and availability.Note: A full account of the methodological changes conducted carefully in conjunction with experts and our advisory board willbe published in a separate addendum to this report, along with a full list of data sources.Fostering Effective Energy Transition 2021 edition12
FIGURE 4:ETI 2021 results tableRank 52535455565758ETI score (2012 - nited KingdomNew oreCanadaCroatiaUnited StatesAlbaniaCosta urgMaltaPeruSlovak RepublicAzerbaijanCzech RepublicMexicoArgentinaEcuadorKorea, 36363626261616160606060605959595060Advanced EconomiesCommonwealth of Independent StatesEmerging and developing AsiaEmerging and developing EuropeLatin America and the CaribbeanMiddle East and North AfricaSub-Saharan Africa70SP1TR2Rank 580ETI 2021 scoreETI progression since 20122021 Global Average (59%)System performance 20212Transition readiness 20211ETI score (2012 - 2021)NamibiaEl SalvadorKenyaPolandTurkeyUnited Arab EmiratesVietnamMoroccoPhilippinesChinaSri LankaBoliviaIndonesiaJordanRussian FederationOmanTajikistanEgypt, Arab Rep.GuatemalaDominican RepublicAlgeriaTanzaniaSaudi ArabiaBrunei DarussalamKazakhstanSerbiaTrinidad and TobagoJamaicaIndiaTunisiaHondurasRepublic of MoldovaUkraineNepalCambodiaKyrgyz RepublicZambiaNicaraguaBangladeshBosnia and HerzegovinaIran, Islamic enegalMozambiqueBahrainBeninSouth 140.534.846.037.037.139.560For the ETI 2021 methodology, see the methodologyaddendum published separately.Note: The Energy Transition Index benchmarks countries onthe performance of their energy system, as well as theirreadiness for transition to a secure, sustainable, affordable,and reliable energy future. ETI 2021 scores on a scale from0 to 100.Source: World Economic ForumFostering Effective Energy Transition 2021 edition13
FIGURE 5:Regional scores and key insights: average scores by peer group – ETI 2021 and change from ETI 2012 (recalculated)68.22%30%13%10.1tAdvanced economiesAdvanced economies have improved the group average score by 2 pointsover the past decade, though the improvements have plateaued.Progress has been made in reducing CO2 per capita and the CO2 intensityof the fuel mix, however emissions remain structurally higher than therest of the world. Economic development and growth considerations,reliability of energy systems from increased intermittency anddecarbonization of hard-to-abate sectors will be focus areas forenergy transition in this group.56.85%6%3%54.98.5t40%6%47%3.74tCommonwealth of Independent StatesEmerging and developing AsiaThe Commonwealth of Independent States improved their aggregate ETIscores by 5% over the last decade. Average scores on the economicdevelopment and growth dimension have declined as fuel export revenuesfell due to commodity market volatilities. However, progress isencouraging in environmental sustainability, energy access and quality ofelectricity supply. Looking forward, efforts towards economicdiversification and a stable regulatory environment to support energytransition will be critical.Emerging and developing Asia has improved at the fastest rate comparedto other regions – 6% since a decade ago. Gains have been especiallypronounced in energy access and security. However, challenges over thenext decade abound. Energy demand per capita has grown 18% in thelast decade and is projected to double by 2050. Recent trends indicatethat coal continues to play a significant role in the energy mix. Creating arobust enabling environment to support investments and acceleratedeployment of new technologies, while pursuing “just transition” pathways,can help the region to meet future demand in a climate-friendly way.61.050.72%2%8%% of global CO2 emissions% of global populationCO2 per capita58.65%2%8%2.4t52.82%7%7%3.9t3%5%2%5.2tLatin America and the CaribbeanMiddle East and North AfricaEmerging and developing EuropeLatin America and the Caribbean region’s average ETI score remainedconsistent over the last decade. The region leads in environmentalsustainability, due to a heavy hydroelectric-installed base. Furtherimprovements can be unlocked through improving energy affordability –electricity prices on a purchasing power parity basis remain high in theregion. Although the region has achieved near-universal access toelectricity, the quality of supply remains challenging in many countries.Increased diversification of the import counterparts and diversifying theenergy mix can further improve energy security.Scores in the Middle East and North Africa fell last year but the overalltrajectory remains moderately positive. Heavy reliance on oil revenuecontinues to present challenges to sustainable growth. Diversification ofthe economy and the energy system can improve prospects. Challengesremain in access and security, with heavy concentration in primary energysources. Several countries in the region have set out ambitiousrenewables targets for 2030. For this region, the coming decade presentsopportunities to invest in an energy transition that can unlock significantcross-system benefits.Emerging and developing Europe’s average ETI score increased by 5%between 2012 and 2021. The region saw a balanced improvement acrossall three dimensions of the energy triangle. Improved diversity of energymix, higher quality of electricity supply and strong energy intensityreductions were primary improvement levers. However, this region has ahigher share of coal than the European average and flexibility remains low,which may prove challenging as the share of renewable energy grows inpower generation. According to IRENA, renewable sources could covermore than o
deeper into the decade of action5 - during which we must accelerate progress towards transition and halve emissions by 2030 to remain on track to meet the 1.5 C Paris Agreement goal - we cannot afford to lose momentum or, worse, go into reverse. This report identifies three imperatives to increase the resilience of the energy transition: 1.