Transcription
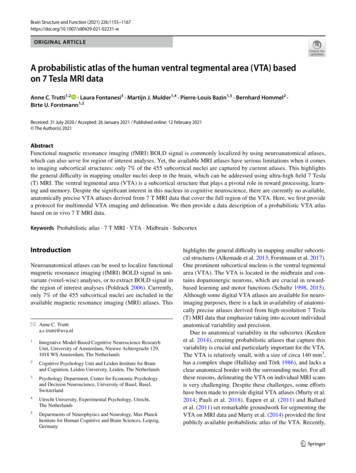
Brain Structure and Function (2021) 02231-wORIGINAL ARTICLEA probabilistic atlas of the human ventral tegmental area (VTA) basedon 7 Tesla MRI dataAnne C. Trutti1,2 · Laura Fontanesi3 · Martijn J. Mulder1,4 · Pierre‑Louis Bazin1,5 · Bernhard Hommel2 ·Birte U. Forstmann1,2Received: 31 July 2020 / Accepted: 26 January 2021 / Published online: 12 February 2021 The Author(s) 2021AbstractFunctional magnetic resonance imaging (fMRI) BOLD signal is commonly localized by using neuroanatomical atlases,which can also serve for region of interest analyses. Yet, the available MRI atlases have serious limitations when it comesto imaging subcortical structures: only 7% of the 455 subcortical nuclei are captured by current atlases. This highlightsthe general difficulty in mapping smaller nuclei deep in the brain, which can be addressed using ultra-high field 7 Tesla(T) MRI. The ventral tegmental area (VTA) is a subcortical structure that plays a pivotal role in reward processing, learning and memory. Despite the significant interest in this nucleus in cognitive neuroscience, there are currently no available,anatomically precise VTA atlases derived from 7 T MRI data that cover the full region of the VTA. Here, we first providea protocol for multimodal VTA imaging and delineation. We then provide a data description of a probabilistic VTA atlasbased on in vivo 7 T MRI data.Keywords Probabilistic atlas · 7 T MRI · VTA · Midbrain · SubcortexIntroductionNeuroanatomical atlases can be used to localize functionalmagnetic resonance imaging (fMRI) BOLD signal in univariate (voxel-wise) analyses, or to extract BOLD signal inthe region of interest analyses (Poldrack 2006). Currently,only 7% of the 455 subcortical nuclei are included in theavailable magnetic resonance imaging (MRI) atlases. This* Anne C. Truttia.c.trutti@uva.nl1Integrative Model‑Based Cognitive Neuroscience ResearchUnit, University of Amsterdam, Nieuwe Achtergracht 129,1018 WS Amsterdam, The Netherlands2Cognitive Psychology Unit and Leiden Institute for Brainand Cognition, Leiden University, Leiden, The Netherlands3Psychology Department, Center for Economic Psychologyand Decision Neuroscience, University of Basel, Basel,Switzerland4Utrecht University, Experimental Psychology, Utrecht,The Netherlands5Departments of Neurophysics and Neurology, Max PlanckInstitute for Human Cognitive and Brain Sciences, Leipzig,Germanyhighlights the general difficulty in mapping smaller subcortical structures (Alkemade et al. 2013; Forstmann et al. 2017).One prominent subcortical nucleus is the ventral tegmentalarea (VTA). The VTA is located in the midbrain and contains dopaminergic neurons, which are crucial in rewardbased learning and motor functions (Schultz 1998, 2015).Although some digital VTA atlases are available for neuroimaging purposes, there is a lack in availability of anatomically precise atlases derived from high-resolution 7 Tesla(T) MRI data that emphasize taking into account individualanatomical variability and precision.Due to anatomical variability in the subcortex (Keukenet al. 2014), creating probabilistic atlases that capture thisvariability is crucial and particularly important for the VTA.The VTA is relatively small, with a size of circa 140 m m3,has a complex shape (Halliday and Törk 1986), and lacks aclear anatomical border with the surrounding nuclei. For allthese reasons, delineating the VTA on individual MRI scansis very challenging. Despite these challenges, some effortshave been made to provide digital VTA atlases (Murty et al.2014; Pauli et al. 2018). Eapen et al. (2011) and Ballardet al. (2011) set remarkable groundwork for segmenting theVTA on MRI data and Murty et al. (2014) provided the firstpublicly available probabilistic atlas of the VTA. Recently,13Vol.:(0123456789)
1156Pauli et al. (2018) released another probabilistic atlas of theVTA by making use of the large publicly available data thefield has gathered since. Accordingly, the atlas by Pauli et al.(2018) was aimed to emphasize anatomical variability, butinterestingly the authors also applied a different VTA terminology compared to Murty et al. (2014).The atlas introduced in this paper adds to the collectionof probabilistic VTA atlases by providing another atlas thatemphasizes anatomical precision next to anatomical variability which was the focus of previous atlases. Importantly,we acknowledge previous efforts; however, there are severalchallenges in the construction of VTA atlases that can befacilitated today due to developments in the field of ultrahigh-field MRI. For example, given the relatively small sizeand location of the VTA, a scan protocol with a submillimeter voxel-size resolution is crucial (Ewert et al. 2018). Also,a 7T scan protocol helps to acquire improved signal-to-noiseratios (SNR) and contrast-to-noise ratios (CNR) comparedto lower field strength (van der Zwaag et al. 2015). Furthermore, the optimization of the MR sequences by meansof tailoring them to subcortical structures such as the VTAis required for individual anatomical precision (Trutti et al.2019).Finally, the interindividual anatomical variability of theVTA necessitates a large number of manual delineations bydifferent raters separately for both hemispheres, respectively,to account for anatomical variability as well as the reliabilityof the segmentation.Of course, all efforts to provide probabilistic VTA atlasesare limited by some factors and therefore tailored to different approaches. In the atlas of Pauli et al. (2018) anatomicalvariability was taken into account before manual segmentation was carried out by means of computing eight, unilateralgroup templates on which three raters manually segmentedthe VTA. This resulted in eight, unilateral VTA segmentations for each rater despite the abundance of individual data,as the data originated from the Human Connectome Project(HCP). Yet, manual segmentations are very time consuming and the authors provided many subcortical nuclei inthe published atlas. Thus, their efforts were not limited tosegmenting the VTA. Further, since they worked with HCPdata, they were also restricted to the available scans. To getimages that allow segmentation of subcortical nuclei, theconstruction of group templates was required.In contrast, the atlas from Murty et al. (2014) is basedon manual segmentation of the VTA on a large number ofparticipants. Nonetheless, as the field rapidly develops thedata quality is not state-of-the-art anymore. The resolution(1 mm isotropic) and CNR of the used T1-weighted MRIsequence render the incorporation of small anatomical differences needed for the segmentation of the VTA very challenging. These issues can be addressed again today with newscan protocols and higher field strengths.13Brain Structure and Function (2021) 226:1155–1167Besides the use of digital atlases, researchers who aim toprovide anatomical precision in their neuroimaging effortsare limited to the use of topological, histological atlases suchas the Mai, Majtanik, and Paxino’s atlas of the human brain(Mai et al. 2016). However, VTA representations in digitaland topological atlases differ substantially not only due tointerindividual variability in anatomy but also due to differences in VTA terminology (see Trutti et al. 2019 for acomprehensive review). Another factor that might influencethe lack of agreement in terminology, and consequently thevariability in VTA representations in the aforementionedatlases, is the structure’s cytoarchitectonic and neurochemical heterogeneity. This heterogeneity is not restricted to theVTA’s neural populations but is also apparent in its lack ofa clear anatomical border, which makes it difficult to defineboundaries in structural and histological studies and explainsthe poverty in available probabilistic VTA atlases.In this study, we first present an optimized 7T MRI imaging protocol to delineate the VTA based on a well-established VTA terminology (Trutti et al. 2019). According toHalliday and Törk (1986) as well as Mai et al. (2016), theVTA covers a region that includes the parabrachial pigmented nucleus (PBP), paranigral nucleus (PN), interfascicular nucleus (IF), the caudal linear nucleus (CLi), andthe rostral linear nucleus (RLi). Hence, the segmentationprotocol was built so that the VTA masks could contain thedifferent VTA component nuclei rather than to identify theindividual component nuclei themselves, which is hardlypossible even at 7T. We then demonstrate the capabilities ofthis optimized protocol to define a probabilistic VTA atlasbased on 7T in vivo MRI data from 27 healthy participants.Data, materials and methodsParticipantsThe probabilistic atlas is based on twenty-seven healthy,young, right-handed participants (19 females) with a meanage of 24.5 (SD 4.8). All participants had normal or corrected-to-normal vision, and none of them had a history ofneurological, major medical, or psychiatric disorders. Thestudy was approved by the local ethics committee at theUniversity of Amsterdam, the Netherlands. All participantsgave their written informed consent prior to scanning andreceived monetary compensation for participating. Thisstudy was performed in line with the principles of the Declaration of Helsinki.Scan parametersThe structural data were acquired using a Philips Achieva7T MRI scanner equipped with a Nova Medical 32-channel
Brain Structure and Function (2021) 226:1155–1167head array coil. T1-weighted and T2*-weighted images,along with other images, were simultaneously obtainedusing a multi-echo magnetization-prepared rapid gradient echo (MP2RAGE-ME) sequence (Caan et al. 2018;Metere et al. 2017) with a total acquisition time of19.53 min (TI,1 670 ms, TI,2 3675.4 ms, TR,1 6.2 ms,TR,2 31 ms, TE,1 3 ms, TE,2 [3, 11.5, 19, 28.5 ms],TR, MP2RAGE-ME 6778 ms, flip angle1: 4 , flip angle2: 4 , bandwidth: 404.9 MHz, acceleration factor SENSE:2, FOV 205 205 164 m m 3 , acquired voxel size:0.7 0.7 0.7 mm3, acquisition matrix: 292 290, reconstructed voxel size: 0.64 0.64 0.70 mm3, turbo factor: 150(resulting in 176 shots).Image processingBecause the T1-weighted and T2*-weighted structuralimages were acquired simultaneously using the MP2RAGEME sequence (Caan et al. 2018; Metere et al. 2017), coregistration was not necessary. All obtained scans were individually checked for sufficient contrast in the VTA regionto identify sequences that allow VTA delineation. To firstlocate and then manually delineate the VTA even though itlacks a clear border, we used its surrounding structures assaggital1157landmarks and virtual borders. These included the fourthventricle, the red nucleus (RN), and the substantia nigra(SN). This procedure is in line with histology approachesin which VTA delineations are also based on neighboring structures (Mai et al. 2016), as well as previous MRIbased delineations (Murty et al. 2014; Ballard et al. 2011).To increase contrast in our regions-of-interest (ROIs), weperformed a few preprocessing steps prior to the manualdelineation, as the visibility of the VTA and its neighboringstructures varied across the three different scan contrasts(Fig. 1). While the fourth ventricle was best visible in theT1-weighted image, images from the second inversion ofthe T2*-weighted scans provided best visibility of both theSN and the RN. Since different landmark structures werevisible in different images, we set up a procedure to includeall of the landmark structures in the same image. Precisely,three images were chosen, across which the visibility of eachstructure varied: the T 1-weighted image and two inversionsof the T*2-weighted scan, namely the 3rd and 4th echo.Additionally, for each subject, a midbrain area (with volume 1.6 1.6 3.08 cm3) was defined, so that it included theVTA as well its neighboring landmarks (i.e., the RN, the SN,and the 4th ventricle). The preprocessing steps thus included(1) averaging the 3rd and 4th echo of the T 2*-weighted scancoronalaxialT1-weighted imageAverage 3rd and 4thecho of T2*weighted scansFinal segmentationimageFig. 1 Detail of the midbrain area of one individual participant foreach of the different scans collected for VTA delineation. The figure displays VTA (red) for one participant in the sagittal (left column), coronal (middle column), and axial (right column) plane. Thefirst row shows the T1-weighted image of the first inversion of theMP2RAGEME sequence. The second row shows the image based onthe average between the third and fourth echo of the T2*-weightedscans. And the third row depicts the final image used for VTA delineation, which was obtained by normalizing the image in the first andsecond row within the midbrain area (see 2.3). A blood vessel passing through the midbrain is highlighted in yellow, which was avoidedduring segmentation13
1158to increase the signal-to-noise ratio (SNR); (2) intensitynormalization over the voxels of the pre-defined midbrainarea of the previously computed average T 2*-weighted scanand of the T1-weighted image; (3) summing the normalized,T1-, and T2*-weighted midbrain sections. The image resulting from step 3 (‘midbrain contrast’) was ultimately used todelineate VTA at the subject level.Registration to standard stereotactic MNI152 2009bspaceAll linear registration steps were done using MIPAV 5.4.4.(http://mipav. cit.nih.gov/) with the optimized automated linear registration algorithm. Whole-brain images were skullstripped using the standard FSL BET tool (Smith 2002). Theregistration to atlas space was done by means of non-linearly aligning the individual whole-brain images to a groupaverage template of the AHEAD database (Alkemade et al.2020) which itself was co-registered to the MNI152 2009btemplate with the ANTs algorithm (Avants et al. 2008),using conservative deformation parameters as recommendedfor subcortex (Ewert et al. 2018). The individual VTA masksand midbrain contrasts were non-linearly transformed intoMNI152 2009b space using the computed transformations.All registration steps were visually checked for misalignments by comparing several landmarks: fourth ventricle,pons, corpus callosum, and lateral ventricles. Because theAHEAD template is based on the same MP2RAGE-MEsequence that provides additional subcortical contrast compared to the MNI152 2009b template, the automated coregistration of the subcortical regions was satisfactory.Delineation protocolManual delineation was carried out by two independentresearchers (LF, ACT) using the FSL 3.2.0 viewer (http://fsl.fmrib. ox.ac.uk/fsl/fslwik i/). Only voxels rated by both ratersas belonging to the VTA were included to compute the VTAprobabilistic atlas. Anatomical landmarks and the segmentation protocol were based on the work of Halliday and Törk(1986), van Domburg and ten Donkelaar (1991), Ballardet al. (2011) and Murty et al. (2014). The manual delineation was done as follows: in an initial step, the individualT1-weighted image of the MP2RAGE-ME sequence wasloaded for orientation purposes, as the final image for delineation contained only the midbrain section (‘pre-defined midbrain area’ see 2.3). In a second step, the final, previouslycomputed midbrain image was loaded and overlaid on thewhole-brain T1-weighted image, and served as a basis fordelineation. In a third step, the contrast values in the viewerfor the delineation image were set to increase the visibilityof the structural borders. The contrast values were determined on an individual subject basis and were independently13Brain Structure and Function (2021) 226:1155–1167set by each rater, but starting with a minimum of 2 andmaximum of 2. For most participants, these initial contrastsettings were found optimal for manual delineation. The contrast values were kept constant between hemispheres. Thecoronal view was picked to start delineating the structure.Once the delineation of the structure started, all three viewswere used to segment the structure. The order in which theright or left hemisphere was segmented was randomized perparticipant. First step of the manual segmentation involvedidentifying the starting point, the peak curvature of thewhite matter tract that connects the mamillary bodies withthe midbrain (in sagittal view). In a second step, the voxelsconsidered to be part of the VTA were segmented. The mainbody of the VTA lies between the relatively easily identifiedlandmarks RN (dorsally), SN (ventro-laterally), the aqueduct(medially) and the fourth ventricle (ventro-medially). Thesubthalamic nucleus, if present, represents a much harderto identify dorsolateral landmark. Finally, the mask volumewas computed and the interrater reliability was assessed bymeans of calculating different similarity metrics: the Dicecoefficient, Hausdorff distance, and dilated Dice coefficient.The Dice coefficient represents the degree of spatial overlapbetween raters and is computed based on the size of theconjunct mask of the masks by rater 1 and rater 2, respectively, which only includes voxels included by both raters’segmentations (see Fig. 2a for the equation to calculate theDice coefficient). The Hausdorff distance is a metric thatindicates how far shapes are from being isometric, whiletaking into account both shape and orientation. The dilatedDice coefficient, a more suited measure of reliability forsmall structures with complex shapes is similar to the classical Dice coefficient except that it calculates the degree ofoverlap based on dilating each mask by one voxel. Accordingly, it does not penalize a single-voxel offset to the samedegree as the classical Dice score, which is an importantfactor for small, complex-shaped structures with a large ratioof surface voxels, like blood vessels or the VTA (see Fig. 2;Bazin et al. 2016). Interrater agreement is reflected in high(dilated) Dice values (1 full agreement, 0 no agreement),and a small Hausdorff distance. All statistics were derivedusing the Nighres toolbox (Huntenburg et al. 2018; ml) and its ‘segmentation statistics’ function.Computation of probability maps and atlasingof the VTAManual delineations were carried out in individual spaces.To compute a probabilistic atlas, individual VTA maskswere later registered to the group space as reported in “Registration to standard stereotactic MNI152 2009b space”.Consequently, the statistical atlas was generated by averaging each individual segmented VTA mask in standard space.
Brain Structure and Function (2021) 226:1155–11671159Dilated dice coefficientA Schematic example of the effect one voxel dilation on thedice overlapDice overlapsaggitalU2xA BA BDC B The interaction of volume and minor segmentation differences on segmentation overlap, an example on two differentsubcortical nuclei200 voxels120 voxels120 voxelsDice score: 0.375coronalAUD(B) BA BDice score: 0.75Substantia nigra (SN)UD(A)Rater 1Rater 2Rater overlapDilated Dice overlapFor simplicity, masks ofboth raters consist of80 surface voxelsVentral tegmentalarea (VTA)small differences( 1 voxel) have amajor impact on theoverall overlap200 voxels200 voxels150 voxelsDilated Dice overlapdDC axialsmall differences( 1 voxel) have littleimpact on theoverall overlap200 voxelsDilated dice score: 1190 voxelsDilated dice score: 0.95VTA mask rater 1VTA mask rater 2SN mask rater 1SN mask rater 2T1-weightedQSMFig. 2 Dice and dilated Dice coefficient. The Dice coefficient is aspatial overlap index that by means of manual segmentation in MRIserves as a reproducibility validation metric (Zou et al. 2004). Inthe case of subcortical nuclei, a reduced border contrast often complicates manual segmentation substantially, especially for complexshaped and relatively small structures such as the VTA. a If manyvoxels represent border/surface voxel, as in the VTA, a differenceof one voxel at the border has a huge weight on the overall agreement. The dilated Dice score is a more flexible measure for inter-rateragreement and is therefore a more meaningful reproducibility metricfor complex shapes as compared to the classical Dice score. In theequation, the letter A represents the mask of rater 1 and B the maskof rater 2. b The more voxels represent surface voxels in relation tothe number of voxels of that structure in total (the surface/volumeratio) the more important exact overlap between raters becomes, asthe classical Dice score penalizes each non-overlapping voxel. Theexample is shown on QSM images of a single subject with the VTArepresented in the upper panel and the SN in the bottom panel. Fororientation purposes a T1-weighted as well as a QSM whole-brainimage is shown in the bottom right cornerDifferences to other probability atlases of the VTAF(1, 104) 0.11, p 0.739, nor an interaction between raterand hemisphere, F(1, 104) 0.68, p 0.412. Levene’s testdid indicate heteroscedasticity in the volume measure, but aShapiro–Wilk test on the ANOVA residuals found no indication that normality is violated.The unthresholded probabilistic atlas volume was m3 for the right2226.375 mm3 for the left and 2368.00 mhemisphere. To increase the probability of the atlas voxelsbelonging to the VTA, thresholds can be applied. Each voxelhas a particular probability of belonging a structure, basedon the overlap across the 27 individually segmented masks.A threshold of 50%, for example, excludes all VTA atlasvoxels that are not shared across at least 50% of the subjects(see Fig. 3 for the volume of the probabilistic atlas acrossdifferent lower thresholds and Fig. 4 for three-dimensionalreconstructions of the atlas).Mean center of mass (CoM) of the individual masksin MNI152 2009b space was x 3.44, y 16.47,z 12.03 mm, respectively, for the left VTA masks andx 3.5, y 16.45, z 11.99 mm, respectively, for theright VTA masks. The average distance to the mean CoM ofthe left VTA masks was 0.001 mm (SD 0.77) for the CoMTo compare the currently available probabilistic atlases ofthe VTA with the atlas introduced in this manuscript, wemoved to the standard space. The atlases of Murty et al.(2014) and Pauli et al. (2018) were registered to the MNI1522009b template using the ‘embedded antsreg’ (Avants 2008;Gorgolewski et al. 2011) and ‘apply coordinate mappings’functions and consecutively, overlap statistics were computed using again the ‘segmentation statistics’ functionfrom the Nighres toolbox (Huntenberg et al. 2018).ResultsThe individual, manually delineated VTA masks had anaverage size of 137.35 m m 3 (SD 38.27) and 138.803 mm (SD 39.33), for the left and for the right hemisphere, respectively. An ANOVA on the effects of rater andhemisphere on the volume of the individual delineationsrevealed a statistically significant main effect of rater, F(1,104) 36.57, p 0.001, but no main effect of hemisphere,13
1160Brain Structure and Function (2021) 226:1155–1167ABCVTA atlas volumeVTA mask volumeVTA atlas volumeleftright0.01220000.0101500Volume (in mm3)Frequency0.0080.00610000.0045000.002MNI: Y -1700.00050100150200Volume (in mm3)250Threshold0.2.4.6Threshold.80 0.1 0.2 0.3 0.4 0.5 0.6 0.7 0.8 0.9Fig. 3 VTA mask and atlas volume. a Distribution of the volume ofindividual VTA conjunction masks. b VTA atlas volume across different thresholds. The size of the VTA atlas decreases when discarding the voxels that have lower probabilities of belonging to the VTAacross participants. Markers are colored according to the thresholdsin c. c Effect of thresholding on the VTA atlas volume, shown on theright VTA atlas. Voxels inside the differently colored outlines fallwithin the atlas mask when the thresholds corresponding to thosecolors are applied. For example, most of the darker voxels suggestinga lower probability, and only those, would be excluded with a threshold of 0.2 as indicated by the bright red outline. In contrast, picking ahigh threshold (blue colored lines) would mostly include voxels in theventromedial VTA regionx-coordinate, 0.001 mm (SD 1.42) for the CoM y-coordinate and 0.001 mm (SD 2.14) for the CoM z-coordinate(Fig. 5). Right VTA masks elicit an average distance to themean x-coordinate of 0.001 mm (SD 0.86), 0.001 mm(SD 1.42) to the mean y-coordinate and 0.001 mm(SD 2.23) to the mean z-coordinate (see Fig. 5, panel b).Analyses in MNI152 2009b space revealed no effects of gender or hemisphere on mask volume (gender: F(1, 50) 0.298,p 0.588, hemisphere: F(1, 50) 0.076, p 0.784; gender hemisphere: F(1, 50) 0.203, p 0.654).The mean Dice coefficient was 0.56 (SD 0.06) forthe left VTA and 0.56 (SD 0.07) for the right VTA,while the Hausdorff distance was 7.96 voxels (SD 1.34)[5.57 mm, SD 0.94] and 8.12 voxels (SD 1.48) [5.68 mm,SD 1.04], respectively. The dilated Dice coefficient was0.80 (SD 0.07) for both hemispheres (see Fig. 4 for theprobabilistic atlas).Table 1 shows the results of the comparison of the proposed atlas with currently available probabilistic atlases ofthe VTA in MNI152 2009b space (see Fig. 6 for illustration).precision but explicitly emphasizes it. This atlas providesresearchers with a tool to investigate with high anatomicalprecision the cognitive processes underlying VTA activationusing fMRI. We show that ultra-high field 7T MRI allowsthe identification and delineation of the VTA at the individual level, with the help of optimized MR sequences anda multimodal imaging approach.This atlas differs from existing work in multiple respects.Although this atlas is based on a fewer number of subjectscompared to Murty et al. (2014) and Pauli et al. (2018),it takes anatomical variability more comprehensively intoaccount. First, the tailored MRI contrast elicits more CNRcompared to a standard T1-weighted scan and an entirelylandmark-based approach as applied by Murty et al. (2014),rendering it more likely to capture true individual anatomical differences even though Murty et al. (2014) had almostdouble the sample size. Second, Pauli et al. (2018) performed delineations not on individual subjects, but on eightgroupwise averages of 168 subjects. Such large groupwiseaverages capture very little anatomical variability and arebiased towards more consistent labeling.In this study, we used a high-resolution multi-parametricquantitative MRI sequence, which may not be available onevery MRI machine. The key features for successfully imaging the VTA were to combine a T1-weighted image (identifying ventricle boundaries) with a T2*-weighted image(identifying SN and RN). Thus, alternative MRI sequencesDiscussionIn the present work, we propose a new probabilistic atlasof the VTA that, differently from previously proposedatlases, not only takes into account individual variability and13
Brain Structure and Function (2021) 226:1155–11671161A Probabilistic VTA atlas location in relation toSTRGPeGPiSTNRNSNVTArightProbabilistic VTA atlas in MNI spaceBthe basal steriorinferiorOverlap20%100%MNI: Y -17Unthresholded probabilistic VTA atlas from different . 4 Probabilistic atlas of the VTA. a Probabilistic VTA atlas location in relation to the basal ganglia. b Thresholded (20%) probabilistic VTA atlas in standard MNI152 2009b space from posterior toanterior direction. c Unthresholded probabilistic VTA atlas in glassbrain from different views. Left: VTA atlas is depicted in blue andright: VTA atlas in red. Numbers represent slice location withrespect to the MNI Y-coordinates. The color gradient indicates overlap across the 27 participants with lighter colors indicating a largeroverlap (up to 100%) and darker colors less overlap (with a minimumof 20%). STR striatum, GPe globus pallidus externa, GPi globus pallidus interna, STN subthalamic nucleus, RN red nucleus, SN substantianigra, VTA ventral tegmental areathat combine these two contrasts at high isotropic resolutioncould be used as a basis for VTA delineation, and might beachievable at lower field strength and clinically acceptablescan times. Yet, our MRI sequence enabled segmentationon images with not only increased CNR but also increasedresolution and SNR. All these factors play a crucial role inthe identification and delineation of subcortical structures,especially structures that lack clear borders and elicit complex shapes, such as the VTA. The influence of the dataquality on the VTA mask can be seen in Fig. 6 with respectto the difference of VTA mask volume of Murty et al.(2014; shown in green) and our VTA mask (shown in red).Besides the illustration of the observable volume differencesbetween the atlases, Fig. 6 and Table 1 show various differences across available probabilistic VTA atlases. First, theanatomical precision of the Murty atlas appears constrainedas it overlaps largely with areas that do not represent braintissue but parts of the ventricle system (i.e., fourth ventricle),under all three visualized thresholds. Further, it covers alarge region of the midbrain and, as noticeable for the anatomically-experienced reader, includes structures such as theRN or SN. As mentioned above, this affected by data qualitywith respect to resolution, CNR and SNR that fundamentallyaffect anatomical precision, something that we could takeadvantage of compared to Murty et al. (2014) who couldnot benefit from recent technological advances. Yet, the13
1162Brain Structure and Function (2021) 226:1155–1167ABCenter of massNo. of overlappingCoM 5-16.5 Y-15.5rightXX6-104454.4.50 24.52Average distance to the mean center of massFrequency0 2 4 ig. 5 Location of individual VTA masks in standard space. Panel ashows the center of mass (CoM) location of each individual conjunction mask in MNI152 2009b space in a three-dimensional graph andthe correspondi
as the Mai, Majtanik, and Paxino's atlas of the human brain (Mai et al. 2016). However, VTA representations in digital and topological atlases dier substantially not only due to interindividual variability in anatomy but also due to dif-ferences in VTA terminology (see Trutti et al. for a 2019 comprehensive review).