Transcription
ROC (Receiver Operating Characteristic) Curve AnalysisJulie Xu17th November 2017
Agenda Introduction Definition Accuracy Application Conclusion Reference 2017 All Rights Reserved Confidential – for INC Research/inVentiv Health use only2
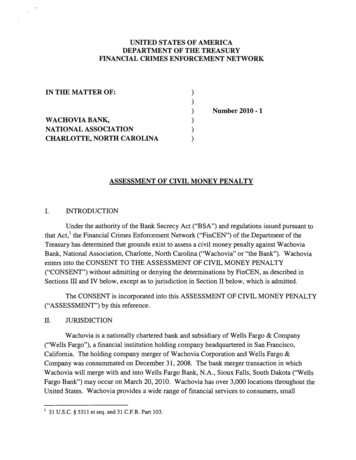
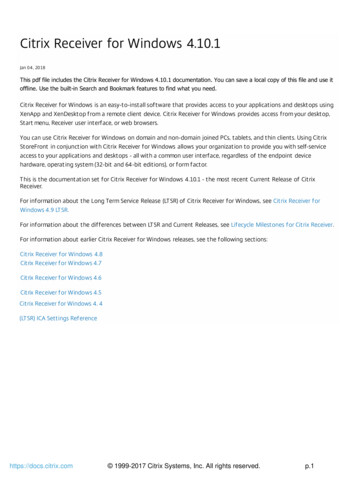
Introduction ROC (Receiver Operating Characteristic) curve is a fundamental tool fordiagnostic test evaluation. It is increasingly used in many fields, such as datamining, financial credit scoring, weather forecasting etc. ROC curve plots the true positive rate (sensitivity) of a test versus its falsepositive rate (1-specificity) for different cut-off points of a parameter ROC curve is graphically to display the trade-off relationship between sensitivityand specificity for all possible thresholds SAS/STAT Procedures: FREQ, LOGISTIC, MIXED and NLMIXED can be used toperform ROC curve analysis 2017 All Rights Reserved Confidential – for INC Research/inVentiv Health use only3
ROC (Receiver Operating Characteristic) Curve1 2017 All Rights Reserved Confidential – for INC Research/inVentiv Health use only4
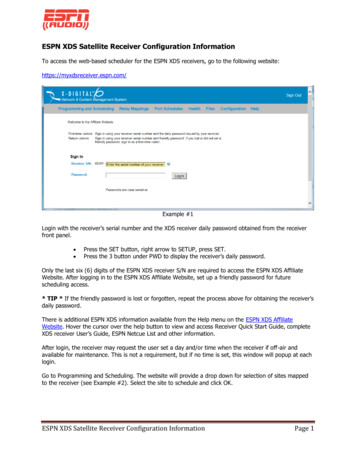
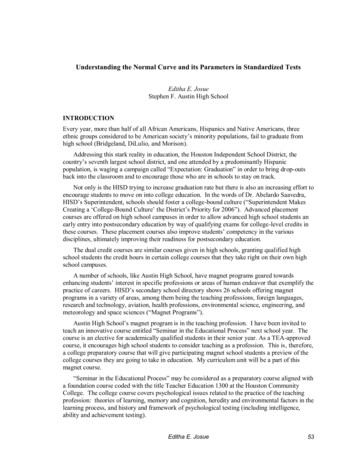
Definition2 Sensitivity is the probability of a test will be positive given a patient with the disease Specificity is the probability of a test will be negative given a patient without the diseaseSensitivity TP/(TP FN) a/(a b)Positive predictive value (PPV) TP/(TP FP) a/(a c)Specificity TN/(TN FP) d/(c d)Negative predictive value (NPV) TN/(TN FN) d/(b d) 2017 All Rights Reserved Confidential – for INC Research/inVentiv Health use only5
Accuracy The accuracy of a test is measured by the area under the ROC curve (AUC). AUC is the area between the curve and the x axis. An area of 1 represents a perfect test, while an area of .5 represents a worthlesstest. The closer the curve follows the left-upper corner of the plot, the more accuratethe test. 2017 All Rights Reserved Confidential – for INC Research/inVentiv Health use only6
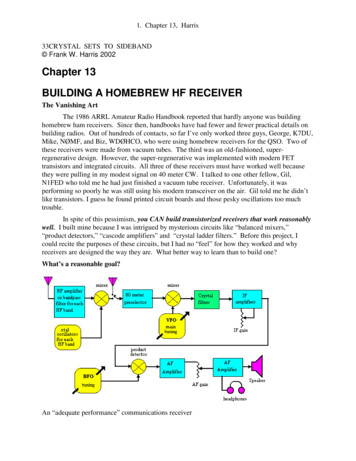
Application in SAS3 PROC FREQ: 2 2 contingency table in PET (Positron Emission Tomography) scan for detecting cancer data cancer;input Diagnosed Observed patients;datalines;CancerCancer25CanerNo Cancer3No CancerCancer42No CancerNo Cancer111;run; Proc freq data cancer;table diagnosis*observed;weight patients;run;Sensitivity 37.31%Specificity 97.37%PPV 89.29%NPV 72.55%Diagnosed cancer if SUV (Standardized Uptake Value) 7;Observed cancer determined by gold standard 2017 All Rights Reserved Confidential – for INC Research/inVentiv Health use only7
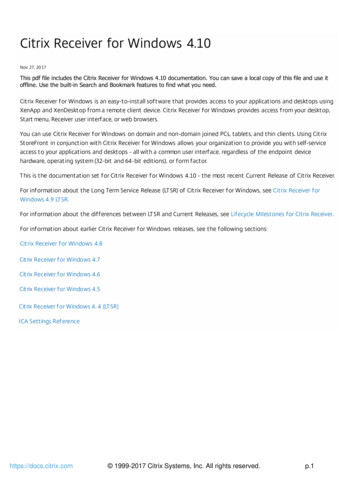
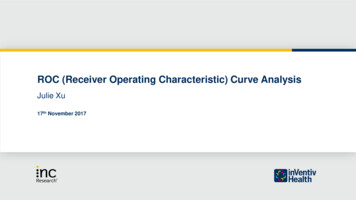
Application in SAS4 Developing new biomarkers (BM) that are more specific in detecting drug inducedliver injury (DILI) than the commonly used test [elevated alanine transaminase (ALT)] ods graphics on;proc logistic data biom plots roc;model status (event ‘1’) alt bm1 bm2;roc “BM1’ bm1;roc “BM2” bm2;roc “ALT” alt;roccontrast reference(‘ALT’)/estimate e;run;ods graphics off;AUC equals to C-statistics 2017 All Rights Reserved Confidential – for INC Research/inVentiv Health use only8
Conclusion Threshold Selection- To choose the most appropriate cut-off for a test. The best cut-off has the highesttrue positive rate together with the lowest false positive rate Assessment of Diagnostic Accuracy- To evaluate the accuracy of a diagnostic test using AUC value to discriminate thediseased cases from normal cases Multiple Tests Comparison- To compare the performance of two or more tests via a visual method 2017 All Rights Reserved Confidential – for INC Research/inVentiv Health use only9
Reference 1. sticRegressionMeasuresOfFit.png 2. https://www.medcalc.org/manual/roc-curves.php 3. http://www2.sas.com/proceedings/sugi31/210-31.pdf 4. Gonen, Mithat. 2007. Analyzing Receiver Operating Characteristic Curves with SAS. Cary,NC: SAS Institute Inc. 2017 All Rights Reserved Confidential – for INC Research/inVentiv Health use only10
2017 All Rights Reserved Confidential – for INC Research/inVentiv Health use only11
Email: liqin.xu@inventivhealth.comClinical DivisionINC Research/inVentiv Health 2017 All Rights Reserved Confidential – for INC Research/inVentiv Health use only12
ROC curve plots the true positive rate (sensitivity) of a test versus its false positive rate (1-specificity) for different cut-off points of a parameter ROC curve is graphically to display the trade-off relationship between sensitivity and specificity for all possible thresholds