Transcription
JANUARY 2017MUTUAL FUND Investor GuideTHE Investor Guide TO VANGUARD FUNDSmutualfundinvestorguide.comMatthew D. SauerFounder & ChiefInvestment OfficerMatthew Sauer is theFounder and ChiefInvestment Officer of theMutual Fund Investor Guidefamily of newsletters.Each month he analyzesand provides buy, sell andhold recommendations forhundreds of mutual fundsand ETFs in threenewsletters: The InvestorGuide to Fidelity Funds,The ETF Investor Guideand The Investor Guide toVanguard Funds.Matthew is also theFounder and ChiefInvestment Officer ofMDS Wealth Advisors,a Registered InvestmentAdvisor that providespersonalized investmentsolutions.In ThisIssue1 Perspective2 Portfolio Updates3 Model Portfolios5 Data & Rankings15 Fund Spotlight:Vanguard ShortTerm CorporateBond ETF (VCSH)Market Perspective: 2017Should Be an ExcellentYear for EquitiesThree of the major domestic indexes finished theyear with double-digit gains. The Russell 2000Index gained 21.31 percent, the Dow Jones Industrial Average climbed 16.50 percent and theS&P 500 Index rallied 11.96 percent. The Nasdaq climbed 8.87 percent, and the MSCI EAFEmanaged a 1.00 percent gain, despite the U.S.dollar’s 5 percent advance.Many funds we hold in our model portfoliosperformed exceptionally well, especially thosewith small-cap exposure. Vanguard StrategicSmall-Cap Equity (VSTCX) climbed 20.64 percent on the year and Vanguard Explorer Value(VEVFX) gained 20.67 percent. Vanguard Selected Value (VASVX) also outperformed witha 16.34 percent gain. Vanguard Small-CapGrowth (VISGX) finished with a gain of only9.98 percent due to its lack of financial exposure.Looking forward, value equities appear to havesustainable momentum and great upside potential, a reversal of their relative performance overthe past few years. Several value oriented fundsin the newsletter portfolios caught the post-election rally as financials rebounded. Vanguard Equity Income (VEIPX) gained 14.70 percent andInvesco Diversified Dividend Investor (LCEIX)delivered a 14.33 percent return. Vanguard Financials (VFH) advanced 24.91 percent on theyear, but was up only 2.50 percent ahead of theelection.Investors looking for non-Vanguard, activelymanaged exposure to value-oriented funds haveseveral attractive options in 2017. Becker ValueEquity (BVEFX) is volatile but is a Morningstar 4-star, Bronze-rated fund with a competitive expense ratio of 0.78 percent. FAM Value(FAMVX) is a bit higher at 1.18 percent, but ithas a long record of success. FAMVX is alsounique in that it lands in the mid-cap growthcategory of Morningstar despite having 31 percent of assets in the financial services sector.American Century Value (TWVLX) is a 4-star,Silver-rated fund with a 0.98 percent expenseratio.Small-cap indexes such as the Russell 2000 aretypically overweight financials relative to theirlarge-cap peers, giving them a value tilt. Investors who want to hold financials but limit smallcap exposure can opt for Hennessy Small CapFinancials (HSFNX). Holding a modest position in HSFNX is warranted as it experiencesmore volatility. Supplementing this positionwith another diversified financial fund and orbroader small-cap fund is prudent.Dividend funds were strong performers in 2016,benefiting from falling interest rates early inthe year and following the market higher whenrates spiked. Funds that focus on growth, suchas Vanguard Dividend Appreciation (VIG), areparticularly suited to an environment of risinginterest rates, falling corporate taxes, and fastereconomic growth. VIG’s index rules filter outfinancially weak companies. Firms that useexcess leverage, for instance, could see risinginterest costs throughout the year. In contrast,the firms with solid balance sheets that makeup the VIG portfolio will be able to turn risingrevenues into higher profits and thus higher dividends.Many bond funds also performed well in2016. Floating-rate and high-yield bond fundsfared the best due to lower duration and positive changes in credit risk. Thompson Bond(THOPX) advanced 10.42 percent, VanguardHigh-Yield Corporate (VWEHX) climbed11.19 percent and PIMCO Floating Income rallied 10.90 percent. RidgeWorth Seix FloatingRate High Income (SAMBX), which gained11.14 percent in 2016, is an excellent fund thatshould continue to perform well in 2017. Longterm U.S. Treasury bonds fared worse, barelykeeping up with inflation. Vanguard Long-TermTreasury Fund (VUSTX) gained 2 percent.If interest rates rise in 2017 and GDP growth accelerates, the U.S. dollar should extend its bull(Continued on page 2)1
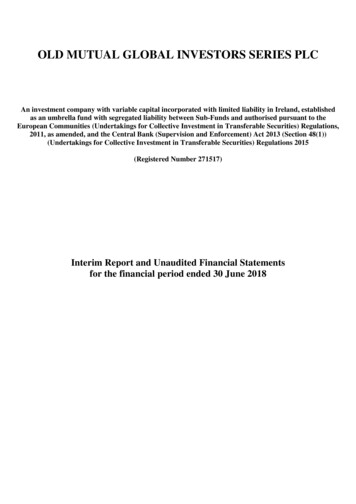
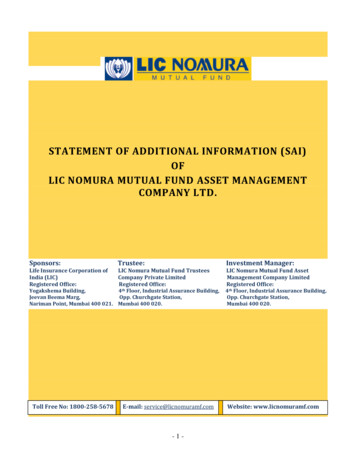
The Investor Guide to VANGUARD FundsMarket Perspective: 2017 Should Be an Excellent Year for Equities (continued)run. The U.S. Dollar Index gained 5percent in 2016, but it started the yearfalling along with interest rates. Growthestimates for the fourth quarter of 2016are rising. The Atlanta Federal Reserve’sGDPNow model ticked up to 2.9 percentin January. The spike in small-businessoptimism suggests this is not a temporaryblip, but a real trend change.In the near term, the more important figures for the stock market arefourth-quarter earnings. FactSet Research reports 73 percent of earlyreporting companies have beaten earnings, a positive sign. With these positivetrends in place, a final growth figure inthe ballpark of 5 percent isn’t a stretch.Among the sectors, only technology hasseen its estimates increase. Materials,utilities, consumer discretionary and industrials saw the largest cuts. Industrials are expected to perform well underPresident-elect Trump, but analystsforecast a 48 percent slide in airlineearnings this past quarter. Financials,Model PortfolioUpdatesIn 2016, the Russell 2000 Index gained21.31 percent, the Dow Jones IndustrialAverage 16.50 percent, the S&P 500Index 11.96 percent and the Nasdaq 8.87percent. The MSCI EAFE gained 1.00percent.In 2017, the Nasdaq is up 3.13 percent,the MSCI EAFE 1.83 percent, the S&P500 Index 1.34 percent, the Russell 20001.01 percent and the Dow Jones Industrial Average 0.47 percent.We made no changes to the portfoliosthis month.The Vanguard Aggressive GrowthPortfolio has increased 2.30 percentto start the year. Vanguard Health Care(VGHCX) led the portfolio with an increase of 4.65 percent, followed by a2.58 percent rally in Information Technology (VGT). This portfolio gained9.19 percent in 2016.consumer staples, healthcare, utilitiesand technology are expected to reportfaster growth than the S&P 500 Index,ranging from 19.8 percent for utilitiesto 3.9 percent for healthcare.Forward-looking earnings estimates aremuch higher, with 11 percent growth inS&P 500 earnings for the first quarterversus 2016. The recent spike in boththe stock market and earnings estimatesis not a coincidence. We can expecteven faster earnings growth, and subsequently faster dividend growth, if themarket continues to rise.small in terms of percentage points,they were substantial as a percentage oftotal fees. For example, Vanguard cutthe fee on its Extended Duration Treasury ETF (EDV) from 0.10 percent to0.07 percent, a 30 percent drop. Thefirm cut fees on 24 bond funds in total.Vanguard announced 35 of its funds reduced their expenses in the fiscal yearending August 31, 2016. The firm haslowered mutual fund fees from an average of 0.89 percent in 1975 to 0.18percent today. Its ETF average was 0.22percent when it launched funds in 2004.Today it is down to 0.12 percent, and0.10 percent when weighted by assets.Although many of the fee cuts wereFourteen ETFs saw fee cuts. Health Care(VHT) was cut to 0.09 percent. The suiteof Mega Cap funds’ (MGC, MGK andMGV) expense ratios were cut from0.10 percent to 0.07 percent. Amongmutual funds, Explorer Value (VEVFX)fell from 0.65 to 0.63 percent. Over thelong term, these cost reductions could besignificant for investors, which helps improve returns. It also places a great dealof pressure on their mutual fund competitors, who risk losing assets if they do notrespond with similar cuts. While expenseratios of 1.25 percent or more were oncecommon, it is becoming much harder torecommend these higher-cost offeringsunless there are very compelling reasons.The Vanguard Straight Growth Portfolio has increased 1.08 percent in 2017.Small Cap Growth (VISGX) and Selected Value (VASVX) have advanced2.16 percent and 1.60 percent, respectively. Dividend Growth (VDIGX) isup 1.15 percent. In 2016, this portfoliogained 13.74 percent.The NTF Aggressive Growth Portfolio has risen 2.37 percent year-to-date.Vanguard Health Care (VGHCX) rallied 4.65 percent to lead the portfolio.PRIMECAP Odyssey Growth (POGRX)was also a strong performer with a 3.60percent gain to start the year. In 2016,this portfolio gained 6.94 percent.The Vanguard Balanced Growth Portfolio has increased 0.56 percent yearto-date. Dividend Growth (VDIGX)rose 1.15 percent. A pullback in interestrates helped Short-Term Corporate Bond(VCSH) climb 0.09 percent. Equity Income (VEIPX) got off to a slower start,climbing 0.31 percent. This portfoliogained 8.59 percent in 2016.The Vanguard Conservative IncomePortfolio has advanced 0.49 percent thisyear. High-Yield Corporate (VWEHX)increased 0.86 percent to lead the portfolio, followed by Dividend Appreciation’s (VIG) 0.68 percent gain. In 2016,this portfolio gained 10.35 percent.2 JANUARY 2017 PHONE: (888) 252-5372The NTF Straight Growth Portfoliohas increased 1.11 percent in 2017. Vanguard PRIMECAP (VPMCX) has gained2.73 percent, while Vanguard SelectedValue (VASVX) has rallied 1.60 percent.In 2016, this portfolio gained 12.58 percent.The NTF Balanced Growth Portfoliohas climbed 0.28 percent this year. Vanguard Dividend Appreciation (VIG) ledwith an increase of 0.68 percent. PIMCOFloating Income (PFIDX) advanced 0.36percent as short-term rates kept movinghigher. This portfolio gained 10.53 percent in 2016.(Continued on page 16)
Model Portfolios(Data provided as of 1/10/17)Vanguard Aggressive GrowthSYMBOLFundVGHCXVGTVSTCXVCVLXVFHVanguard Health CareVanguard Information TechnologyVanguard Strategic Small-Cap EquityVanguard Capital ValueVanguard Financials ETFPriceSharesAllocation1 .65%2.58%1.22%1.25%0.78%4.65%2.58%1.22%1.25%0.78% 32,985.28 29,127.25 18,338.58 10,499.65 34,031.412.30%2.30% 124,982.17TOTALVanguard Straight Growth PortfolioSYMBOLFundVDIGXVASVXVEVFXMGVVISGXVanguard Dividend GrowthVanguard Selected ValueVanguard Explorer ValueVanguard Mega Cap ValueVanguard Small Cap GrowthPriceSharesAllocation1 15%1.60%0.83%0.27%2.16%1.15%1.60%0.83%0.27%2.16% 37,411.16 24,230.02 25,012.59 26,153.67 11,651.341.08%1.08% 124,458.78TOTALVanguard Balanced Growth PortfolioSYMBOLFundPriceSharesAllocation1 MONTHYTDValueVEIPXVIGVDIGXVWINXVCSHVanguard Equity IncomeVanguard Dividend AppreciationVanguard Dividend GrowthVanguard Wellesley IncomeVanguard ST Corp 1.15%0.35%0.09%0.31%0.68%1.15%0.35%0.09% 31,989.49 16,593.78 31,175.97 23,335.70 16,037.770.56%0.56% 119,132.72TOTALVanguard Conservative Income PortfolioSYMBOLFundPriceSharesAllocation1 MONTHYTDValueVFSTXVWEHXVEIPXVWINXVIGVanguard Short-Term Investment GradeVanguard High-Yield CorporateVanguard Equity IncomeVanguard Wellesley IncomeVanguard Dividend 19%0.86%0.31%0.35%0.68%0.19%0.86%0.31%0.35%0.68% 15,916.81 27,904.89 31,989.49 23,151.85 16,593.780.49%0.49% 115,556.82TOTALUser GuideRank: Our proprietary ranking systemuses both technical and fundamental analysis to identify those funds expected tooutperform over the following 6 months,on a risk adjusted basis.Advice: Based on technical and fun-damental indicators, we issue buy, holdand sell recommendations based upon expected future performance. We often avoidrecommending funds that are extraordinarily volatile or are exposed to significantmarket risk.Performance Returns: YTD,1-month, 3-month and 1-year returns arecalculated each month based on the trailingreturns. For 3-year and 5-year periods, returns are annualized.Yield %: We use the 30-day SEC Yield toprovide the expected income generated byeach fund, as reported by the fund in its mostrecent filing.Beta: The 3-year Beta is the measure ofthe volatility, or systematic risk of the fundas compared to the market. A Beta of 1.3will typically be 30% more volatile thanthe market.Standard Deviation (SD): Alsoused to measure volatility, is determinedfrom the monthly returns of the fund overthe previous 3 years. Those funds withhigher standard deviations are more volatile as compared to those with a lower standard deviation.Expense Ratio: The expense ratio isthe fee charged by the mutual fund. Thischarge is deducted from the return of thefund, impacting performance. Please note,funds may have different share classeswith varying expenses associated witheach class.www.MutualFundInvestorGuide.com JANUARY 2017 3
The Investor Guide to VANGUARD FundsNTF Aggressive Growth PortfolioSYMBOLFundPOGRXVEIPXVGHCXVFHPRIMECAP Odyssey GrowthVanguard Equity IncomeVanguard Health CareVanguard Financials ETFPriceSharesAllocation1 78%3.60%0.31%4.65%0.78% 40,827.31 28,051.27 26,388.22 30,219.222.37%2.37% 125,486.02TOTALNTF Straight Growth PortfolioSYMBOLFundFAMVXVPMCXLCEIXVDIGXVASVXFAM ValueVanguard PRIMECAPInvesco Diversified Dividend InvestorVanguard Dividend GrowthVanguard Selected ValuePriceSharesAllocation1 0.59%2.73%0.16%1.15%1.60%0.59%2.73%0.16%1.15%1.60% 32,106.21 23,727.65 31,912.78 18,706.03 17,682.471.11%1.11% 124,135.13TOTALNTF Balanced Growth PortfolioSYMBOLFundPriceSharesAllocation1 MONTHYTDValueVFSTXVMNFXVIGLCEIXVEIPXPFIDXVanguard Short-Term Investment GradeVanguard Market NeutralVanguard Dividend AppreciationInvesco Diversified Dividend InvestorVanguard Equity IncomePIMCO Floating %0.68%0.16%0.31%0.36% 13,451.68 8,166.98 16,448.96 25,530.22 31,990.56 21,989.290.28%0.28% 117,577.70TOTALNTF Conservative Income PortfolioSYMBOLFundPriceSharesAllocation1 d Short-Term Investment GradePIMCO Floating IncomeThompson BondVanguard Wellesley IncomeVanguard Dividend GrowthVanguard 6%0.36%0.35%1.15%0.92% 26,863.17 15,928.88 10,613.39 17,363.89 18,415.53 24,256.380.57%0.57% 113,441.24TOTALNTF Global PortfolioSYMBOLFundPriceSharesAllocation1 MONTHYTDValueVGKVMVFXWAGOXWAGTXMGLBXPDVDXVanguard European Stock IndexVanguard Global Minimum VolatilityWasatch Global OpportunitiesWasatch World InnovatorsMarsico GlobalPIMCO 0.59%4.05%2.16%3.02%0.57% 13,607.79 32,366.87 10,626.09 18,093.47 14,293.80 22,033.931.55%1.55% 111,021.95TOTALNTF Absolute Return/Down Market PortfolioSYMBOLFundPriceSharesAllocation1 MONTHYTDValueVMNFXVFSTXTHOPXVSGBXPFIDXVanguard Market NeutralVanguard Short-Term Investment GradeThompson BondVanguard Short-Term FederalPIMCO Floating .19%0.36%0.09%0.36%-0.32%0.19%0.36%0.09%0.36% 27,223.27 31,320.41 26,533.48 10,320.88 14,258.350.11%0.11% 109,656.38TOTAL4 JANUARY 2017 PHONE: (888) 252-5372
Data & Rankings(Data provided as of 1/10/17)% Return (3 and 5 Years 8084958788AdviceYTD1 Month 3 Month1 Year3 Year5 4.4313.4714.0114.2514.0015.4214.2214.30Yield %Beta3 YearSD3 YearExpenseRatioVANGUARD GROWTH FUNDSVanguard S&P Mid-Cap 400 Growth ETFVanguard S&P Mid-Cap 400 ETFVanguard S&P Mid-Cap 400 Value ETFVanguard Mega Cap ETFVanguard Mega Cap Growth ETFVanguard Mega Cap Value ETFVanguard Small Cap Index InvVanguard Selected Value InvVanguard Small-Cap ETFVanguard Small-Cap Growth ETFVanguard Small-Cap Value ETFVanguard Capital Value InvVanguard Dividend Appreciation Idx InvVanguard Diversified Equity InvVanguard Dividend Growth InvVanguard Equity-Income InvVanguard Explorer Value InvVanguard Extended Market Idx InvVanguard Explorer InvVanguard 500 Index InvVanguard FTSE Social Index InvVanguard Capital Opportunity InvVanguard High Dividend Yield Index InvVanguard Dividend Appreciation ETFVanguard Growth Index InvVanguard Mid Cap Index InvVanguard S&P Small-Cap 600 Growth ETFVanguard S&P Small-Cap 600 ETFVanguard S&P Small-Cap 600 Value ETFVanguard Small Cap Growth Index InvVanguard Small Cap Value Index InvVanguard Value Index InvVanguard Large Cap Index InvVanguard Mid-Cap Growth Index InvVanguard Mid Cap Growth InvVanguard Market Neutral InvVanguard Morgan Growth InvVanguard Mid-Cap Value Index InvVanguard Mid-Cap ETFVanguard Mid-Cap Value ETFVanguard Russell 1000 ETFVanguard Russell 1000 Growth ETFVanguard Russell 1000 Value ETFVanguard S&P 500 ETFVanguard S&P 500 Growth ETFVanguard S&P 500 Value ETFVanguard Mid-Cap Growth ETFVanguard PRIMECAP Core InvVanguard PRIMECAP InvVanguard Growth & Income InvVanguard Strategic Equity InvVanguard Strategic Small-Cap Equity InvVanguard Russell 3000 ETFVanguard Total Stock Market ETFVanguard Total Stock Mkt Idx InvVanguard Value ETFVanguard Russell 2000 Growth ETFVanguard Russell 2000 ETFVanguard Russell 2000 Value ETFVanguard Growth ETFVanguard US Value InvVanguard Large-Cap ETFVanguard Windsor InvBuyBuyStrong BuyStrong BuyStrong BuyStrong BuyStrong BuyStrong BuyStrong BuyStrong BuyStrong BuyStrong BuyStrong BuyBuyStrong BuyStrong BuyStrong BuyHoldBuyBuyBuyStrong BuyStrong BuyStrong BuyBuyBuyBuyBuyStrong BuyStrong BuyStrong BuyStrong BuyBuyStrong BuyHoldBuyBuyBuyBuyBuyBuyStrong BuyBuyBuyStrong BuyStrong BuyStrong BuyStrong BuyStrong BuyStrong BuyStrong BuyStrong BuyBuyBuyBuyStrong BuyBuyBuyStrong BuyBuyStrong orGuide.com JANUARY 2017 5
The Investor Guide to VANGUARD Funds% Return (3 and 5 Years Annualized)SymbolNameNAVRankAdviceYTD1 Month 3 MonthBeta3 YearSD3 YearExpenseRatio1 Year3 Year5 Yield %VANGUARD GROWTH FUNDS (continued)VWNFXVWUSXVXFVYMVanguard Windsor II InvVanguard US Growth InvVanguard Extended Market ETFVanguard High Dividend Yield d Materials ETFVanguard Consumer Discretionary ETFVanguard Consumer Staples ETFVanguard Energy ETFVanguard Financials ETFVanguard Energy InvVanguard Health Care InvVanguard Precious Metals and Mining InvVanguard REIT Index InvVanguard Information Technology ETFVanguard Global ex-US Rel Est Idx InvVanguard Health Care ETFVanguard Industrials ETFVanguard REIT ETFVanguard Global ex-US Real Estate ETFVanguard Telecommunication Services ETFVanguard Utilities ard Intermediate-Term Bond ETFVanguard Long-Term Bond ETFVanguard Total Bond Market ETFVanguard Short-Term Bond ETFVanguard Extended Duration Treasury ETFVanguard Interm-Term Bond Index InvVanguard Short-Term Bond Index InvVanguard Long-Term Bond Index InvVanguard Total Bond Market Index InvVanguard Intermediate-Term Corp Bd ETFVanguard Long-Term Corporate Bond ETFVanguard Short-Term Corporate Bond ETFVanguard Convertible Securities InvVanguard Interm-Term Invmt-Grade InvVanguard GNMA InvVanguard Short-Term Treasury InvVanguard Interm-Term Treasury InvVanguard Short-Term Investment-Grade InvVanguard Intermediate-Term Govt Bd ETFVanguard Long-Term Government Bond ETFVanguard Emerg Mkts Govt Bd Idx InvestorVanguard Short-Term Government Bond ETFVanguard Inflation-Protected Secs InvVanguard Mortgage-Backed Securities ETFVanguard Ltd-Term Tx-ExVanguard Short-Term Federal InvVanguard Total Intl Bd Idx InvestorVanguard Target Retirement Income InvVanguard Shrt-Term Infl-Prot Sec Idx InvVanguard Long-Term Treasury InvVanguard High-Yield Tax-ExemptVanguard High-Yield Corporate InvVanguard Long-Term Investment-Grade InvVanguard Interm-Term Tx-Ex InvVanguard Long-Term Tax-ExemptVanguard Short-Term 87972VASGXVASIXVBINXVGSTXVanguard LifeStrategy Growth InvVanguard LifeStrategy Income InvVanguard Balanced Index InvVanguard STAR InvBuyBuyBuyStrong Buy1.393.061.75-0.180.081.47-0.08-0.18VANGUARD SECTOR FUNDSBuyHoldBuyHoldStrong BuyHoldStrong BuyHoldSellStrong BuySellStrong BuyStrong RD INCOME FUNDSHoldSellHoldStrong BuySellHoldStrong BuySellHoldHoldSellStrong BuyStrong BuyBuyHoldBuyHoldStrong BuyHoldSellHoldBuyHoldBuyBuyStrong BuyHoldBuyBuySellStrong BuyStrong 1.050.200.500.771.851.090.82VANGUARD ASSET ALLOCATION29.2914.9731.4424.096 JANUARY 2017 PHONE: (888) .780.601.19
% Return (3 and 5 Years Annualized)SymbolNameNAVRankAdviceYTD1 Month 3 Month1 Year3 Year5 YearYield %Beta3 YearSD3 YearExpenseRatioVANGUARD ASSET ALLOCATION XVWINXVanguard Managed Payout InvestorVanguard LifeStrategy Cnsrv Gr InvVanguard LifeStrategy Moderate Gr InvVanguard Target Retirement 2010 InvVanguard Target Retirement 2025 InvVanguard Target Retirement 2020 InvVanguard Target Retirement 2015 InvVanguard Wellington InvVanguard Wellesley Income Vanguard Developed Markets Idx InvestorVanguard FTSE Developed Markets ETFVanguard Emerging Mkts Stock Idx InvVanguard FTSE All-World ex-US ETFVanguard European Stock Index InvVanguard FTSE All-Wld ex-US SmCp Idx InvVanguard FTSE All-World ex-US Index InvVanguard FTSE Europe ETFVanguard Total Intl Stock Index InvVanguard Global Equity InvVanguard Intl Div Appreciation ETFVanguard International Explorer InvVanguard Emerg Mkts Sel Stk InvVanguard Global Minimum Volatility InvVanguard Pacific Stock Index InvVanguard FTSE Pacific ETFVanguard FTSE All-World ex-US Sm-Cp ETFVanguard Total World Stock ETFVanguard International Value InvVanguard Total World Stock Index InvVanguard International Growth InvVanguard FTSE Emerging Markets ETFVanguard Total International Stock ETFVanguard Intl High Div Yield BAFAXBAGAXBARAXAmerican Beacon Lg Cap Value InvAmerican Beacon The London Co Inc Eq InvAmerican Century Core Equity Plus InvAmerican Century Capital Val InvASTON/LMCG Small Cap Growth NAmerican Century Disciplined Growth InvASTON/River Road Div All Cap Val II NAmerican Century Fundamental Equity InvAkre Focus RetailAmerican Century Large Company Val InvAmana Growth InvestorAmana Income InvestorASTON/Anchor Capital Enhanced Equity NAmerican Beacon Mid Cap Value InvAmerican Century Veedot InvAmerican Century Small Cap Growth InvAmerican Century One Choice VryAgrsvInvAriel Discovery InvestorAriel Focus InvestorAriel In
Many funds we hold in our model portfolios performed exceptionally well, especially those with small-cap exposure. Vanguard Strategic Small-Cap Equity (VSTCX) climbed 20.64 per - cent on the year and Vanguard Explorer Value (VEVFX) gained 20.67 percent. Vanguard Se-lected Value (VASVX) also outperformed with a 16.34 percent gain. Vanguard Small-Cap