Transcription
International Journal of Business and Management ReviewVol.6, No.9, pp.47-55, October 2018Published by European Centre for Research Training and Development UK (www.eajournals.org)THE APPLICATION OF EXCEL IN FINANCIAL STATEMENT ANALYSIS -CONSTRUCTING DUPONT ANALYSIS SYSTEM MODELJunda Yang, Yun Xia*, Xiaomei Chen, Liu Yang and Zhongtao Zhang*Associate Professor in Financial Management, Finance Department of InternationalBusiness School, Jinan University, China (corresponding author)E-mail: 13676097885@163.comABSTRACT; Financial statements are an important part of corporate financial management.Through analysis of corporate financial statements, management can timely identify thestrengths and weaknesses of the company and make appropriate financial adjustments in atimely manner. Excel is a powerful tabular analysis tool that sorts, filters, and aggregates largeamounts of data, simultaneously. Taking the financial statements of By-Health Co., Ltd as anexample, this paper constructs DuPont analysis system through Excel to analyze financialstatements and explore the application of Excel in financial statements.KEYWORDS:Excel, Financial Statement Analysis, DuPont Analysis SystemINTRODUCTIONExcel Overview and ApplicationWith its intuitive interface, powerful data processing function and simple operation skills,Microsoft Excel has met the different requirements of financial management for financial staff.It is the most widely used data analysis tool for modern financial staff in daily financial work(Degui Guo,2012). Its special tools, functions and so on, gradually in the enterprise accountingand financial work is indispensable (Wenjing Xu,2015). It can automatically calculate the dataand quickly sort, filter, and automatically summarize a large amount of data, completingrelatively complex data analysis. At the same time, it can be used to make bar chart, line chart,scatter chart and other charts (Sijia Guo,2015). Excel integrates common table calculation,abundant chart display and convenient data analysis. It has simple operation mode, powerfulfunction and perfect report system, and is widely used in financial management operation.Therefore, excel can play an important role in the analysis of corporate financial statements.In-depth study of the application of excel in corporate financial statements can effectively helpfinancial staff reduce errors and save time, thus improving efficiency.Excel is widely used in modern life. Shangchu Li and Hong Zhao (2017) proposed that Excelcould be used for teaching and statistical analysis of students' grades. Mingliang Ma (2013)believed that Excel could be used for the input, statistics and analysis of information of teachersin colleges and universities. In addition, it can also be used to build comprehensive archivesdatabase, facilitating the construction of enterprise archives informatization (JianhuaLiu,2017). Excel also plays a powerful role in the statistical analysis of tax data (BaochunXu,2013) and health statistics (Xiaodong Yu,2013).47Print ISSN: 2052-6393(Print), Online ISSN: 2052-6407(Online)
International Journal of Business and Management ReviewVol.6, No.9, pp.47-55, October 2018Published by European Centre for Research Training and Development UK (www.eajournals.org)Specifically, in terms of financial management and financial statement analysis, Aijun Zhongand Dan Zou (2018) used Excel to conduct regression analysis and financial forecast ofenterprise financial data with examples. According to the financial statements of the company,Excel can be used for sales forecasting, cost calculation and profit management (Hang Zhou,2014), and the company's operating status and financial status can be examined in terms ofprofitability, solvency, operating efficiency and cash flow (Yu Li, 2008). It can be seen thatExcel is also very popular in financial statement analysis because of its intuitive interface, thepower of data analysis and the simplicity of operation skills.Financial Statement Analysis and DuPont Analysis SystemFinancial statement analysis is a management work to comprehensively compare and evaluatethe financial status, operating results and cash flow of an enterprise by collecting and sortingout relevant data in the enterprise's financial and accounting reports and combining with otherrelevant supplementary information, so as to provide the users of financial and accountingreports with the basis of management decision-making and control. The purpose of financialstatement analysis is to transform financial statement data into useful information to helpinformation users improve their decision-making. Among them, DuPont Analysis is one of themost commonly used financial statement analysis tools. DuPont Analysis system is asystematic method of comprehensive and systematic evaluation of the company's financialstatus and operating results by using the internal relations among major financial ratios. Thesystem is based on ROE, and decomposes ROA and equity multiplier, with the focus onrevealing the impact of the company's profitability and leverage level on ROE as well as theinteraction between various related indicators. DuPont Analysis can help enterprisemanagement more clearly see the determinants of return on equity, and operating net profitmargin and total asset turnover, the correlation relationship between the debt ratio, provides aclear overview to management whether the company assets management efficiency andmaximize shareholder returns roadmap. Among them, the calculation formula and significanceof several core indicators are as follows:ROE Operating net profit margin*Total assets turnover* Equity multiplier. ROE is the core ofthe DuPont Analysis System, which reflects the level of compensation paid to owners' equityand is often used for comparisons between different companiesTotal assets turnover Operating income/ Total assets. Total assets turnover reflects the flowrate of all assets from input to output during the operation of the enterprise, and reflects themanagement quality and utilization efficiency of all assets of the enterprise.Equity multiplier Total assets/ Total of owner's equity 1 / (1- Total liabilities/Total assets).Equity multiplier reflects the size of corporate financial leverage. The larger the equitymultiplier, the smaller the proportion of capital invested by shareholders in assets, and thelarger the financial leverage. The following part takes part of the accounting and financialindicators of By-Health Co., Ltd from 2012 to 2015 as an example to establish DuPont AnalysisSystem.48Print ISSN: 2052-6393(Print), Online ISSN: 2052-6407(Online)
International Journal of Business and Management ReviewVol.6, No.9, pp.47-55, October 2018Published by European Centre for Research Training and Development UK (www.eajournals.org)Table1. Part of accounting indicators of By-Health Co., Ltd from 2012 to 20152012201320142015Total 5.964,905,409,684.72Total .15351,551,060.45Operating 6.892,266,043,013.70Net 0,340,386.91Table 2. Main financial indicators of By-Health Co., Ltd for 2012-20152012Working capital14.51Current ratio9.54Quick ratio8.30Cash ratio7.40Cash flow ratio0.66Asset-liability ratio8.44%Equity ratio0.09Equity multiplier1.09Debt-to-long capital ratio0.46%Times interest earned-8.30Cash flow interest coverage multiple-3.12Ratio of net cash flow from operating 62.35%activities to total of liabilitiesReceivables turnover ratio36.11Inventory turnover ratio6.60Current assets turnover0.66Working capital turnover rate0.72Non-current assets turnover2.85Total assets turnover0.51Operating net profit margin26.28%Total net asset interest rate13.40%Net interest rate14.61%Ratio of cash received from goods and 1.07services to sales revenueNet cash flow from operating activities 1.11(Unit:100,000,000)Ratio of net operating cash39.64%flow to net 8% 111.53%102.42%49Print ISSN: 2052-6393(Print), Online ISSN: 2052-6407(Online)
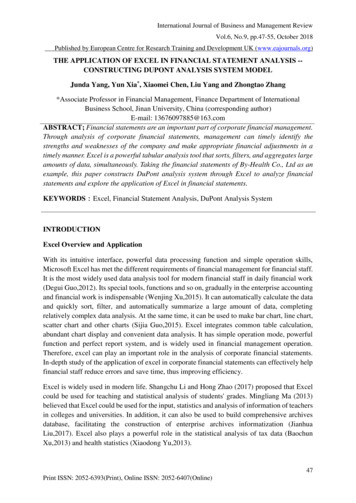
International Journal of Business and Management ReviewVol.6, No.9, pp.47-55, October 2018Published by European Centre for Research Training and Development UK (www.eajournals.org)Table 3. DuPont Analysis tableEquity multiplierROAOperating net profit 3.62%According to the formula of DuPont Analysis System, ROE ROA * Total assets turnover *Equity multiplier. In this way, part of the financial indicators of By-Health Co., Ltd from 2012to 2015 are integrated into DuPont Analysis, which can be used for specific financial analysis.Research ContentsEstablishing DuPont Analysis System framework in ExcelFor the sake of simplicity, only the consolidated balance sheet and the consolidated incomestatement in the 2015 annual report of By-Health Co., Ltd is selected as an example.First step: Create a new Excel file, rename sheet1 to Consolidated Income Statement and importthe relevant data. Sheet2 is renamed to Consolidated Balance Sheet and import relevant data.Sheet3 is renamed to Basic Framework of DuPont Analysis System and DuPont AnalysisSystem is drawn by establishing project frame and connection. The basic frame diagram, eachproject box includes the project name and calculation formula (calculation result). As shownbelow:Figure 1. Consolidated income statement of By-Health Co., Ltd 2015 annual report50Print ISSN: 2052-6393(Print), Online ISSN: 2052-6407(Online)
International Journal of Business and Management ReviewVol.6, No.9, pp.47-55, October 2018Published by European Centre for Research Training and Development UK (www.eajournals.org)Figure 2. Consolidated balance sheet of By-Health Co., Ltd 2015 annual reportFigrue 3. Basic framework of DuPont Analysis System in Excel sheetStep 2: Define the data link and enter the relevant formula. Part of the data in the frame diagramis directly derived from the consolidated income statement and the consolidated balance sheet.Therefore, the data connection can be established directly through the method referencedbetween the tables in the workbook. Other data that cannot be directly obtained is calculatedby the formula definition. The specific steps are as follows:Net profit 'Consolidated Income Statement'!B12Operating income 'Consolidated Income Statement'!B5Total assets 'Consolidated Balance Sheet'!B1051Print ISSN: 2052-6393(Print), Online ISSN: 2052-6407(Online)
International Journal of Business and Management ReviewVol.6, No.9, pp.47-55, October 2018Published by European Centre for Research Training and Development UK (www.eajournals.org)Total liabilities 'Consolidated Balance Sheet'!B13After all the accounting indicators have been confirmed, the results of the produced Excel tableare shown below:Figure 4. Basic framework of DuPont Analysis System in Excel sheetThe following are the financial indicators needed to calculate the DuPont Analysis.Operating net profit margin C10 Net profit B13 / Operating income D13 0.2738Total assets turnover G10 Operating income F13 / Total assets H13 0.4619ROA E7 Operating net profit margin C10 * Total assets turnover G10 0.1265Equity multiplier M7 1 / (1 - Total liabilities N10 / Total assets L10) 1.0772ROE I4 Operating net profit margin C10 * Total assets turnover G10 * Equity multiplier M7 0.1362After the completion of all the items, the output of the DuPont analysis table is shown in thefollowing figure:Figure 5. Basic framework of DuPont Analysis System in Excel sheet52Print ISSN: 2052-6393(Print), Online ISSN: 2052-6407(Online)
International Journal of Business and Management ReviewVol.6, No.9, pp.47-55, October 2018Published by European Centre for Research Training and Development UK (www.eajournals.org)So far, all indicators of the company's DuPont Analysis in 2015 have been completed. Repeatthe above steps to complete the data for 2012-2014. After that, when DuPont Analysis is carriedout every year, it only needs to change the data of annual accounting statement, and theframework diagram of DuPont Analysis will be generated automatically, which can greatlyimprove the work efficiency.The application of DuPont AnalysisThe first step is to analyze the financial indicators of By-Health Co., Ltd in two years with2012 as the comparison standard.In the second step, the factor analysis method is used to determine the direction and extent ofthe impact of changes in relevant factors on ROE. The serial replacement is based on thecalculated data of the relevant financial indicators of the DuPont System.26.28% * 0.51 * 1.09 14.61%28.45% * 0.51 * 1.09 15.82% 1.21% Impact of changes in operating net profit margin28.45% * 0.60 * 1.09 18.61% 2.79% Impact of changes in total assets turnover28.45% * 0.60 * 1.10 18.78% 0.17%Impact of changes in equity .17% Comprehensive impactThe third step is to analyze the reasons for the changes in indicators such as ROE.By-Health Co., Ltd in 2013, ROE increased by 4.17% compared with 2012. The main reasonfor the increase in ROE is the increase in total assets turnover and the increase in operating netprofit margin. Operating net profit margin increase of 2.17% increased the return on equity by1.21%, and total assets turnover rate of 0.09 increased the return on equity by 2.79%. Operatingnet profit margin represents the company's profitability, and total assets turnover represents thecompany's comprehensive asset management capabilities. The combination of the tworepresents the company's operating efficiency. This shows that the operating efficiency of ByHealth Co., Ltd has improved.By-Health's 2012 annual total assets turnover was 0.51, and that in 2013 was 0.60. The reasonfor the accelerated asset turnover rate in 2013 was that the increase in operating income (up39%) was faster than the increase in asset occupancy (up 17%), and the efficiency of thecompany's use of its total assets to generate operating income was increasing.53Print ISSN: 2052-6393(Print), Online ISSN: 2052-6407(Online)
International Journal of Business and Management ReviewVol.6, No.9, pp.47-55, October 2018Published by European Centre for Research Training and Development UK (www.eajournals.org)The company's 2013 equity multiplier increased by 0.01 because the asset-liability ratioincreased from 8.44% to 9.06. When the company's profitability is higher than the cost ofcapital, the asset yield will increase. It shows that it has achieved certain effects in the effectiveuse of debt management.CONCLUSIONDuPont Analysis method can use the internal relationship between financial indicators tosystematically analyze and evaluate the company's comprehensive management wealth andeconomic benefits, effectively reflect the interrelationship between various indicators ofcorporate profitability, and make a reasonable analysis of the financial results of enterprises. Ittakes ROE as the core indicator, decomposes at different levels, analyzes and evaluates theprofitability, management ability and solvency of the enterprise in a certain period of time, andconstitutes a completed system. Therefore, it can better help managers to discover problems inthe company's financial and operational management, provide valuable information forenterprises to improve their management level, facilitate enterprises to expand sales, save costs,accelerate capital turnover, rationally arrange capital structure, and effectively preventfinancial risk. At the same time, the combination of financial statement analysis and Excel'schart data processing capabilities enables a complete analysis of the financial indicator system.Excel can help the accountant quickly enter the company's financial statement data andcalculate the company's financial indicators. It can also help company managers use Excel toquickly build a financial indicator system analysis such as the DuPont analysis system, analyzethe company's financial structure, and find information that is conducive to improvingcorporate governance. It not only simplifies the complicated financial management work, butalso greatly improves the work efficiency. It also enables the company's management personnelto arrange funds reasonably, improve the company's performance, and effectively prevent risks.All in all, Excel's intuitive interface, powerful data processing functions, and simple operationskills meet the different needs of financial personnel for all aspects of financial management.It is an indispensable data analysis tool for modern financial personnel in daily accountingwork. Skilled use of Excel is a must-have skill for modern financial managers.AcknowledgmentsThis study is supported by the 19th Batch of Teaching Reform Research Projects of JinanUniversity. The project name is Reform and Practice of Company Financial SimulationTraining Based on Excel (Project NO.JG2017052).REFERENCEChen, X. T., Wang, W. (2017). Application of ExceL in Analysis of Enterprise FinancialStatements. Chinese & Foreign Entrepreneurs, (12):132 134.Guo, D. G. (2012). Excel Applied Research in Financial Management. Communication of54Print ISSN: 2052-6393(Print), Online ISSN: 2052-6407(Online)
International Journal of Business and Management ReviewVol.6, No.9, pp.47-55, October 2018Published by European Centre for Research Training and Development UK (www.eajournals.org)Finance and Accounting, (07):113-114.Guo, S. J. (2015). Practical Application of ExceL in Analysis of Enterprise FinancialStatements. China Business, (09):90.Li, S. C., Zhao, H. (2017). Application of Excel Software in Teaching. Teaching of ForestryRegion, (06):82-85.Li, Y. (2008). Application of Excel in Financial Statement Analysis of Financial Enterprises.FINANCIAL TECHNOLOGY TIME, 16(8):32-34.Liu, J. H. (2017). Problems and Countermeasures of Enterprise Archives Management underthe Condition of Informationization. Office Operation, (07):60-61.Ma, M. L. (2013). Application of Excel Function in Teacher Information Statistics. FujianComputer, 29(12):147-150.Xu, B. C. (2013). Application of Excel2010 in Statistical Analysis of Tax Data.ELECTRONIC TECHNOLOGY & SOFTWARE ENGINEERING, (14):143-144.Xu, W. J. (2015). Application of Excel in Accounting and Financial Work. The financialtimes, (26):169 175.Yu, X. D. (2013). Application Analysis of Excel in Health Statistics Work. China HealthIndustry, 10(13):179 181.Zhong, A. J., Zhou, D. (2018). Financial forecasting, Regression analysis and Excelmodelling. Journal of Xiangyang technical college,17(03):84-86.Zhou, H. (2014). On the Application of Excel Table in Financial Management. BUSINESS,(19):89.55Print ISSN: 2052-6393(Print), Online ISSN: 2052-6407(Online)
KEYWORDS:Excel, Financial Statement Analysis, DuPont Analysis System INTRODUCTION Excel Overview and Application With its intuitive interface, powerful data processing function and simple operation skills, Microsoft Excel has met the different requirements of financial management for financial staff. It is the most widely used data analysis .