Transcription
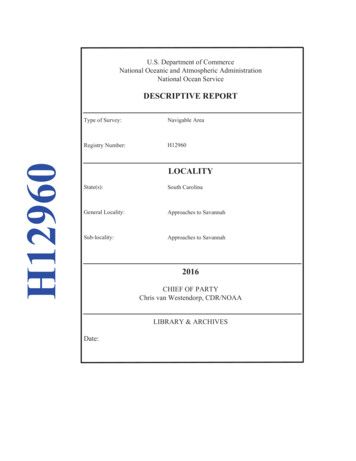
U.S. Department of CommerceNational Oceanic and Atmospheric AdministrationNational Ocean ServiceH12960DESCRIPTIVE REPORTType of Survey:Navigable AreaRegistry Number:H12960LOCALITYState(s):South CarolinaGeneral Locality:Approaches to SavannahSub-locality:Approaches to Savannah2016CHIEF OF PARTYChris van Westendorp, CDR/NOAALIBRARY & ARCHIVESDate:
U.S. DEPARTMENT OF COMMERCENATIONAL OCEANIC AND ATMOSPHERIC ADMINISTRATIONHYDROGRAPHIC TITLE SHEETINSTRUCTIONS:H12960The Hydrographic Sheet should be accompanied by this form, filled in as completely as possible, when the sheet is forwarded to the Office.State(s):South CarolinaGeneral Locality:Approaches to SavannahSub-Locality:Approaches to SavannahScale:20000Dates of Survey:11/07/2016 to 11/17/2016Instructions Dated:09/16/2016Project Number:OPR-G329-TJ-16Field Unit:NOAA Ship Thomas JeffersonChief of Party:Chris van Westendorp, CDR/NOAASoundings by:Multibeam Echo SounderImagery by:Side Scan SonarVerification by:Atlantic Hydrographic BranchSoundings Acquired in:meters at Mean Lower Low WaterRemarks:REGISTRY NUMBER:
The purpose of this survey is to provide contemporary surveys to updateNational Ocean Service (NOS) nautical charts. All separates are filed with thehydrographic data. Any revisions to the Descriptive Report (DR) generated duringoffice processing are shown in bold red italic text. The processing branchmaintains the DR as a field unit product, therefore, all information andrecommendations within the body of the DR are considered preliminary unlessotherwise noted. The final disposition of surveyed features is represented in theOCS nautical chart update products. All pertinent records for this survey,including the DR, are archived at the National Centers for EnvironmentalInformation (NCEI) and can be retrieved via https://www.ncei.noaa.gov/.
Table of ContentsA. Area Surveyed. 1A.1 Survey Limits.1A.2 Survey Purpose. 3A.3 Survey Quality. 3A.4 Survey Coverage. 3A.5 Survey Statistics. 6B. Data Acquisition and Processing.8B.1 Equipment and Vessels. 8B.1.1 Vessels. 8B.1.2 Equipment. 9B.2 Quality Control.9B.2.1 Crosslines. 9B.2.2 Uncertainty. 10B.2.3 Junctions. 11B.2.4 Sonar QC Checks.12B.2.5 Equipment Effectiveness.12B.2.6 Factors Affecting Soundings. 15B.2.7 Sound Speed Methods. 18B.2.8 Coverage Equipment and Methods. 19B.3 Echo Sounding Corrections. 19B.3.1 Corrections to Echo Soundings. 19B.3.2 Calibrations. 19B.4 Backscatter. 19B.5 Data Processing. 20B.5.1 Primary Data Processing Software .20B.5.2 Surfaces.20B.5.3 Surface Fliers. 21C. Vertical and Horizontal Control.22C.1 Vertical Control. 22C.2 Horizontal Control. 23D. Results and Recommendations. 23D.1 Chart Comparison.23D.1.1 Raster Charts. 29D.1.2 Electronic Navigational Charts.30D.1.3 Maritime Boundary Points .30D.1.4 Charted Features. 30D.1.5 Uncharted Features. 31D.1.6 Dangers to Navigation.31D.1.7 Shoal and Hazardous Features. 31D.1.8 Channels. 31D.1.9 Bottom Samples . 31D.2 Additional Results. 31D.2.1 Shoreline. 31i
D.2.2 Prior Surveys.31D.2.3 Aids to Navigation.31D.2.4 Overhead Features. 32D.2.5 Submarine Features.32D.2.6 Ferry Routes and Terminals.32D.2.7 Platforms.32D.2.8 Significant Features.33D.2.9 Construction and Dredging. 33D.2.10 New Survey Recommendation. 33D.2.11 Inset Recommendation. 33E. Approval Sheet.34F. Table of Acronyms. 35List of eTableTableTableTable1: Survey Limits.12: Hydrographic Survey Statistics. 73: Dates of Hydrography. 84: Vessels Used. 85: Major Systems Used. 96: Survey Specific Tide TPU Values. .107: Survey Specific Sound Speed TPU Values. .108: Junctioning Surveys. 129: Primary bathymetric data processing software. 2010: Primary imagery data processing software. 2011: Submitted Surfaces. 2012: Largest Scale Raster Charts. 2913: Largest Scale ENCs. 30List of FiguresFigure 1: H12960 Survey Extents. 2Figure 2: 100% SSS Coverage Mosaic. 4Figure 3: 200% SSS Coverage Mosaic. 5Figure 4: Multibeam coverage acquired with concurrent 200% SSS. 6Figure 5: Mainscheme to crossline difference surface statistics. 10Figure 6: Uncertainty Standards. 11Figure 7: Leeward side MBES artifact seen in slope child layer created in ArcMap 10.3, and viewed in CarisHIPS 9.1.9.13Figure 8: MBES artifact seen in depth layer with 15x vertical exaggeration. 14Figure 9: MBES artifact seen in 2D subset along-track orientation.15Figure 10: Sea-state affected soundings. 16Figure 11: Small data gaps between MBES line files.17Figure 12: Small data gaps between SSS line files displayed in H12960 SSS 100.csar mosaic. 18ii
Figure 13: H12960 geographic distribution of sound speed casts from S222.19Figure 14: Object Detection Density Requirements Plot for H12960. 21Figure 15: H12960 HSTB Auto QC Tools Flier Finder Results. 22Figure 16: Historical Surveys DEM creation using ArcMap 10.3. 24Figure 17: Age of latest historical surveys in Project Area. 25Figure 18: Position of depth differences between historical DEM and H12960 greater than 1m. Differencevalues are shown in red. .26Figure 19: H12960 DtoN Scan chart discrepancy results greater than 1m, near 31 58'3.64"N080 34'9.48"W.27Figure 20: Historical Survey DEM DtoN Scan chart discrepancy results greater than 1m near 31 58'3.64"N080 34'9.48"W.28Figure 21: Survey contours compared to charted depth curves. 29Figure 22: ATON discrepancy report sent to US Coast Guard for buoy Y "T" Fl Y 2.5s.32iii
H12960NOAA Ship Thomas JeffersonDescriptive Report to Accompany Survey H12960Project: OPR-G329-TJ-16Locality: Approaches to SavannahSublocality: Approaches to SavannahScale: 1:20000November 2016 - November 2016NOAA Ship Thomas JeffersonChief of Party: Chris van Westendorp, CDR/NOAAA. Area SurveyedHydrographic survey H12960 was completed as specified by hydrographic survey project instructions OPRG329-TJ-16, signed 16 September 2016. This survey extends approximately 12 to 22 nautical miles east ofTybee Island Light in the approaches to Savannah, Georgia (see Figure 1).A.1 Survey LimitsData were acquired within the following survey limits:Northwest LimitSoutheast Limit32 0' 43.36" N80 36' 49.48" W31 55' 18.52" N80 24' 19.09" WTable 1: Survey Limits1
H12960NOAA Ship Thomas JeffersonFigure 1: H12960 Survey ExtentsSurvey limits were acquired in accordance with the requirements in the Project Instructions and the HSSD.2
H12960NOAA Ship Thomas JeffersonA.2 Survey PurposeThe purpose of this project is to provide contemporary surveys to update National Ocean Service (NOS)nautical charting products in the approach to the Savannah Outer Harbor Channel. In order to allow deeperdraft ships such as Panamax ships which could draft 39.5 feet, the Savannah Harbor channels are beingdeepened to 49 feet at Mean Lower Low Water (MLLW), with a controlling depth of 47 feet. The maindriver for this project is based on a request from the Savannah Pilots Association. The survey area will alsoaddress concerns about migrating sand shoals.A.3 Survey QualityThe entire survey is adequate to supersede previous data.A.4 Survey CoverageThe following table lists the coverage requirements for this survey as assigned in the project instructions:Water DepthAll depths within H12960Coverage Required200% Side Scan Sonar (SSS) coverage withconcurrent Multibeam Echosounder (MBES) depthand backscatter dataSurvey coverage was in accordance with the requirements listed above and in the HSSD (see Figures 2, 3,and 4).3
H12960NOAA Ship Thomas JeffersonFigure 2: 100% SSS Coverage Mosaic4
H12960NOAA Ship Thomas JeffersonFigure 3: 200% SSS Coverage Mosaic5
H12960NOAA Ship Thomas JeffersonFigure 4: Multibeam coverage acquired with concurrent 200% SSS.A.5 Survey StatisticsThe following table lists the mainscheme and crossline acquisition mileage for this survey:6
H12960HULL IDLNMNOAA Ship Thomas s57.05700LidarCrosslinesNumber ofBottom Samples0Number MaritimeBoundary PointsInvestigated0Number of DPs0Number of ItemsInvestigated byDive Ops0Total SNM43.61Table 2: Hydrographic Survey StatisticsThe following table lists the specific dates of data acquisition for this survey:Survey DatesDay of the Year11/06/201631111/07/20163127
H12960NOAA Ship Thomas JeffersonSurvey DatesDay of the /201632011/16/201632111/17/2016322Table 3: Dates of HydrographyB. Data Acquisition and ProcessingB.1 Equipment and VesselsRefer to the Data Acquisition and Processing Report (DAPR) for a complete description of data acquisitionand processing systems, survey vessels, quality control procedures and data processing methods. Additionalinformation to supplement sounding and survey data, and any deviations from the DAPR are discussed in thefollowing sections.B.1.1 VesselsThe following vessels were used for data acquisition during this survey:Hull IDS222LOA208 feetDraft15 feetTable 4: Vessels Used8
H12960NOAA Ship Thomas JeffersonB.1.2 EquipmentThe following major systems were used for data acquisition during this in5000 V2SSSApplanixPOS/MV v5Positioning andAttitude SystemValeportModus SVSSound Speed SystemRolls RoyceBrooke Ocean MovingVessel ProfilerSound Speed SystemSeabirdSeacat 19 Conductivity, Temperature,and Depth SensorTable 5: Major Systems UsedB.2 Quality ControlB.2.1 CrosslinesCrosslines acquired for this survey totaled 4.20% of mainscheme acquisition.Crosslines were compared to mainscheme using a difference surface, created in ESRI ArcMap 10.3. A 50cmCombined Uncertainty and Bathymetric Estimator (CUBE) surface was created using strictly mainschemelines, while a second 50cm CUBE surface was created using only crosslines. The two surfaces were thendifferenced. 95.86% of nodes agree within /- 0.25m, and 99.99% of nodes agree within /- 0.50m. Themean was -0.03m and the standard deviation was 0.12m (see Figure 5). Survey H12960 crossline analysiscomplies with section 5.2.4.3 of the HSSD (2016).9
H12960NOAA Ship Thomas JeffersonFigure 5: Mainscheme to crossline difference surface statisticsB.2.2 UncertaintyThe following survey specific parameters were used for this survey:MeasuredZoningMethod0 meters0.148 metersERS via VDATUMTable 6: Survey Specific Tide TPU Values.Hull IDMeasured - CTDMeasured - MVPSurfaceS2224.0 meters/second1.0 meters/second0.2 meters/secondTable 7: Survey Specific Sound Speed TPU Values.Total Propagated Uncertainty values for survey H12960 were derived using a combination of a prioriuncertainty estimates for vessel elevation, equipment, motion, vessel characteristics, the VDatum separationmodel used to reduce soundings to chart datum, and field assigned values for sound speed uncertainties.Uncertainties for sonar mounting and vessel speed were based on Appendix 4, table 4.9 of the NOAA FieldProcedures Manual (FPM) (ed 2014). These were applied to the data via the CARIS HIPS HydrographicVessel File (.hvf). The uncertainty associated with the VDatum separation model was supplied by theHydrographic Surveys Division’s Operations Branch, and is listed under the Zoning (see table 6). Finally,the uncertainty associated with sound speed measurements were based on the frequency and location of CTDcasts, in accordance with the guidance set by Appendix 4 of the FPM (ed 2014) (see Table 7).10
H12960NOAA Ship Thomas JeffersonTotal Propagated Uncertainty was then evaluated to ensure compliance with section 5.1.3 of NOAA'sHydrographic Surveys Specifications and Deliverables. First, the maximum allowable uncertainty for eachnode was calculated using the equation: -Uncertainty/((0.25 ((Depth*0.013) 2)) 0.5). Second, the ratiobetween actual uncertainty and maximum allowed uncertainty was found for each node. The resulting'TVU QC' layer was filtered using a color map to show any areas where actual uncertainty exceeded themaximum allowed uncertainty. 100% of grid nodes of the 0.5m MBES CUBE surface meet IHO uncertaintyrequirements for IHO Order 1a surveys as seen in the Pydro CSAR QA tool output plots (see Figure 6).Figure 6: Uncertainty StandardsB.2.3 JunctionsH12960 had one contemporary junction survey.11
H12960NOAA Ship Thomas JeffersonThe following junctions were made with this survey:RegistryNumberScaleYearField UnitRelativeLocationF006901:200002016NOAA Ship THOMAS JEFFERSONSWTable 8: Junctioning SurveysF00690H12960 overlaps a portion of F00690, which is a multibeam reconnaissance survey of crosslines coveringthe entire project area. Some F00690 lines were used as crosslines in the H12960 crossline comparison. Seethe crossline comparison section (Section B.2) for more information.B.2.4 Sonar QC ChecksSonar system quality control checks were conducted as detailed in the quality control section of the DAPR.B.2.5 Equipment EffectivenessDepth artifact on leeward side of EM2040 MBES swathA depth artifact on the leeward side of the MBES swath was observed during sonar acceptance testing ofNOAA Ship Thomas Jefferson's recently acquired EM2040 MBES. H12960 was subsequently the first S222MBES survey after the sonar acceptance testing. To mitigate the severity of the depth artifact, S222 operatedthe EM2040 in single sector mode, and a reduced swath angle of 45 on each side of nadir. While this wassuccessful in reducing the severity of the the artifact to at most 10-20cm on the roughest days, well below thesurvey's allowable TVU, these anomalies still manifested throughout the MBES dataset, especially duringdays with relatively rougher sea states (see Figures 7, 8, and 9). Additional information can be found in theHydrographic Systems and Technology Branch testing report, forwarded as part of the DAPR.12
H12960NOAA Ship Thomas JeffersonFigure 7: Leeward side MBES artifact seen in slope childlayer created in ArcMap 10.3, and viewed in Caris HIPS 9.1.913
H12960NOAA Ship Thomas JeffersonFigure 8: MBES artifact seen in depth layer with 15x vertical exaggeration14
H12960NOAA Ship Thomas JeffersonFigure 9: MBES artifact seen in 2D subset along-track orientationB.2.6 Factors Affecting SoundingsSea-State affected soundingsOn day numbers 312, 313, 317, and 318, the survey vessel experienced rough seas leading to several MBESblowouts. These blowouts left several gaps in the depth grid deliverable. However, these gaps were alsocovered by 100% and 200% SSS coverage, and no evidence of significant features were found therein (seeFigure 10).15
H12960NOAA Ship Thomas JeffersonFigure 10: Sea-state affected soundingsSmall data gaps between MBES line filesSmall data gaps ( 2.5m wide) between the end and start of MBES line files exist throughout the survey.However, these gaps were also covered by 100% and 200% SSS coverage, and no evidence of significantfeatures were found therein (see Figure 11).16
H12960NOAA Ship Thomas JeffersonFigure 11: Small data gaps between MBES line filesSmall data gaps between SSS line files in SSS MosaicSmall data gaps ( 2.5m wide) between the end and start of SSS line files exist throughout the survey.However, these gaps were also covered by the other 100% or 200% SSS coverage, and no evidence ofsignificant features were found therein (see Figure 12).17
H12960NOAA Ship Thomas JeffersonFigure 12: Small data gaps between SSS line files displayed in H12960 SSS 100.csar mosaicB.2.7 Sound Speed MethodsSound Speed Cast Frequency: Approximately every 30 minutesSound Speed measurements of the water-column were conducted approximately every 30 minutes usinga Moving Vessel Profiler (MVP), and more frequently in areas or times of more dynamic fluctuations insound speed. When the MVP was in maintenance, Conductivity, Temperature, and Density (CTD) casts weretaken at a frequency of 4 hours, as seen in part of day numbers 315 and 321. Figure 13 shows acquired datacolored by sound speed cast.18
H12960NOAA Ship Thomas JeffersonFigure 13: H12960 geographic distribution of sound speed casts from S222B.2.8 Coverage Equipment and MethodsRefer to Section A.4 and B.1.2. of this report for survey equipment and methods used to meet coveragerequirements for this project.B.3 Echo Sounding CorrectionsB.3.1 Corrections to Echo SoundingsAll data reduction procedures conform to those detailed in the DAPR.B.3.2 CalibrationsAll sounding systems were calibrated as detailed in the DAPR.B.4 BackscatterBackscatter was processed by the field unit using Fledermaus FMGT software.19
H12960NOAA Ship Thomas JeffersonB.5 Data ProcessingB.5.1 Primary Data Processing SoftwareThe following software program was the primary program used for bathymetric data processing:ManufacturerNameVersionCarisHIPS and SIPS9.1.9Table 9: Primary bathymetric data processing softwareThe following software program was the primary program used for imagery data processing:ManufacturerNameVersionQPSFledermaus FMGT7.6.4Table 10: Primary imagery data processing softwareThe following Feature Object Catalog was used: NOAA Profile V 5 4B.5.2 SurfacesThe following surfaces and/or BAGs were submitted to the Processing Branch:Surface NameSurfaceTypeH12960 MB 50cm MLLW FinalCUBE0.5 metersH12960 SSS 100SSS Mosaic1 meters0 meters 0 metersN/A100% SSSH12960 SSS 200SSS Mosaic1 meters0 meters 0 metersN/A200% SSSResolution Depth RangeSurfaceParameter12.57 metersNOAA 0.5m21.92 metersPurposeObjectDetectionTable 11: Submitted SurfacesThe submitted multibeam 50cm surface for survey H12960 meets density requirements for object detectionas described in section 5.2.2.2 of the HSSD 2016 (see Figure 14). For further discussion, see section A.4of this report. A very small area of the surveyed depths exceeded 20m. A deviation from the HSSD wasapproved by the HSD Project Manager to include all depths of the survey in a single deliverable 50cmsurface, although some surveyed depths exceeded 20m.20
H12960NOAA Ship Thomas JeffersonFigure 14: Object Detection Density Requirements Plot for H12960B.5.3 Surface FliersFliers were detected using HSTB Pydro tools, as well as an in-house ArcGIS script used to augment thePydro QC Tools. H12866 MB 0.5m MLLW final grid was scanned for fliers at 50cm tolerance, andyielded one potential flier. After review, the remaining flagged node was determined to be a valid object, asshown in Figure 15.21
H12960NOAA Ship Thomas JeffersonFigure 15: H12960 HSTB Auto QC Tools Flier Finder ResultsC. Vertical and Horizontal ControlPer section 5.1.2.3 of the FPM (2014 ed), no Horizontal and Vertical Control Report has been generated forSurvey H12960.C.1 Vertical ControlThe vertical datum for this project is Mean Lower Low Water.ERS Methods Used:ERS via VDATUMEllipsoid to Chart Datum Separation File:g329 full area sep xysep.csarSounding elevations relative to the ellipsoid were collected through real time precise point positioning(RT3P) via Fugro Marinestar services, as detailed in the DAPR.22
H12960NOAA Ship Thomas JeffersonC.2 Horizontal ControlThe horizontal datum for this project is World Geodetic System 1984 (WGS84).The projection used for this project is Universal Transverse Mercator (UTM) 17N.Horizontal positioning was collected through real time precise point positioning (RT3P) via FugroMarinestar services, as detailed in the DAPR.D. Results and RecommendationsD.1 Chart ComparisonSurveyed soundings were compared to existing charted soundings by two separate methods to ensureagreement in results. The first method differenced surveyed soundings to an interpolated digital elevationmodel (DEM) created from the archived survey-scale soundings of most recently charted historicalNational Ocean Service (NOS) surveys. The second method used PydroExplorer's QC Tools DtoN Scannerapplication to compare current ENC soundings to a dense shoal-biased sounding selection from H12960.The first method involved downloading archived survey-scale soundings through the National Centers forEnvironmental Information (NCEI) Data Extract System, or NEXT-web data extraction portal. A DEMrepresentative of the historical surveys was created using ESRI ArcMap 10.3 Spatial Analyst ExtensionNatural Neighbor interpolation tool, gridded to 4m (see Figure 16). The most recent hydrographic surveysin the project area were completed between 1972 and 2005; the majority of the project area was completedbetween 1994 and 1995 by NOAA Ship Whiting, with a corresponding encoded CATZOC value of A2on NOAA ENC US5GA20M (see Figure 17). The historical DEM was subtracted from the H12960 50cmdepth CUBE grid to create a difference surface, with
November 2016 - November 2016 NOAA Ship Thomas Jefferson Chief of Party: Chris van Westendorp, CDR/NOAA A. Area Surveyed Hydrographic survey H12960 was completed as specified by hydrographic survey project instructions OPR-G329-TJ-16, signed 16 September 2016. This survey extends approximately 12 to 22 nautical miles east of