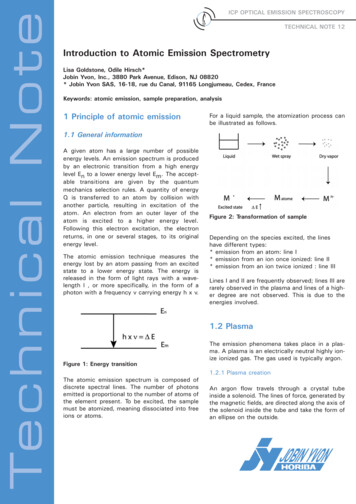
Transcription
Investigations of HAARP emission on super long radiopaths (review)Yuri Yampolski1, Andriy Zalizovski1, Alexander Koloskov1, and Gennady Milikh21Instituteof Radio Astronomy, National Academy of Sciences of Ukraine4, Chervonopraporna str.Kharkiv, 61002Ukraine2Departmentsof Physics and Astronomy, University of MarylandCollege ParkMD, 20742USA1
Outline Network of HF receivers Experiment of 2002 – self-scattering Experiments with HAARP– 2008 – confirmation of self-scattering– 2010 – receiving in Antarctica the signals fromHAARP– 2013 – excitation of the ionospheric interlayer duct– 2014 – correlation of HAARP signals received inAntarctica with SEE DM2
Network of the HF receiversSvalbard (2 channels)Tromso (2 channels)Murmansk (2 ch)State Tech. UniversityKharkiv (2 channel)Irkutsk (1 ch)ISTP RASLagos (1 channel)UAS (2 tner instruments
Experiments of October, 2002 (EISCAT)Figure. Layout of the experiment. EIS, AARI, RWM, RAO,and UAS signify, respectively, EISCAT (European IncoherentScatter Scientific Association) HF transmitter, Arctic andAntarctic Research Institute, RWM Station of the MoscowTime and Frequency Service, Radio Astronomical Observatory(of the Institute of Radio Astronomy), and Ukrainian AntarcticStation Akademik Vernadsky.Figure. Spectrograms of EISCAT heater signal received on October 29,2002 at 02:00:30-02:15:00 UT at RAO (top panel), and at UAS (bottompanel). The transmission frequencies were 4.040,717 and 4.040,695 MHz4
Experiments of February, 2008Figure. Scheme of experimentsFigure. Spectrogram of the HAARP heating signal at the RAO, Svalbard, andMillstone Hill. 2008/02/26, 03:19 04:30 UT.Figure. Spectrogram and variations of thescattered signal power after the heater wasswitched to radiate the full power andrelaxations of probe signal as observed at RAO5positions on February 26, 2008 at the HAARPtransmission frequency of 2.755,056 MHz
Experiments of May and August, 2010A specific of the August, 2010 campaign is the presence of two frequency-separated components in theprobe signal spectra. These components can be associated with signals propagating along differenttrajectories. Of special interest is the increase and decrease in the intensity of the frequency-shiftedcomponent of the probe signal observed at the time moment when the heater was turned on/off.August 3, 20106
Experiments of November, 2012IPMFigure. Layout of the experiment in different scales and the solarterminator boundary at the Earth’s surface and at the heights of 100and 300 kmCMOTRWFRNPSTFigure. Variations of DFS of HAARP signal and the magnetic field D or Y componentnear the HAARP position (CMO observatory) and along the HAARP-UAS radio path atthe observatories of the INTERMAGNET network7
Experiments of June, 2014The peak of the amplitude of the HF signalsdetected by UAS correlates with the peak of DMFigure. Spectrogram of received HF signal at UAS a) June 6th, b) June 7th.The BUM is associated with 10 cm scale striations, called super smallstriations (SSS) while the DM is associated with decameter scalestriations.Figure. Amplitudes of DM, BUM, and received power atUAS relative to maximum values, as a function of heatingfrequency.SSS are inefficient scatters of the HF waves compare to the decameterscale striations.The mirror reflection does not play an important role since the existingnonlinear dependence of the amplitude of HAARP signals on the ERPcannot be induced by the weak side lobe radiation.8
Ionospheric areas responsible for excitation of the interlayer waveguide to channelize the scattered pump energy toward theUAS and Arctic-Europe positions for the conditions of the experiment of November 13, 2013 between 2:30 and 3:15 UT.The intersections of the areas with antenna pattern projection at the scattering level are shown by blue color. The modelelectron density profile and the height of upper hybrid resonance are shown on the top panelHAARPFrom HAARPto Tromso, Svalbard, UkraineHAARPFrom HAARPto UAS Akademik Vernadsky9
Conclusions Self-scattering effects were observed simultaneously at greatly dispersed receive sites for several intervals of heatingduring the HAARP campaign of February, 2008. The similar behavior of the signals received at sites located in theUSA, Europe, and Arctic following the changes in the power of the heater can be regarded as direct evidence that thepump wave is scattered by ionospheric irregularities produced by the same wave. Signal analysis has allowedestimating the relaxation and rise times of the HAARP-stimulated ionospheric inhomogeneities which are responsiblefor the self-scattering. The observed relaxation time was equal to several tens of seconds, while the rise time extendedto a few minutes.During the measurement campaign of November 2012 the highest signal-to-noise ratio was observed for the HAARPUAS propagation path. The signal level in the Antarctic showed essential increase when the sunset solar terminatorpassed simultaneously over the receiving and transmitting sites. A high amount of correlation was observed betweenDoppler frequency shift variations at the UAS and D-component of geomagnetic field fluctuations measured close tothe HAARP heater (the correlation coefficient was about -0.89) that can be considered as indirect evidence ofionospheric waveguide propagation of pump emission.According to the results of the measuring campaign of June 2014 it was shown that the intensity of the signal receivedat UAS strongly depends on the heating frequency and on the intensity of the pumping wave. Thus the HAARP signalsdetected at UAS originated by the HF-pumping of the artificial striations which in turn scatters HF radiation into theionospheric channel. The usual multi-hop propagation mode of the HAARP side lobe parasite radiation does not playan important role.ACKNOWLEDGEMENTSThis work has been done under partial funding of EOARD-STCU partner projects P-330 and P-524,and under logistic support of National Antarctic Scientific Center of Ukraine.Thank you!10
11
12
Extra slidesMap of radio paths with receiving site at the Akademik Vernadsky station13
AbstractHAARP facility is unique research instrument, which can be used both for investigations of the interaction betweenhigh-power electromagnetic waves and ionospheric plasma and for studying of propagation effects on long-distantHF radio paths. The observation of HAARP signals at several geographically dispersed radio sites are carried outin the Institute of Radio Astronomy, National Academy of Sciences of Ukraine (IRA NASU) for about ten years.They are performed using the network of digital HF receivers developed by the IRA NASU team. It worth to notethat access to the data and remote control by the acquisition systems are implemented via Internet network. In thisstudy we will discuss results collected at the observational sites located near Kharkov (Ukraine), Tromsø(Norway), at Svalbard (Norway) and at the Ukrainian Antarctic Station (UAS, Antarctic Peninsula, 65.25 S, 64.25W). The results of data processing show that heater signal simultaneously recorded at several spaced observationpoints can be used to study the "self-scattering" on ionospheric irregularities produced by the same HF pumpedwave. This effect was firstly observed for EISCAT heater at sites located, near Kharkiv, St. Petersburg and atUAS. High level of correlation of the temporal variations of the self-scattered spectra at different sites wasdetected. The observations of HAARP signal were used to calculate relaxation and rise times for the self-scatteredsignals. The average relaxation were shown to be several tens of seconds (40-60 s), while the observed risetimewas much longer, up to a few minutes. The power and spectral width of the scattered signals depend on theHAARP beam orientation and local ionospheric conditions were studied as well. Another effect, which is discussedhere, is enhancement of HAARP signal detected at UAS located 15.6 Mm from the heater. The possibleexplanation of this effect is propagation of the HAARP signal in the ionospheric interlayer waveguide. This effectwas commonly observed when the solar terminator passed simultaneously over the transmitting and receivingsites. The regular gradients of the electron density appears in the ionosphere during the solar terminator passagenear the observer can be responsible for signal output from the interlayer waveguide. The exaltation of thewaveguide may be produced by wave scattering on artificial or natural ionospheric plasma irregularities. In bothcases, area of the ionosphere near the heating facility will produce the dominant contribution to the variations ofspectra parameters recorded at UAS, because propagation in the interlayer waveguide occurs with small lossesand minimal spectral distortions. This effect was confirmed by good correlation between variations of Dopplerfrequency shift observed at UAS and D component of magnetic field measured close to HAARP. A clearcorrelation of the signal intensity recorded at UAS with amplitude of downshifted maximum and anticorrelation withstrength of broad upshifted maximum of SEE observed near HAARP were detected.14
15
The intersections of the areas with antenna pattern projection at the scattering level are shown by blue color. The model electron density profile and the height of upper hybrid resonance are shown on the top panel. From HAARP . to Tromso, Svalbard, Ukraine . HAARP beam orientation and local ionospheric conditions were studied as well .