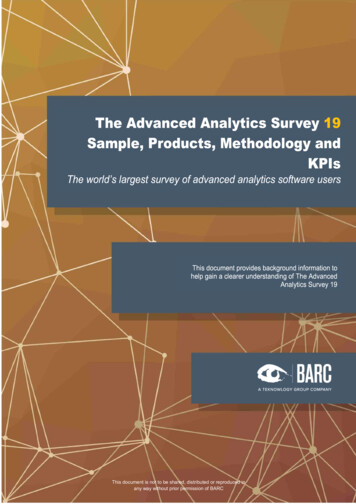
Transcription
This document is not to be shared, distributed or reproduced inany way without prior permission of BARC
Table of ContentsIntroduction . 3The sample . 3Sample size and make-up . 4Organization sizes by headcount . 4Vertical markets . 6Featured products . 7Peer groups . 9Overview of the key calculations in The Advanced Analytics Survey 19 . 10Measuring business benefits . 11Project success . 13Means and medians . 13Understanding multiple response questions . 13Survey data collection . 14Understanding the KPIs . 15Reading the KPI charts . 17The KPIs (overview) . 19Product picklist used in The Advanced Analytics Survey 19 . 28About BARC . 28The Advanced Analytics Survey 192
IntroductionThe Advanced Analytics Survey 19 is the largest and most thorough fact-based analysis of the advancedanalytics market currently available. It is not based on anecdotal accounts or personal opinions, unlikemuch analyst research, neither is it intended to be a measure of market shares. Instead, it sets out toanalyze market trends and produce meaningful comparisons of competing products across a wide rangeof critical software and vendor-related criteria. The Advanced Analytics Survey also provides a detailedquantitative analysis of why customers buy advanced analytics tools, what they are used for, whatproblems they experience with the tools and how successful they are.This is the first edition of The Advanced Analytics Survey. It features 10 products from 8 differentvendors and includes not just products from well-known global giants such as IBM or Microsoft, but alsotools from much smaller vendors that ordinarily don’t get much press but which, in many cases, offeroutstanding value to customers.After data cleansing and removing responses from participants unable to answer specific questionsabout their use of advanced analytics products, we were left with a sample of 386 end users,110 consultants and 70 vendor and reseller employees. Participants from all over the world took part inThe Advanced Analytics Survey 19. 14 percent of respondents stated they have a data lab job function;32 percent have an IT job function and the remainder perform various line-of-business roles.The findings from The Advanced Analytics Survey 19 are presented in several documents, eachfocusing on a specific set of the survey results.DocumentDescriptionThe Advanced Analytics Survey 19 – TheResultsAn overview and analysis of the most importantfindings and topical results from The AdvancedAnalytics Survey 19. Includes advice to buyers ofanalytics software as well as users of existinganalytics solutions based on the results of ouranalysis.The Advanced Analytics Survey 19 – Sample,Products, Methodology and KPIsProvides details of the sample, the productsincluded and an overview of our methodology.Descriptions of the KPIs used in The AdvancedAnalytics Survey 19 are also provided, includingdetails of our calculation methods.The Advanced Analytics Survey 19 – VendorPerformance SummariesA series of executive reports on each productfeatured in The Advanced Analytics Survey 19.Each report contains a short vendor and productoverview by BARC’s analyst team plus asummary of the relevant product-related resultsfrom The Advanced Analytics Survey 19.The sampleMost surveys are conducted or sponsored by an organization based in, and focused on, one country.However, advanced analytics is a worldwide market and we wanted to capture a larger internationalsample.The Advanced Analytics Survey 193
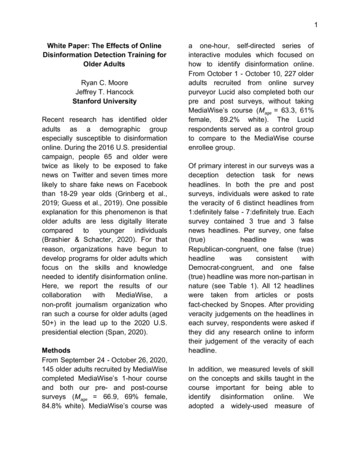
The net result was an extraordinarily international panel. Respondents were located in 68 countries. Thecountries with the most respondents are Germany, the United States and the United Kingdom. Theregions with the most respondents are Europe, North America and Asia Pacific.The online questionnaire was published in two languages: English and German.Sample size and make-upMany thousands of people around the world were invited to participate in The Advanced AnalyticsSurvey 19, using BARC’s online research panel and the support of vendors and various websites. Thequestionnaire offered different sets of questions for vendors and users (or consultants answering onbehalf of users).The results of the online data collected are shown in the following chart, with the numbers of responsesremoved also displayed.Table 1: Responses to the surveyResponsesTotal responses686100%-9-7%67793%-111-4%Vendor (did not answer questions about using products)-70-12%Total answering product-related questions49677%Filtered during data cleansingRemaining after data cleansing (total answering questions)Non-user (did not answer questions about products)The number of responses is split between users, consultants, vendors and non-users. Vendorsanswered a different set of questions to those answered by end users. This document focuses on theanalysis of the user gure 1: Is your organization using, or has it considered using, any advanced analytics, data discoveryor data preparation products or applications? (n 677)The Advanced Analytics Survey 194
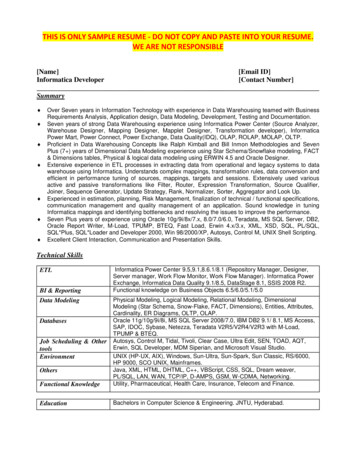
Organization sizes by headcountSpecialized advanced analytics software is most commonly found in medium and large organizations(see Figure 2). A high percentage of the responses we received are from users in companies with morethan 2,500 employees (see Figure 3).21%Less than 10043%100 - 2500More than 250036%Figure 2: How many employees are there in your entire organization, including all of its branches,divisions and subsidiaries? (n 389)Less than 5013%51-1008%101 - 2506%251 - 5008%501 - 10009%1001 – 250011%2501 – 1000022%10001 - 100000More than 10000017%5%Figure 3: How many employees are there in your entire organization, including all of its branches,divisions and subsidiaries? (n 389)The Advanced Analytics Survey 195
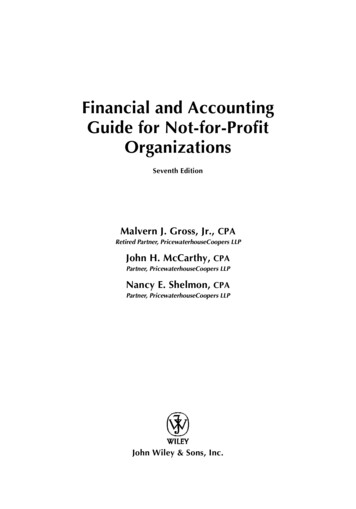
Vertical marketsWe asked all respondents which industry sector their company operates in. The chart below shows theresults of this question. Most respondents work in services, followed by manufacturing and the publicsector.Services24%Manufacturing19%Public sector and Education12%Financial 4%TransportTelecommunications4%1%Figure 4: Which of the following best describes your organization's industry sector? (n 582)The Advanced Analytics Survey 196
Featured productsWhen grouping and describing the products featured in The Advanced Analytics Survey, we did notstrictly follow the naming conventions the vendors use. Note that the names we use in this documentare our own and are not always the official product names used by the vendors.One of the key reasons for this is that the products we analyze are not necessarily the latest version ofthe tool. Vendors often change the product name between versions, making it difficult to have a singleofficial name for several versions of the same product. The point is not to challenge the namingconventions of the vendor, but simply to reduce the complexity of the survey findings for the convenienceof the reader. In some cases, we also shorten the names of the products to improve the formatting ofthe charts.We asked respondents explicitly about their experiences with products from a predefined list, with theoption to nominate other products. Our predefined list can be found at the end of this document. In caseswhere respondents said they were using an ‘other’ product, but from the context it was clear that theywere actually using one of the listed products, we reclassified their data accordingly.The following table shows the products included in the detailed analysis. In this, the first edition of TheAdvanced Analytics Survey, a minimum of around 15 responses is required for a product to be includedin the detailed analysis. The number of responses about ‘other’ products is not included in the followingtable.The Advanced Analytics Survey 197
Table 2: Products included in the sampleProduct labelProduct nameRespondentsAlteryxAlteryx Designer35DataikuDataiku DSS33IBM SPSS/WSIBM DSX, IBM SPSS Modeler, IBM SPSSStatistics19IBM SPSS/WS/CAIBM DSX, IBM SPSS Modeler, IBM SPSSStatistics, IBM Cognos Analytics26Microsoft Azure/SQLServerMicrosoft Azure ML, Microsoft SQL Server RServices/Machine Learning Server36Microsoft Power BIMicrosoft Power BI44QlikQlik Sense, QlikView21RapidMinerRapidMiner Studio21SASSAS Base, SAS Enterprise Guide, SAS EnterpriseMiner, SAS Visual Analytics/Statistics28TableauTableau24In this first edition of The Advanced Analytics Survey, ten products (or bundles of products) are featured.The products in the sample vary in their market focus and origin.The Advanced Analytics Survey 198
Peer groupsThe Advanced Analytics Survey 19 features a wide range of advanced analytics tools. Therefore, weuse peer groups to help readers identify and compare competing products. The peer groups are definedusing the criteria outlined in Table 3.The peer groups are designed to help readers compare similar tools in terms the scenarios the productsare used in. See Table 4 for an overview of the products in each peer group. These functional peergroups are mainly data-driven and based on how customers say they use the product.Table 3: Peer group descriptionsPeer groupDescriptionAdvanced analytics platformsAdvanced analytics is a generic term for analysis based onmathematical models. Its aim is to identify relationshipsbetween variables in order to derive insights from existing data(patterns) as well as new data (forecasts). This peer groupcontains advanced analytics platforms that provide a broadrange of algorithms. They also offer data preparation andvisualization functionality, together with options for modeldeployment.Data discovery productsData discovery is the business user/analyst driven process ofdiscovering patterns and outliers in data. This peer groupincludes products that focus on all the sub-elements of datadiscovery: data preparation, visual analysis and guidedadvanced analytics.Data preparation productsData preparation is the process of cleaning, structuring andenriching data for use in data discovery and/or advancedanalytics. This peer group includes products and vendors thatsupport these tasks.Software generalistsThe ‘Software generalists’ peer group includes products whichare part of a vendor’s broader business software portfolio.Customers that standardize on such vendors may be moreinclined to select their standard provider’s solutions.The Advanced Analytics Survey 199
Table 4: Products by peer group matrixAdvancedanalyticsplatformsAlteryxDataikuIBM SPSS/WSIBM SPSS/WS/CAMicrosoft Azure/SQL ServerMicrosoft Power BIQlikRapidMinerSASTableauThe Advanced Analytics Survey xxxxxxxxxxxxxxxxxxxSoftwaregeneralistsxxxxx10
Overview of the key calculations in The Advanced Analytics Survey 19Measuring business benefitsBusiness benefits are the real reason for carrying out any analytics project. For each potential benefit,respondents are asked to indicate their level of achievement, if any, with five levels. We use a weightedscoring system, as shown in Table 5 below, to derive a composite score for each of the possible benefits,based on the level of benefit achieved. We call this the BBI (Business Benefits Index).Table 5: The Business Benefits Index weighting systemLevel of benefit reportedWeightingHigh10Moderate6Low2Not achieved-2Don't know0This rating system is the basis of the most important index in the survey. It is a dimensionless numberwith an arbitrary value, but as long as the weighting system remains constant it can be used forcomparisons between segments of the sample, such as the sample for individual products or regions,to name just two.Participants were asked to rate each benefit. Business benefits are calculated by counting the numberof each reported level of benefit and multiplying this number by the corresponding weighting. The resultsare then divided by the number of responses for each particular benefit to find the average response(See Figure 5).Figure 5 demonstrates that ‘improved time to insight’, ‘increased transparency of data usage’ and‘incre
32 percent have an IT job function and the remainder perform various line-of-business roles. The findings from The Advanced Analytics Survey 19 are presented in several documents, each focusing on a specific set of the survey results. Document Description The Advanced Analytics Survey 19 – The Results An overview and analysis of the most important findings and topical results from The .