Transcription
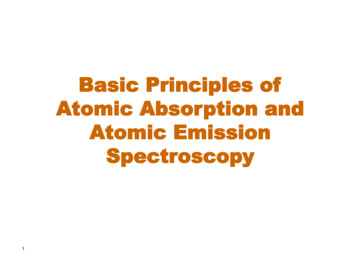
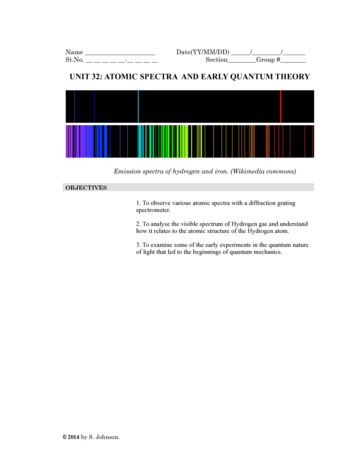
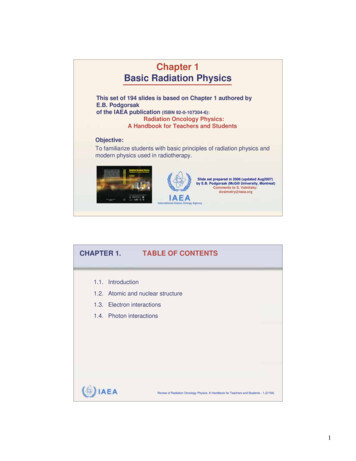
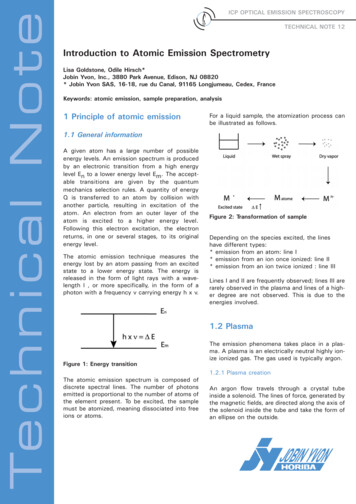
ICP OPTICAL EMISSION SPECTROSCOPYTECHNICAL NOTE 12Introduction to Atomic Emission SpectrometryLisa Goldstone, Odile Hirsch*Jobin Yvon, Inc., 3880 Park Avenue, Edison, NJ 08820* Jobin Yvon SAS, 16-18, rue du Canal, 91165 Longjumeau, Cedex, FranceKeywords: atomic emission, sample preparation, analysis1 Principle of atomic emissionFor a liquid sample, the atomization process canbe illustrated as follows.1.1 General informationA given atom has a large number of possibleenergy levels. An emission spectrum is producedby an electronic transition from a high energylevel En to a lower energy level Em. The acceptable transitions are given by the quantummechanics selection rules. A quantity of energyQ is transferred to an atom by collision withanother particle, resulting in excitation of theatom. An electron from an outer layer of theatom is excited to a higher energy level.Following this electron excitation, the electronreturns, in one or several stages, to its originalenergy level.The atomic emission technique measures theenergy lost by an atom passing from an excitedstate to a lower energy state. The energy isreleased in the form of light rays with a wavelength l , or more specifically, in the form of aphoton with a frequency v carrying energy h x v.Figure 2: Transformation of sampleDepending on the species excited, the lineshave different types:* emission from an atom: line I* emission from an ion once ionized: line II* emission from an ion twice ionized : line IIILines I and II are frequently observed; lines III arerarely observed in the plasma and lines of a higher degree are not observed. This is due to theenergies involved.1.2 PlasmaFigure 1: Energy transitionThe atomic emission spectrum is composed ofdiscrete spectral lines. The number of photonsemitted is proportional to the number of atoms ofthe element present. To be excited, the samplemust be atomized, meaning dissociated into freeions or atoms.The emission phenomena takes place in a plasma. A plasma is an electrically neutral highly ionize ionized gas. The gas used is typically argon.1.2.1 Plasma creationAn argon flow travels through a crystal tubeinside a solenoid. The lines of force, generated bythe magnetic fields, are directed along the axis ofthe solenoid inside the tube and take the form ofan ellipse on the outside.
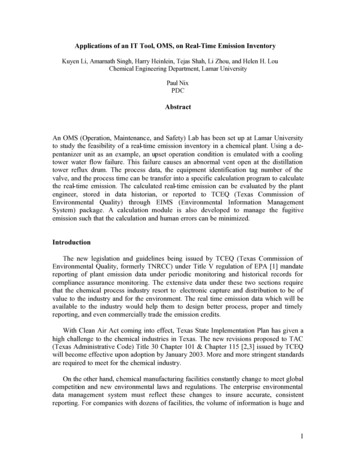
ICP OPTICAL EMISSION SPECTROSCOPYTECHNICAL NOTE 12An electrical discharge is created to arc the plasmaby partially ionising the gas in the torch.The electrons produced are subjected to the magnetic field induced and circulate along the axis ofthe crystal tube describing annular circuits. Inducedor eddy currents are thus produced. The electronpath is stopped by collision, resulting in heating andionisation of the other gas atoms. The plasma is selfmaintaining and continous.2 Analysis2.1 IntroductionAs discussed previously, an atom subjected to aplasma emits characteristic photons. This propertymakes it possible to perform a qualitativeanalysis. The number of photons emitted is proportional to the number of atoms of the considered element. This is the basis of the quantitative analysis.2.2 Qualitative analysisA qualitative analysis consists of searching for theelements in an unknown sample.JY. The linesrecorded reveal the presence of an element. Anapproximate quantification can also be performed.To select the lines, see the wavelength tables. Notethat experience will play a major role in interpretingthe spectra. This semi-quantitative analysis can beperformed very rapidly using the JY Win-IMAGEoption.2.3 Quantitative analysisFigure 3 : Magnetic field1.2.2 Plasma gasThe gas generally used is argon, which like all raregases, is monatomic, chemically inert and has a highionisation energy (15.6 eV). A certain number ofadvantages are provided by argon:- Emission of a relatively simple spectrum producinglittle spectral interference in emission spectrometry,- Capacity to atomise, ionise and excite most of theelements of the periodic table,- Absence of formation of stable compositesbetween argon and elements,- Lower cost than that of other rare gases as it is themost widely available (1 % in air).Its only limitation is its low thermal conductivitycompared to that of molecular gases such as nitrogen or oxygen. During heating, the argon ions transfer energy to the atoms present in the sample solutions.The quantitative analysis links the energy emitted tothe number of atoms contained in the sample.Atomic emission is not an absolute method. Therelation existing between the intensity emitted by aline and the concentration of the associated elementmust be calculated: this is called the line calibrationcurve. The advantage of ICP-OES is that these calibration curves are, in most cases, linear to severalorders of concentration. Great care must be taken incalculating these curves as they will determine theultimate accuracy of the analysis.2
ICP OPTICAL EMISSION SPECTROSCOPYTECHNICAL NOTE 12Repeatability: Represents the fluctuations of thesignal during a single reading under the same measurement conditions.Reproducibility: Represents the fluctuations of thesignal when one of the measurement parametershas varied.Figure 4: Calibration line2.4 Analytical performanceAn emission spectrometer provides a large numberof analytical performance features: accuracy,repeatability, reproducibility, selectivity, robustness,sensitivity, detection limit, linearity, dynamic range The main terms are defined below:Accuracy: The accuracy of an instrument is itscapacity to give results that are free of systematicerror, meaning having a good degree of exactitude.The accuracy is evaluated by the differencebetween the measured mean value and the truevalue of element concentration.Blank: Matrix without analytesRobustness: Capacity of plasma to accept differentchanges without significant variation in elementconcentration. These changes can come from thematrix, the analytical parameters or the environment.Sensitivity: Slope of the calibration line; signalintensity versus concentration.Uncertainty: Estimation within which the true valueis located.2.4.1 Repeatability, reproducibility and accuracyThese three terms are often understood to meanthe same thing. Repeatability and reproducibility areexpressed as a relative standard deviation. The onlydifference is the fact that for reproducibility, one ofthe parameters has varied. Accuracy is a principlethat can be difficult to measure. It is evaluatedusing certified reference materials. It mainlydepends on the calibration curve and the preparation of the samples.The repeatability and accuracy concepts can besummarised using a target. The true value being thecenter of the target.Detection limit: Smallest concentration which canbe detected with certainty with respect to a blankError: Deviation between the mean value and thetrue valueFidelity: Capacity of an instrument to give goodrepeatability.Long term stability: Equivalent to repeatability overa long period of time (several hours).Precision: Corresponds to repeatability and reproducibility.Quantification limit: Concentration corresponding toa given repeatability (for example 5%).Figure 5: Repeatability and AccuracyIn figure 5 the second case is better than the third,even though the result seems bad (high relativestandard deviation).3
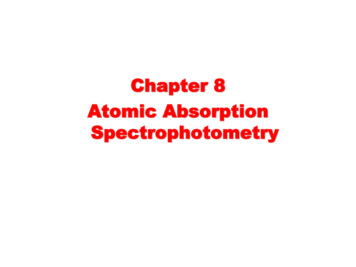
ICP OPTICAL EMISSION SPECTROSCOPYTECHNICAL NOTE 122.4.2 Detection limits (LOD), Quantification limit(LOQ)Here, we assume that the fluctuation of the spectral background follows a Gaussian distributiondefined by its standard deviation.expressed in multiples of standard deviation.Figure 8 shows the influence of the coefficient k onthe percentage of error.Figure 8: Smallest detectable signal XLFigure 6: Gaussian distribution of spectral background distribution fluctuationsThe detection limit is derived from the signal thatwill be statistically possible to extract from thebackground. This comes down to stating the following question: does a measurement point belongto the background or to the signal?k corresponds to a safety coefficient. The higherthe k, the easier it will be to differentiate a signalpoint from a background point.IUPAC recommends applying k 3. The percentage of error is then 13%.Three equivalent formulas are used to express thedetection limit:(CL., concentration limit) :(1) CL 3 C SB /S(2) CL 3 C RSDB/SBR(3) CL 3 BEC RSDBWhere,S net signal of solutionC concentration of solution measured.sB standard deviation of blankRSDB standard deviation relative to blankSBR signal to background ratioBEC Background Equivalent ConcentrationFormula (2) is mainly used for plasma optimisation.Formula (3) is used to calculate the detection limitsfor a given matrix following a calibration.The Background Equivalent Concentration (BEC) isrepresented on the figure 9. It corresponds to theconcentration for which the signal is equal to thebackground (S B or SBR 1).Figure 7: Detection of a point among the background noiseThe Figure 7 represents the overlap of the fluctuations of background B and signal S as a function ofthe deviation between the two mean values,4
ICP OPTICAL EMISSION SPECTROSCOPYTECHNICAL NOTE 122.4.3 RobustnessIDepending on the composition of the matrix, thesame concentration of an element will not give thesame signal.For example, 5 ppm of Mg in water orin NaCl 10 g/L does not give the same net intensity.Figure 9 : Background Equivalent Concentration(BEC)BEC is the absolute value of the ordinate of the origin of the calibration curve when no backgroundcorrection is applied. If a background correction isapplied, use formula (2).For the detection limit, RSD is expressed:RSD (1 / k ) 2Therefore, for k 3, RSD 47%.To define the quantification limit, you define themaximum desired RSD, for example 5 or 10%.RSD 10%, for LOQ 4.5 LODRSD 5%, for LOQ 10 LODRSD 2% for LOQ 30 LODGenerally, the minimum LOQ used 3 LOD.The detection limit is an estimation.The quantification limit is a measurement.The detection limit can be calculated in water or ina special matrix. It is very important to know thedetection and quantification limits for each of theapplications.Figure 10: Influence of matrixTo minimize this difference, the most robust plasmapossible must be used. The robustness can be evaluated by the ratio between two lines (an ionic lineand an atomic line). For this purpose, we use theratio provided by two Magnesium lines:Mg II 280 nm/ Mg I 285 nm.The higher the ratio, the more robust is the plasma.A plasma is robust when the ratio of magnesium isgreater than 6. In this case, the plasma is in thermodynamic equilibrium.3 Sample PreparationThe samples are usually introduced into the plasmain solution form but solids, finely divided, can alsobe used. Care should be taken in obtaining a solution of a solid sample since there is a risk of loss ofelement, or contamination. The final solutionobtained by the analyst depends on the nature ofthe sample and the concentration of elements to bedetermined.Two main types of sample preparation are used forICP analysis:- Acid Digestion.- Dry attack.5
ICP OPTICAL EMISSION SPECTROSCOPYTECHNICAL NOTE 123.1 Acid Digestion3.3 RemarksAcids, whether singly or in a mixture, use their oxidising or reducing properties. Care must be takenwith respect to possible loss of volatile elements.For example, loss of As, Se, Sn in the form of chloride in the presence of HCl. Creation of precipitatesof Ca, Ba, Pb also represents a possible error in thepresence of H2SO4. Open and closed microwave- Whatever the type of solution, the quantity of acidor flux must be as low as possible to ensure minimum perturbation of the plasma. Certain acids arepreferable to others as they perturb the plasmaless.3.2 Dry attack- Caution, HF requires a specific sample introduction system.systems are increasingly used in laboratories.Alkaline fusion is often used, as well as high-temperature calcination (450 - 600 C) with acidrecovery of ashes. Care must be taken with respectto contaminants introduced by the reagents. Lossesby volatilisation and insolubilisation can be morethan negligible.In the USA:Jobin Yvon Inc.3880 Park AvenueEdison, NJ 08820Tel: 1-732-494-8660Fax: HORIBAIn France:Jobin Yvon S.A.S.16-18, rue du Canal91165 Longjumeau CedexTel: (33) 1/64 54 13 00Fax: (33) 1/69 09 90 88Order of preference (from more favorable to leastfavourable): HNO3, HCl, HCLO4, H2SO4, H3PO4.- Na has a high depressive effect on sensitivity.- The presence of hydrofluoric acid can result in theformation of Ca, Mg Mn fluoride precipitates.This occurs frequently during mineralization of geological products, even after evaporation of thehydrofluoric acid. This can be avoided by adding afew drops of boric acid.In Japan:Horiba Ltd.2 Miyanohigashi, KisshoinMinami-ku, Kyoto 601-8510TEL: (81) 75 313 8121FAX: (81) 75 321 5725www.horiba.comGermany: (49) 89/46 23 17-0 China: (86) 10/68 49 2216Spain: (34) 91/724 16 57Italy: (39) 2/57 60 56 90U.K.: (44) 20/82 04 81 42Other Countries: Contact JYS.A.S.6
Keywords: atomic emission, sample preparation, analysis 1 Principle of atomic emission 1.1 General information A given atom has a large number of possible energy levels. An emission spectrum is produced by an electronic transition from a high energy level En to a lower energy level Em. The accept-able transitions are given by the quantum